Sample Size Variation
In this study, we will investigate the effect of sample size variation, N, on the level of bias, and probablity of finding significant results. We will also investigate whether Researcher's perseverance to design studies with N ~ 20 is driven by an unwritten property of this specific sample size.
Study Design
As with our selection variation study, we simulate a range of parameters; however, we will only use one of the listed policies, InitialS, as we have shown that there is no meaningful difference between them, see here.
- μ ∈ [0, 1]
- Pb ∈ {0, 0.1, 0.25, 0.5, 0.75, 0.9, 0.95}
- m ∈ {2, 3, 4, 5, 6}
- N ∈ {8, 9, ..., 99, 100}
- InitialS,
["sig", "effect > 0", "random"], ["effect > 0", "min(pvalue)"], ["effect < 0", "max(pvalue)"]
In order to get an accurate picture of landscape of ES Bias, and PFS, we will simulate a full range of true effect sizes between 0 and 1, as well as a wide range of possible sample sizes.
Results
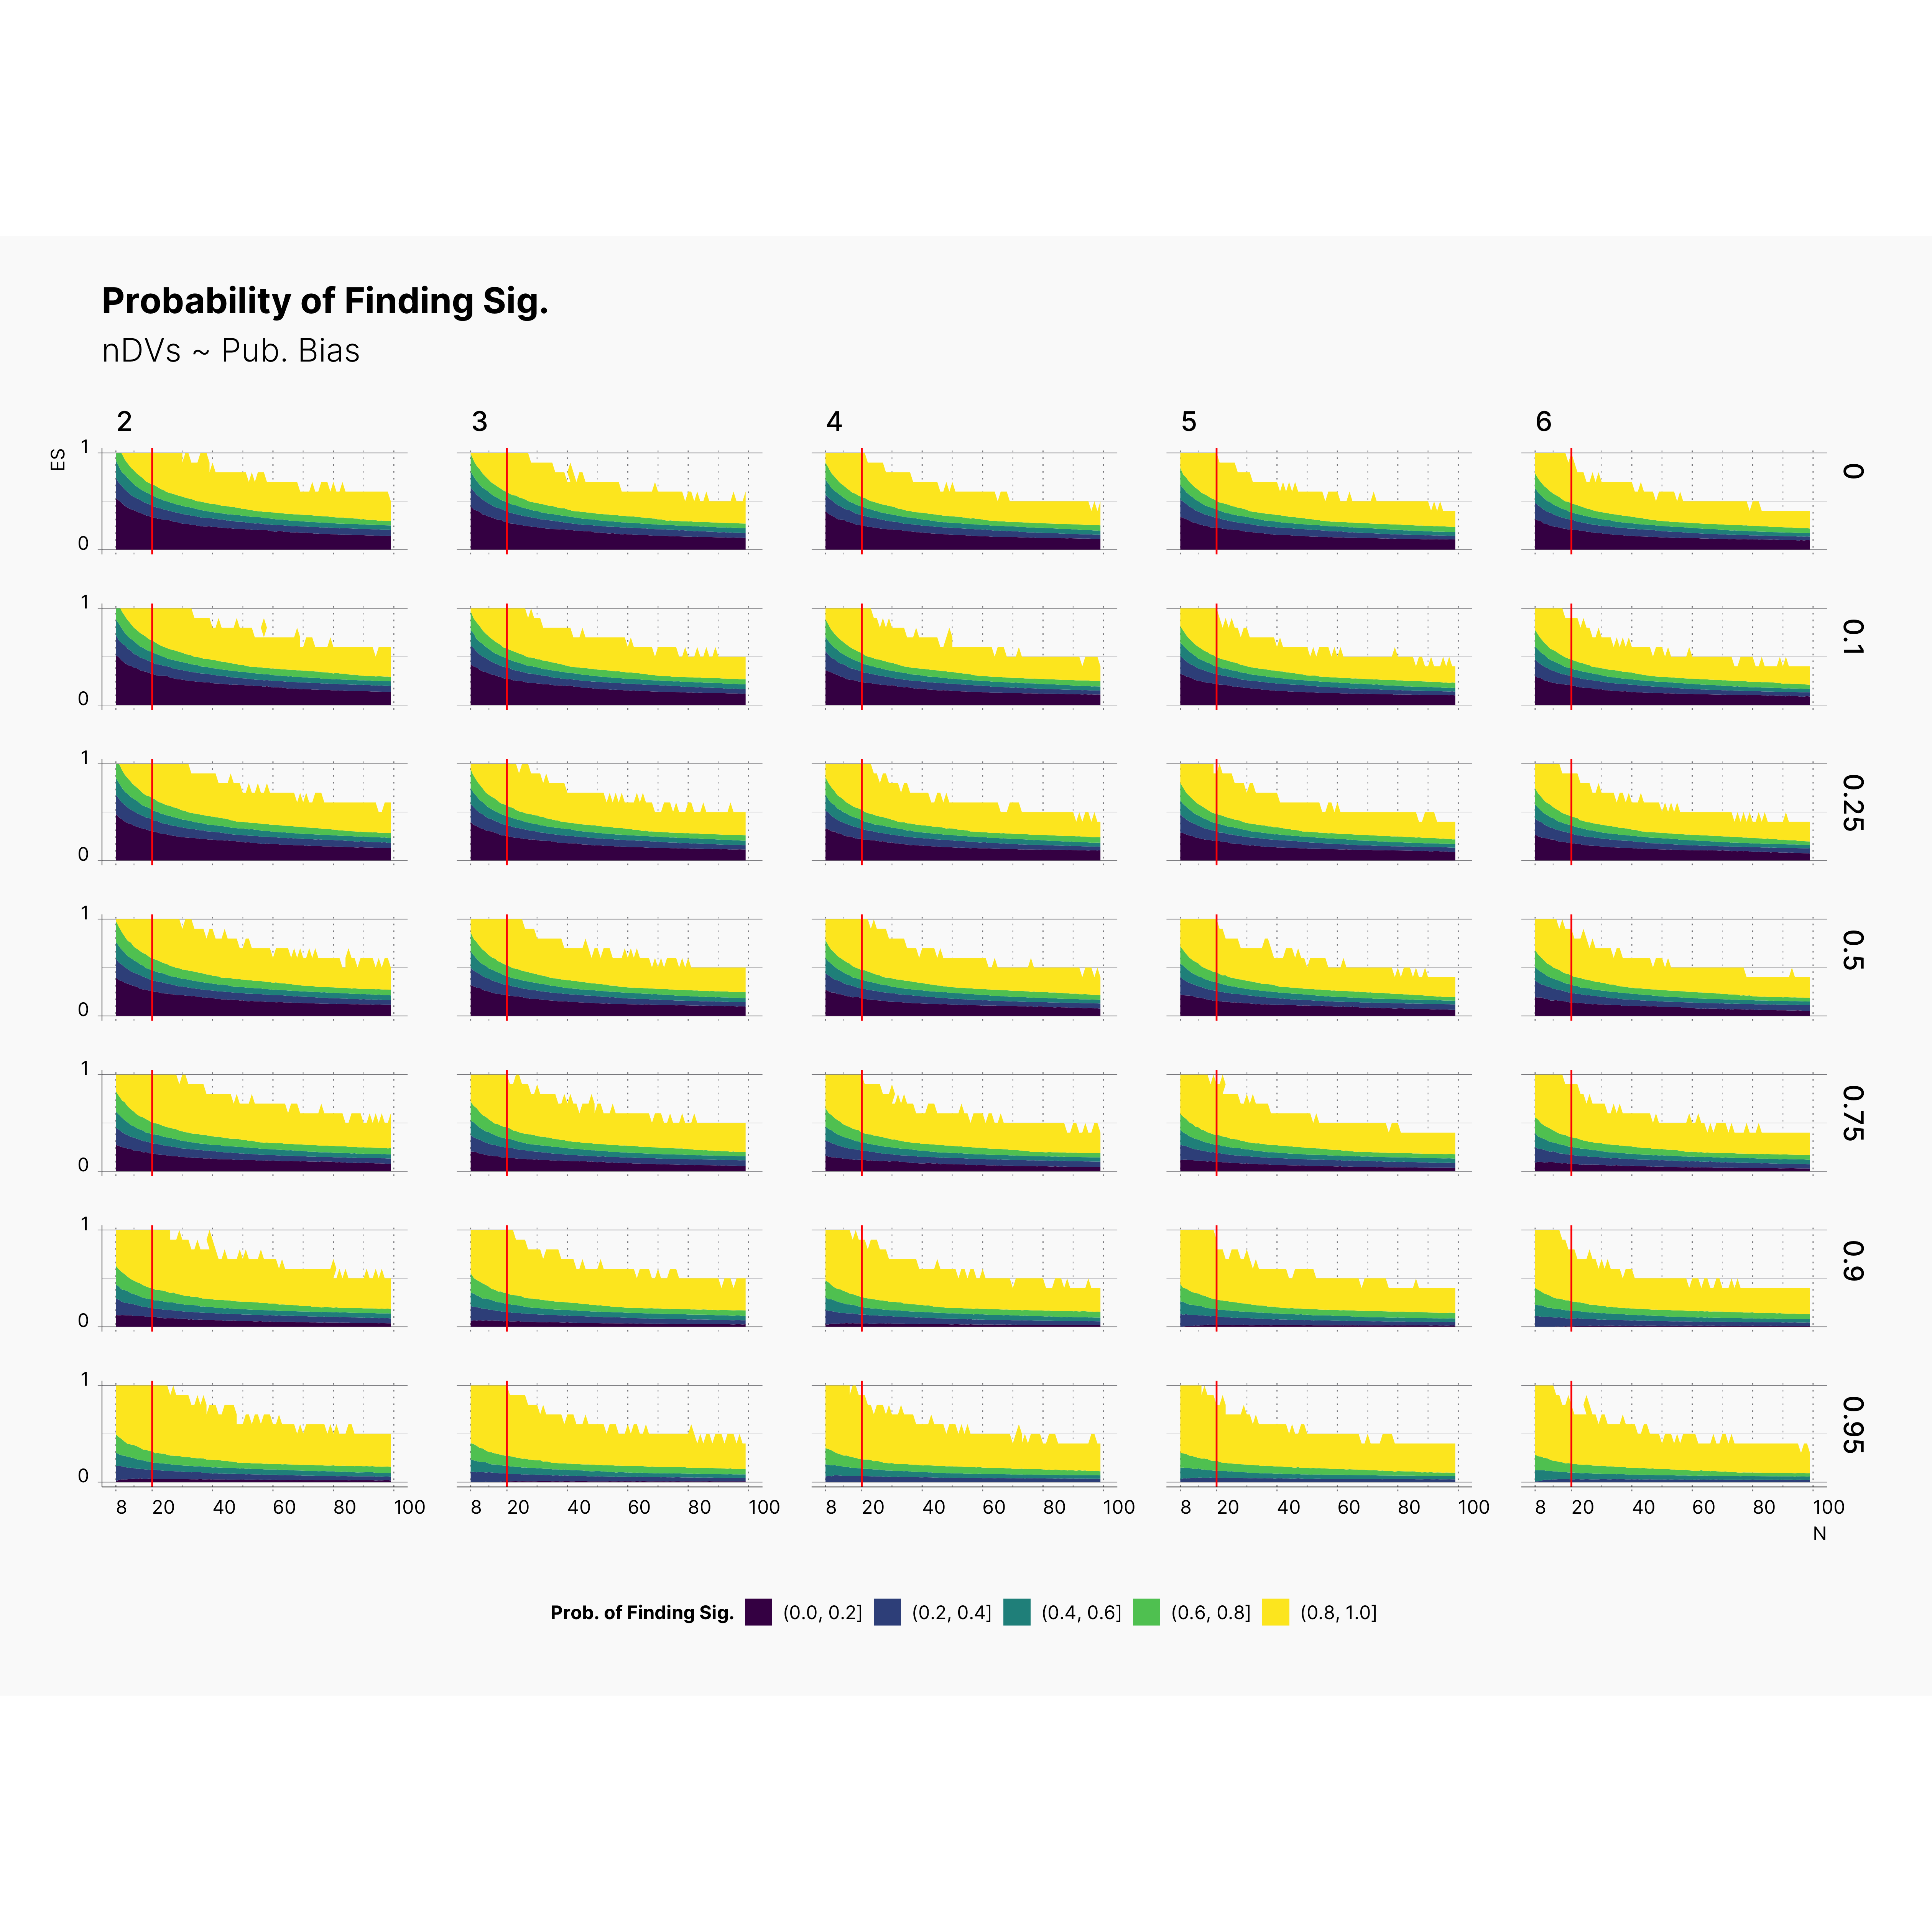
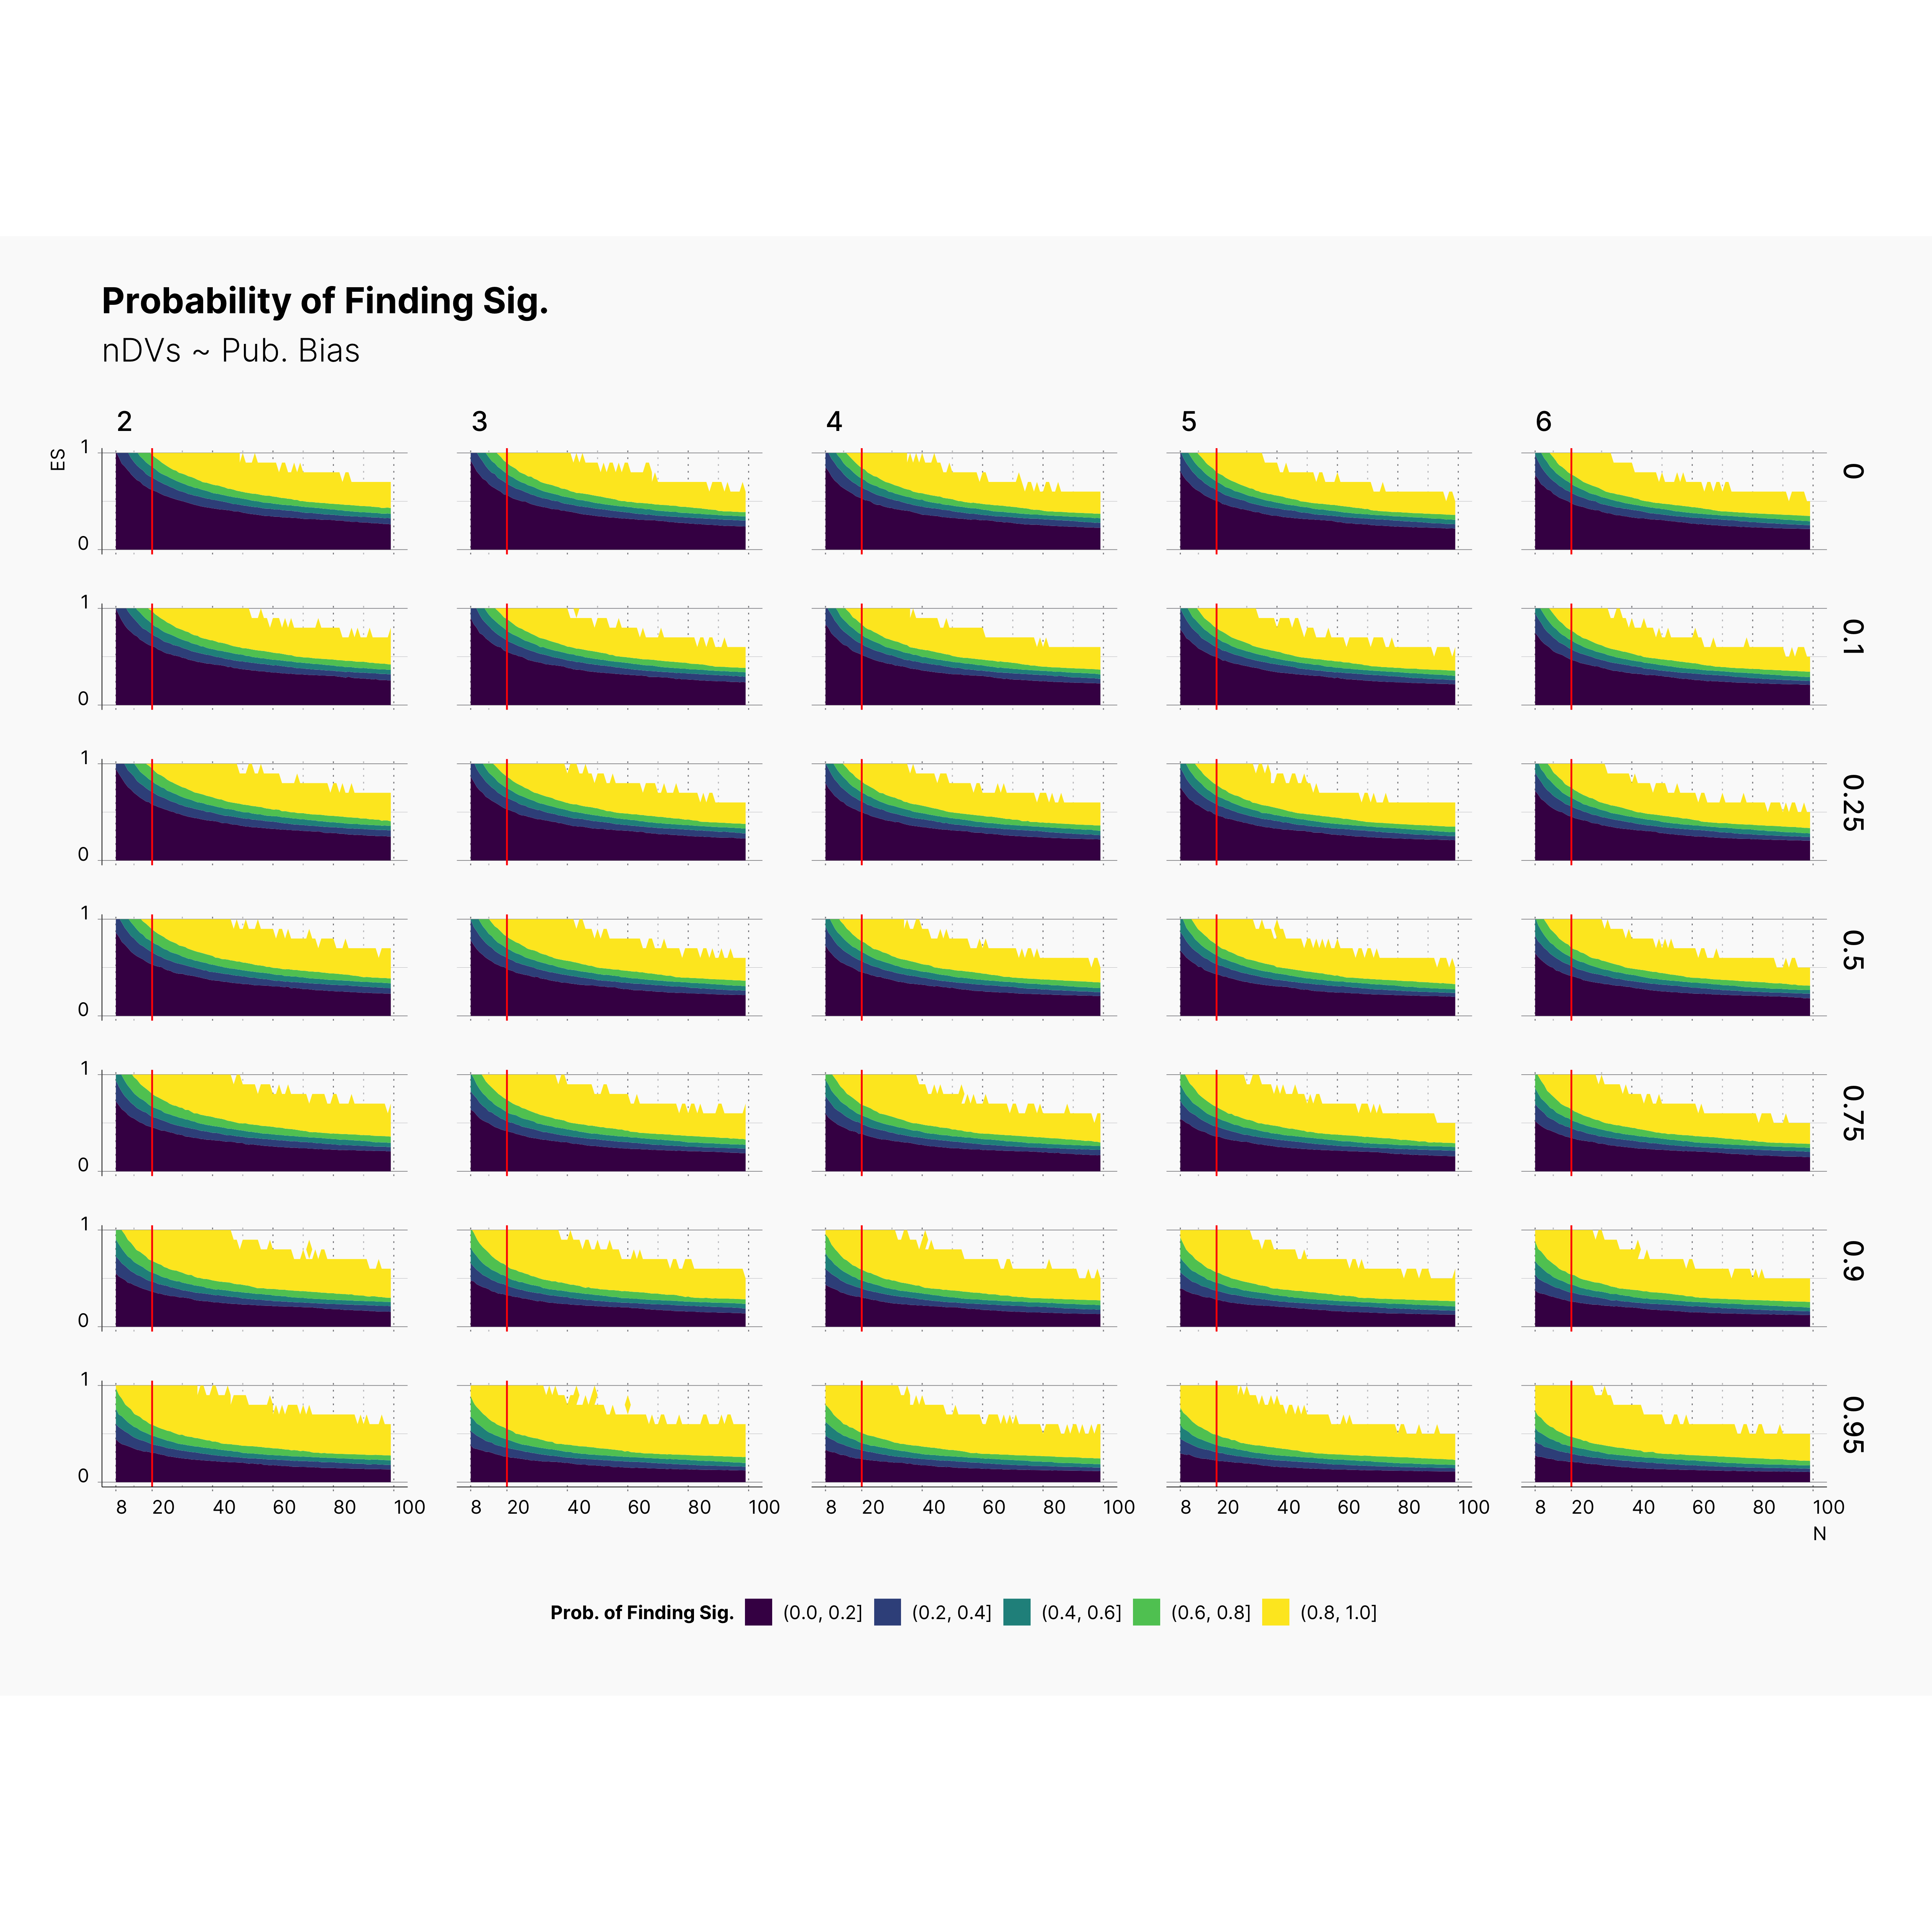
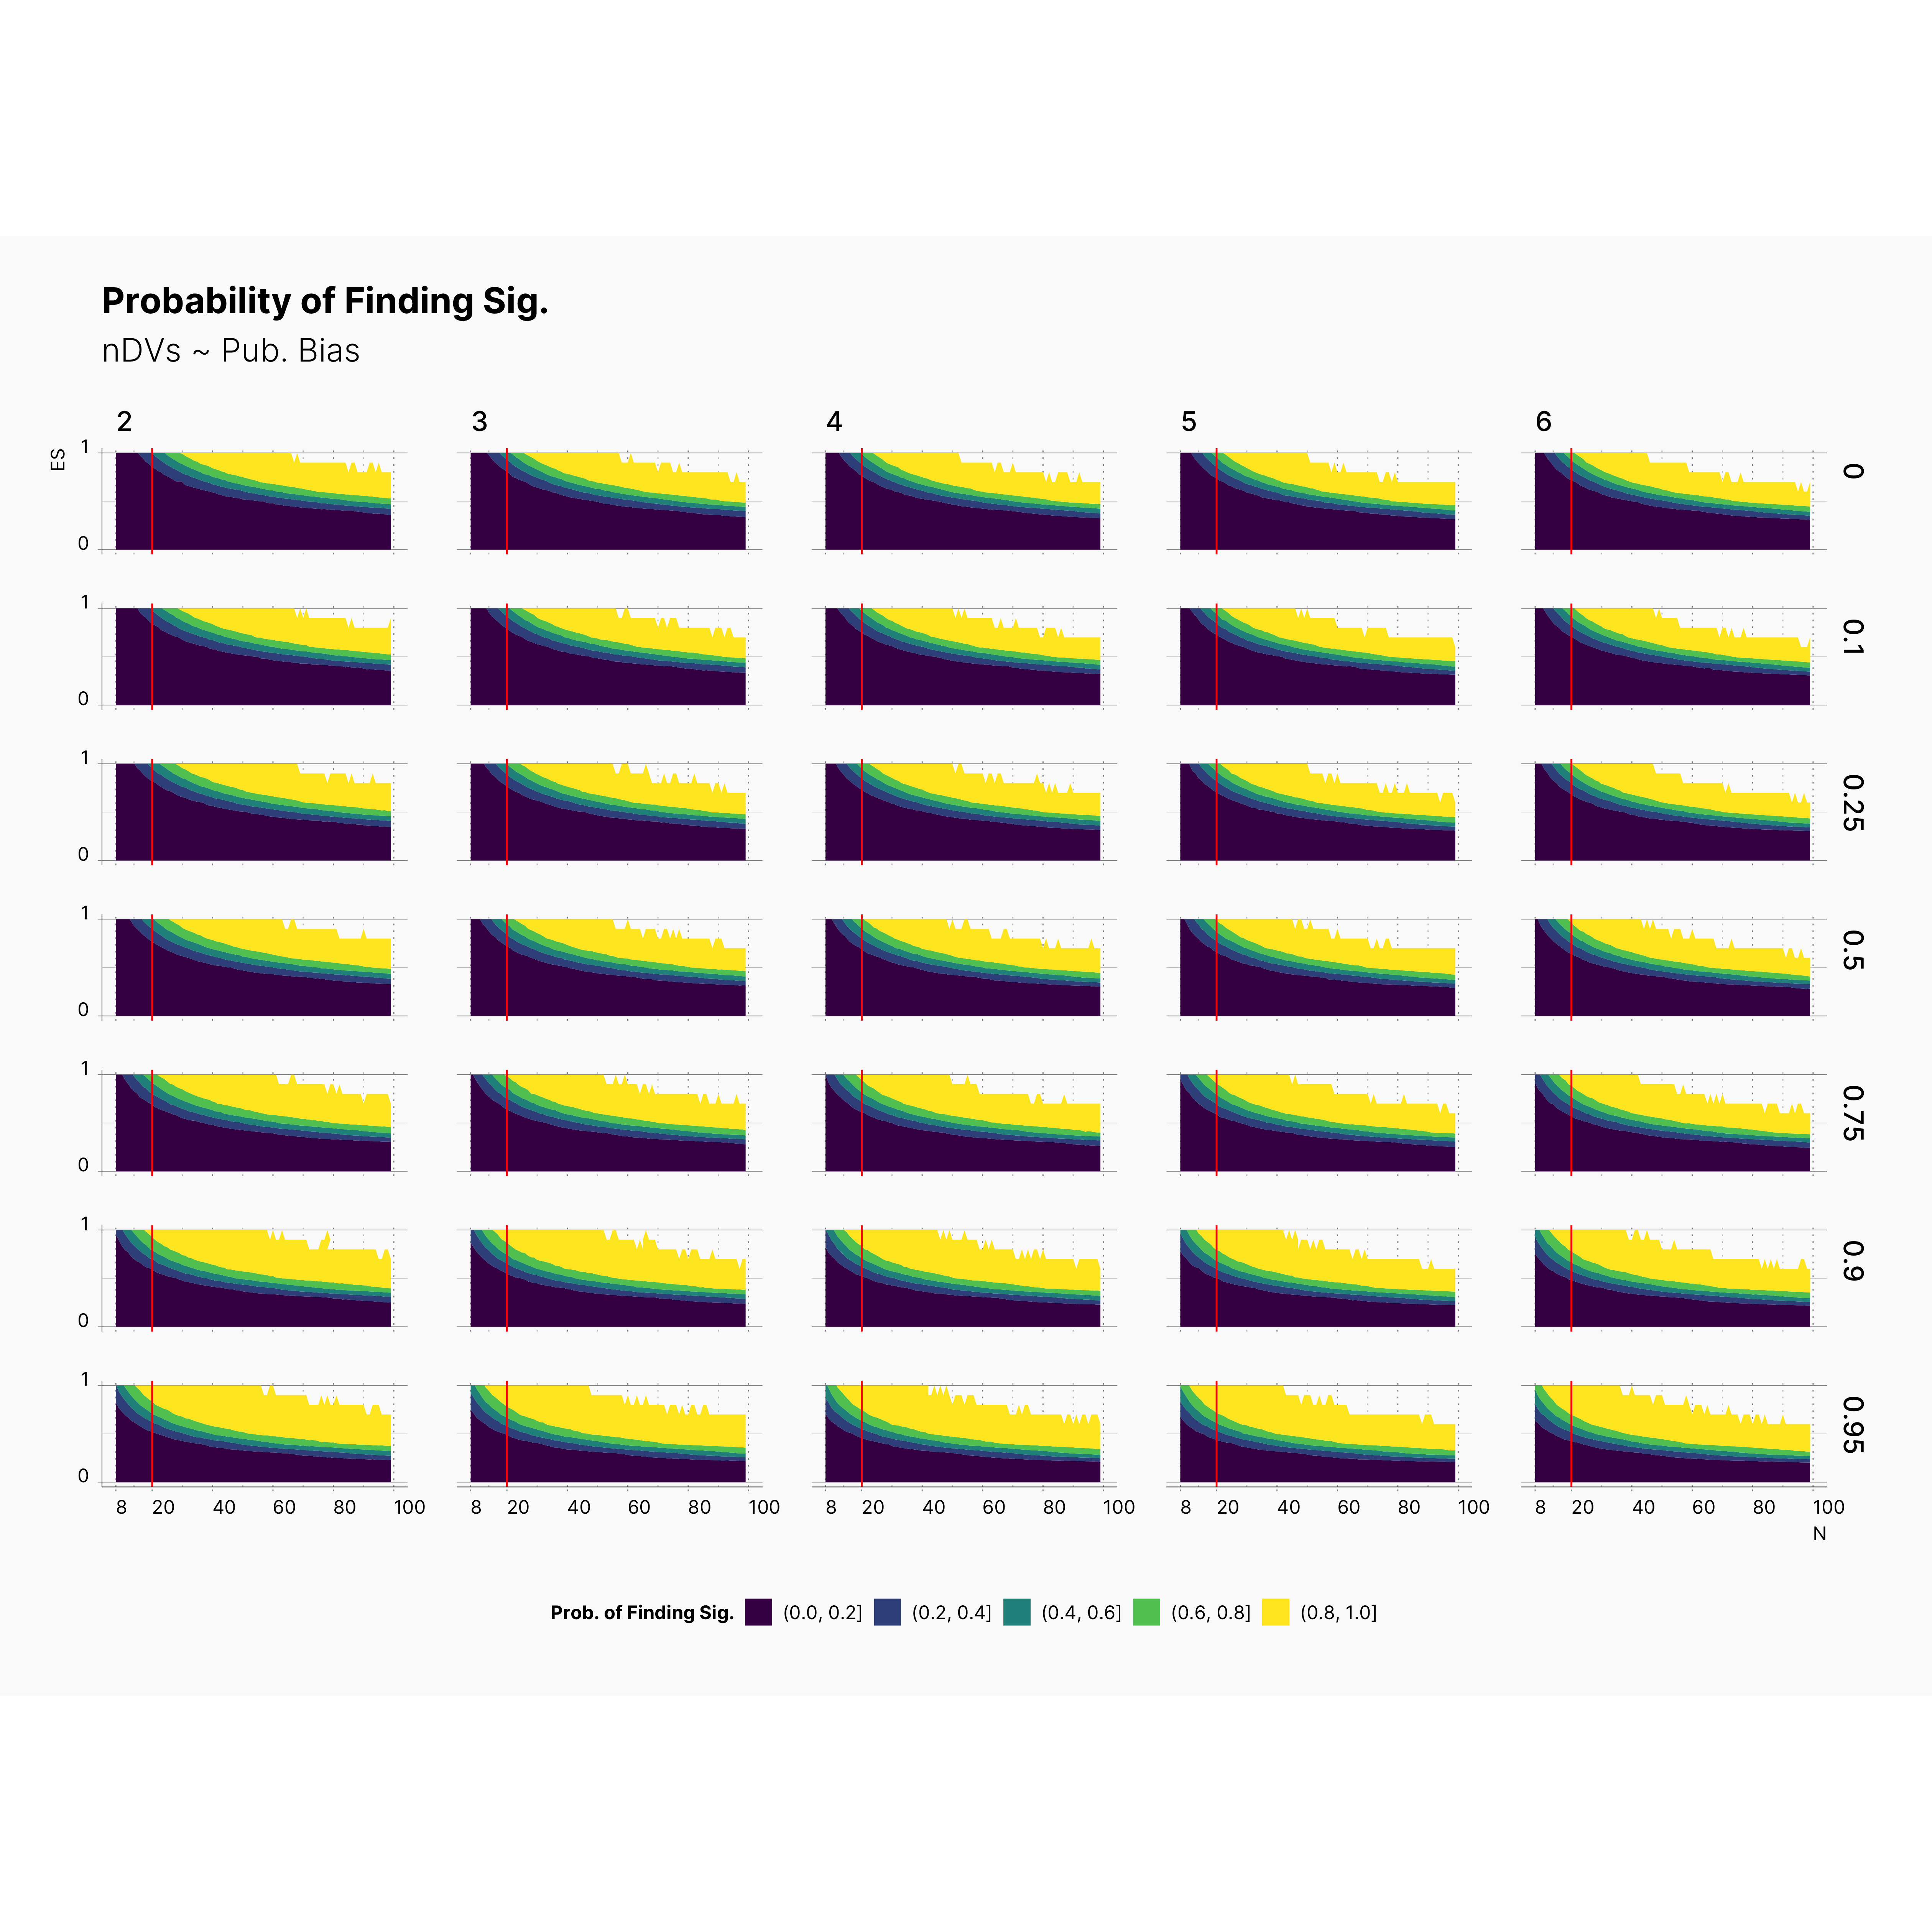
Figure below shows the contour plot of PFS against true effect size, μ (y-axis), and sample size, N (x-axis). Additionally, each row is dedicated to a specific level of publication bias, Pb, and each column presents a set of studies with different number of dependent variables, m. Finally, the vertical red indicator accross all plots corresponds to N = 20.
As we can see by following the trace of yellow region, ie., a region with highest PFS, Researcher's chance of finding significant results with higher effect sizes declines as the number of dependent variables decreases. Notice the slight shift of the yellow region — at the top left corner — from right to left (and top to bottom) accross all configurations as we increase the number of dependent variables. While other regions has higher concenration of significant results, the yellow region provides the higher proportion of significant results.
In fact, this is the region that provides highest reward meaning if conducting a study in this region will most likely leads to an outcome with significant results.
That being said, notice that fact that, in almost all configurations, the yellow region is always available for N < 20. What this entails is the fact that N ≲ 20 always stays a viable region with high chance of finding signficant results — despite all variation of all other parameters —, with m = 2 providing the highest chance of finding something significant among studies with N ≲ 20.
Expectedly, researcher's chance of finding significant result declines as we lower ɑ. However, looking closely at results, we can conclude while researcher does not have as high of a chance of finding significant results, – ie., yellow region with [80%, 100%] – his chance of finding significant is still quite high and varies between 0% to 80%, with [20%, 80%] providing plenty oppurtunities.
We should also point out the fact that even within very low ɑ-levels, researches with N ≲ 20 still have a higher chance of finding significant. More noticably, increasing the publication bias streches the yellow region downward by emphasizing on significant studies.
In fact, we speculate that journals with higher publication bias are most likely accumulating more studies with N ≲ 20.
Landscape of Probablity of Finding Significant
Landscape of ES Bias
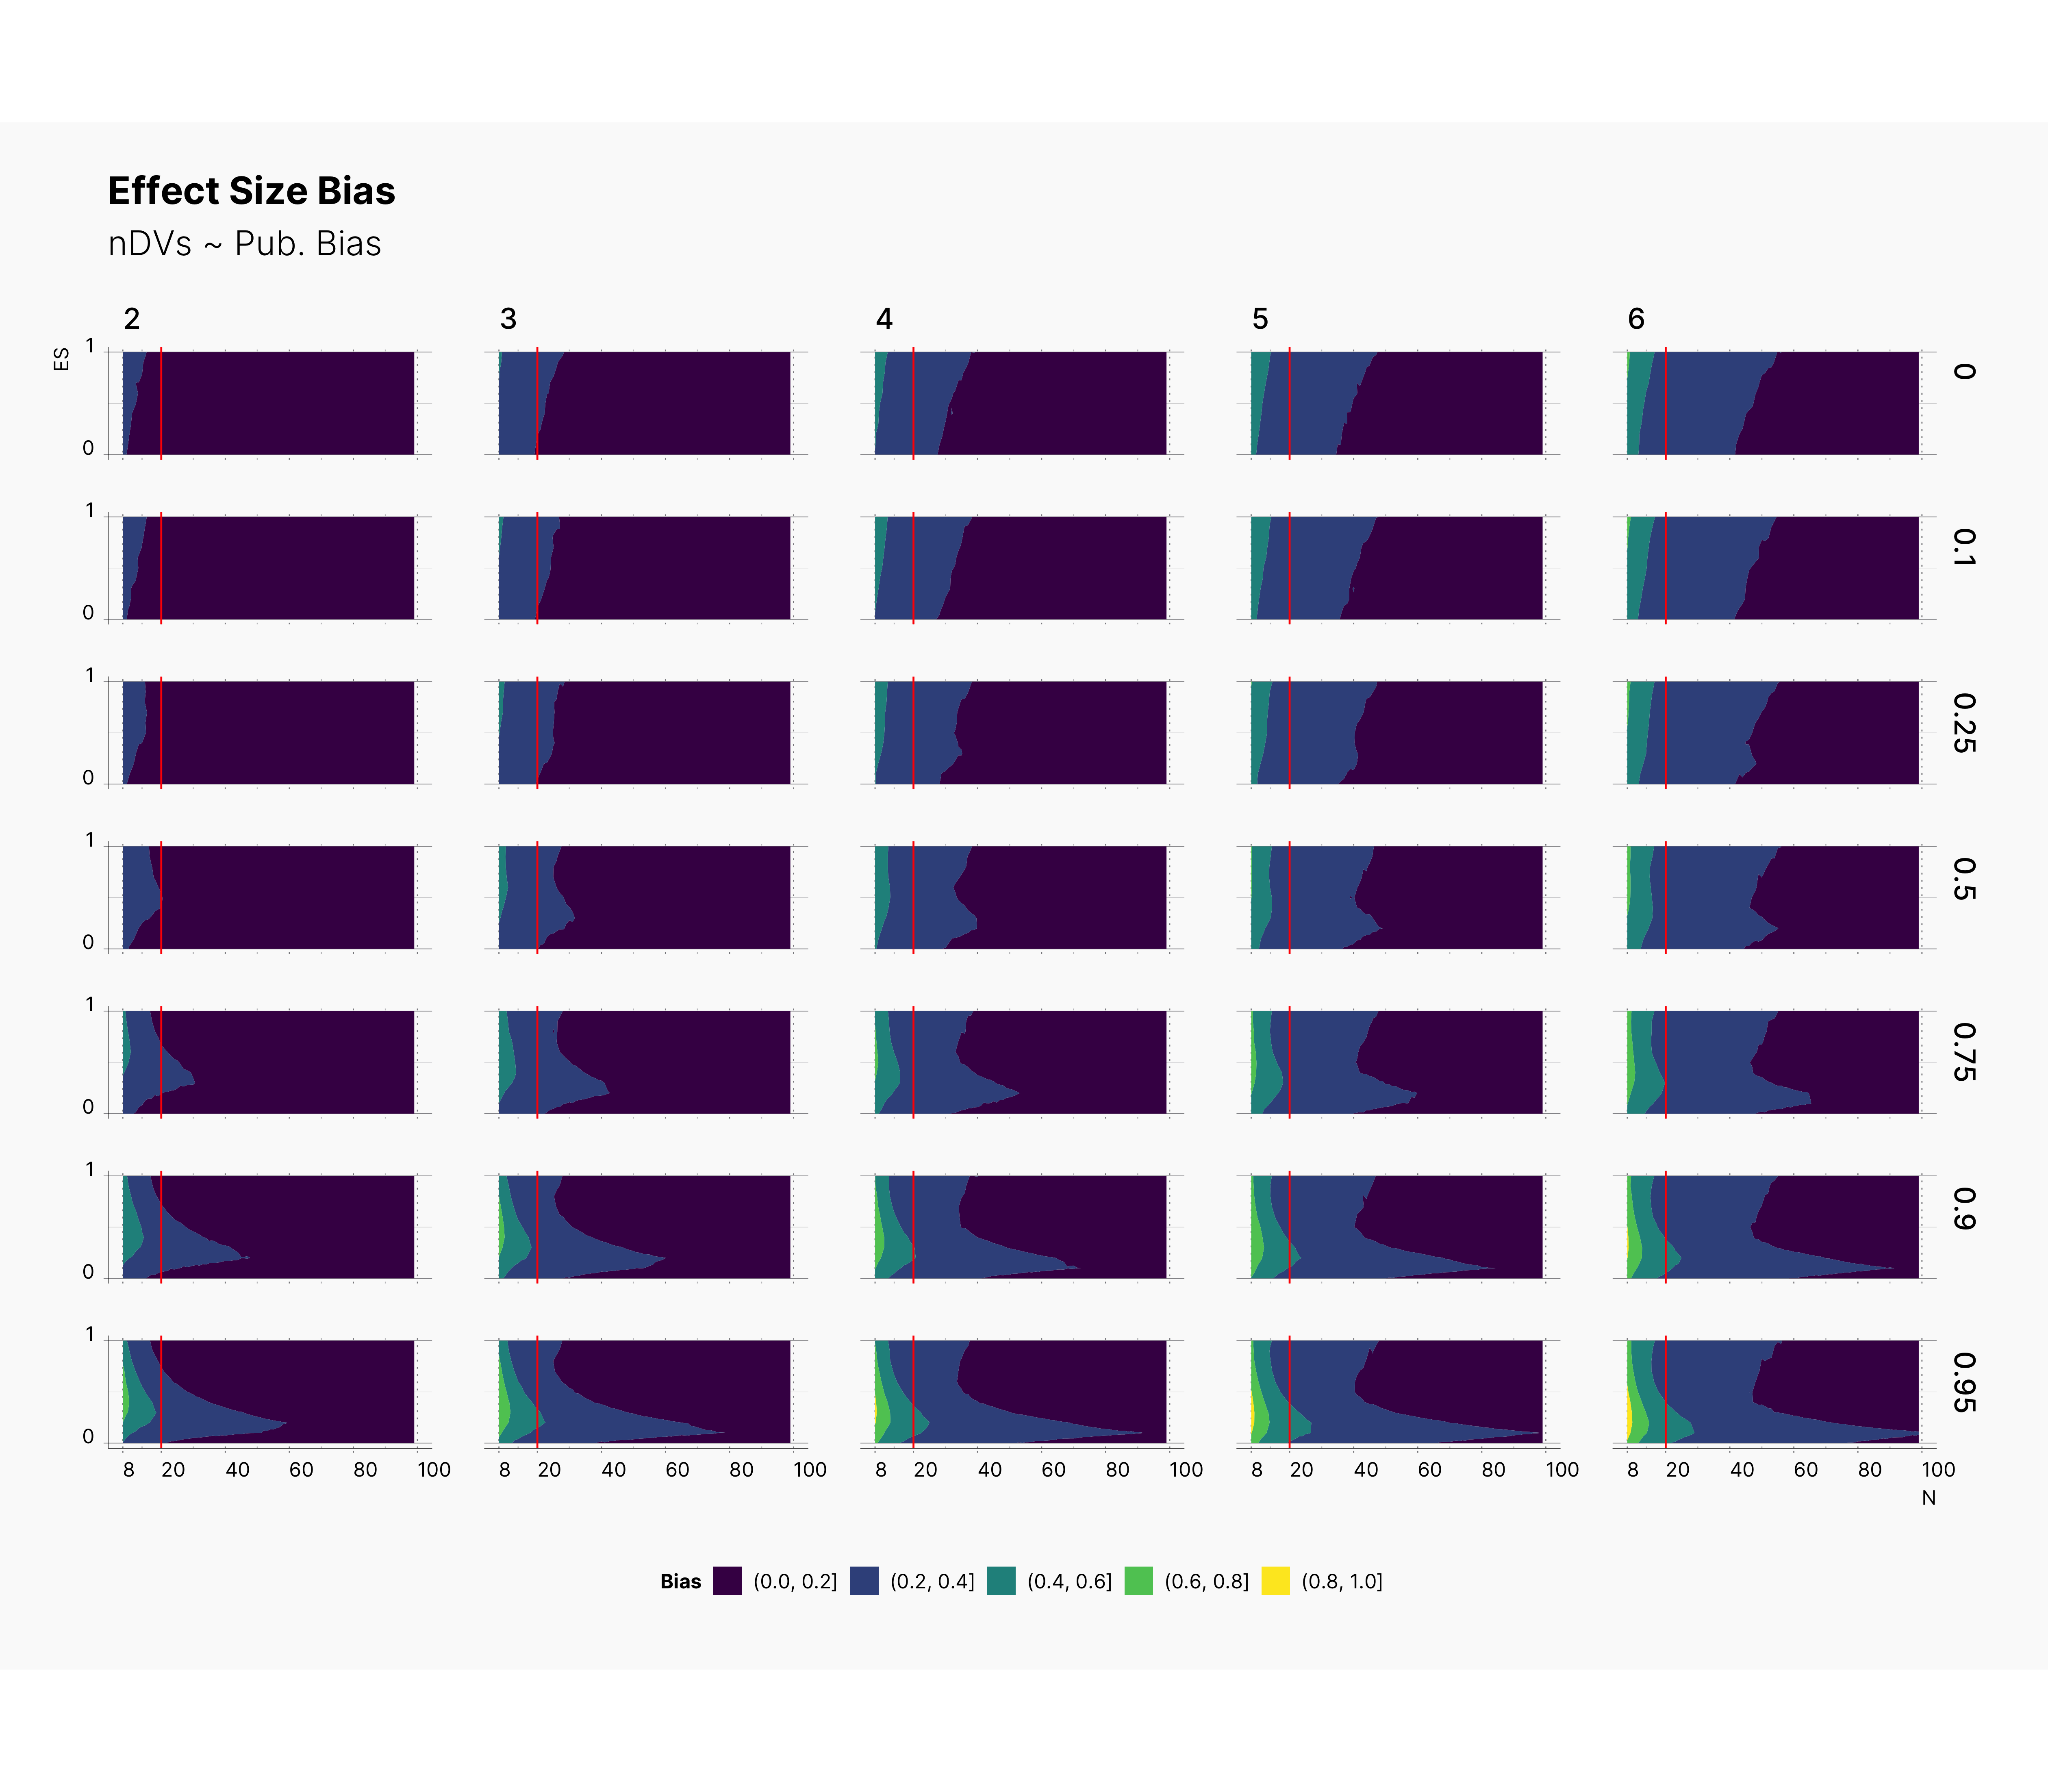
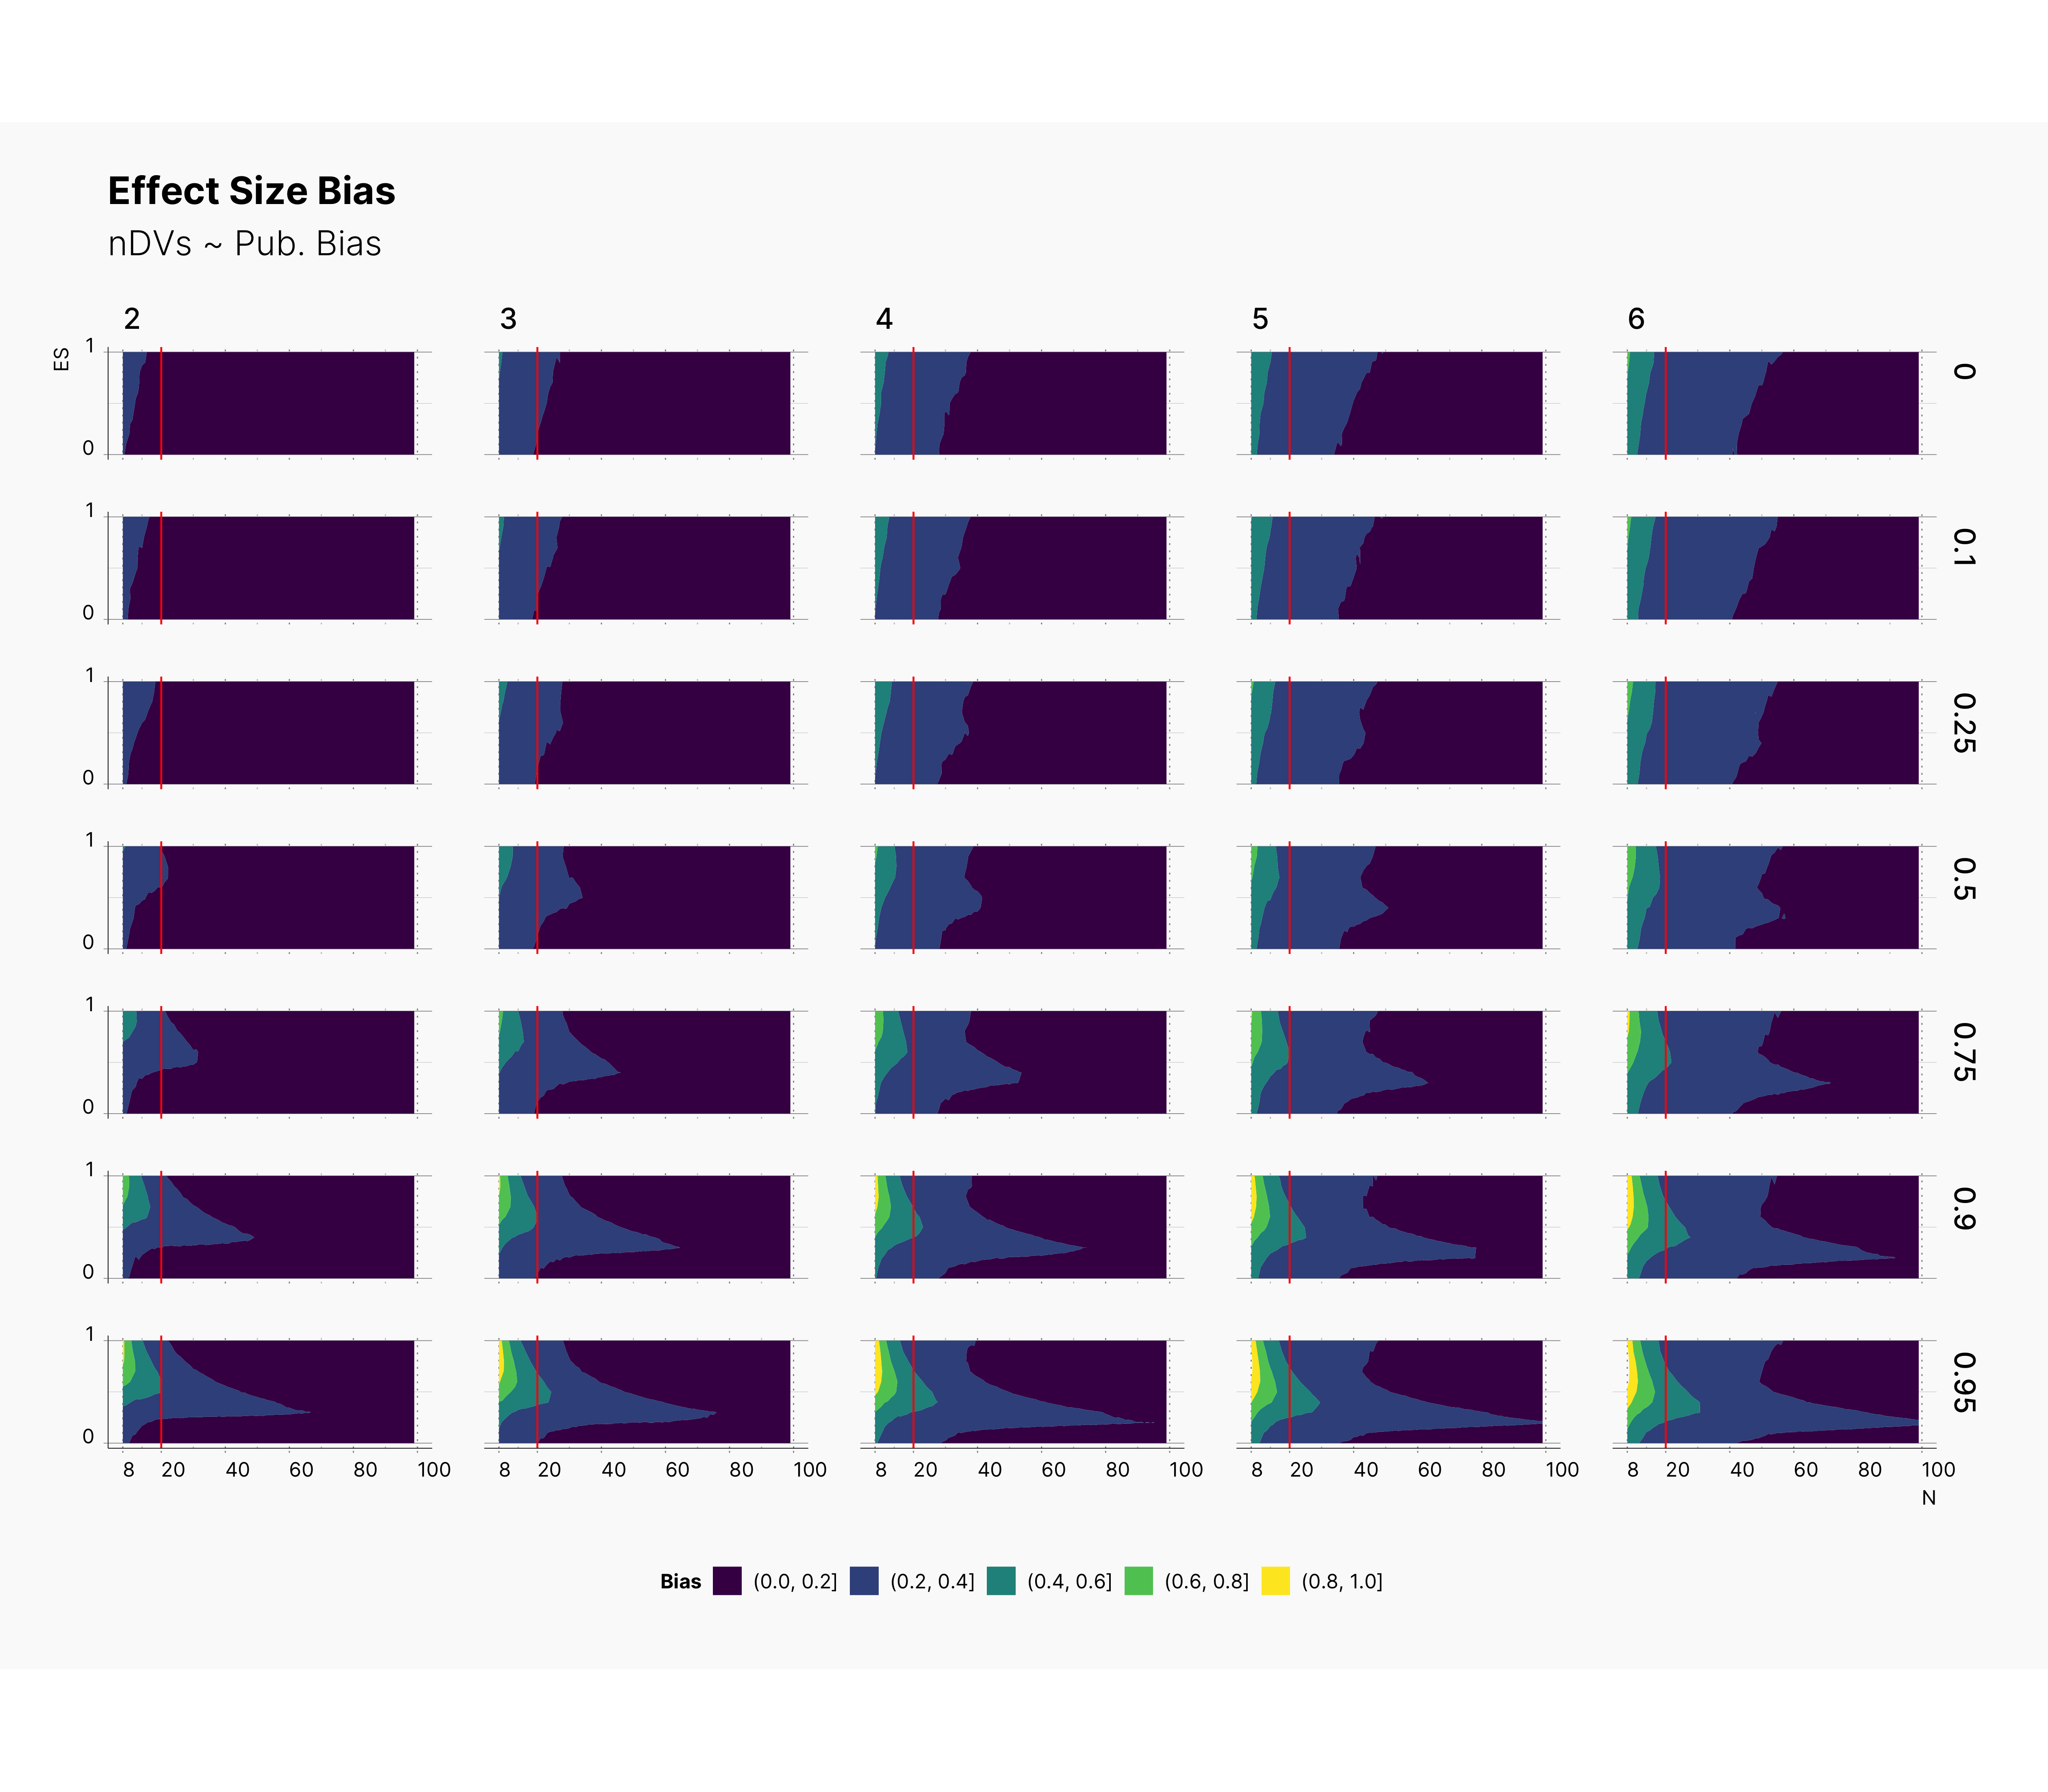
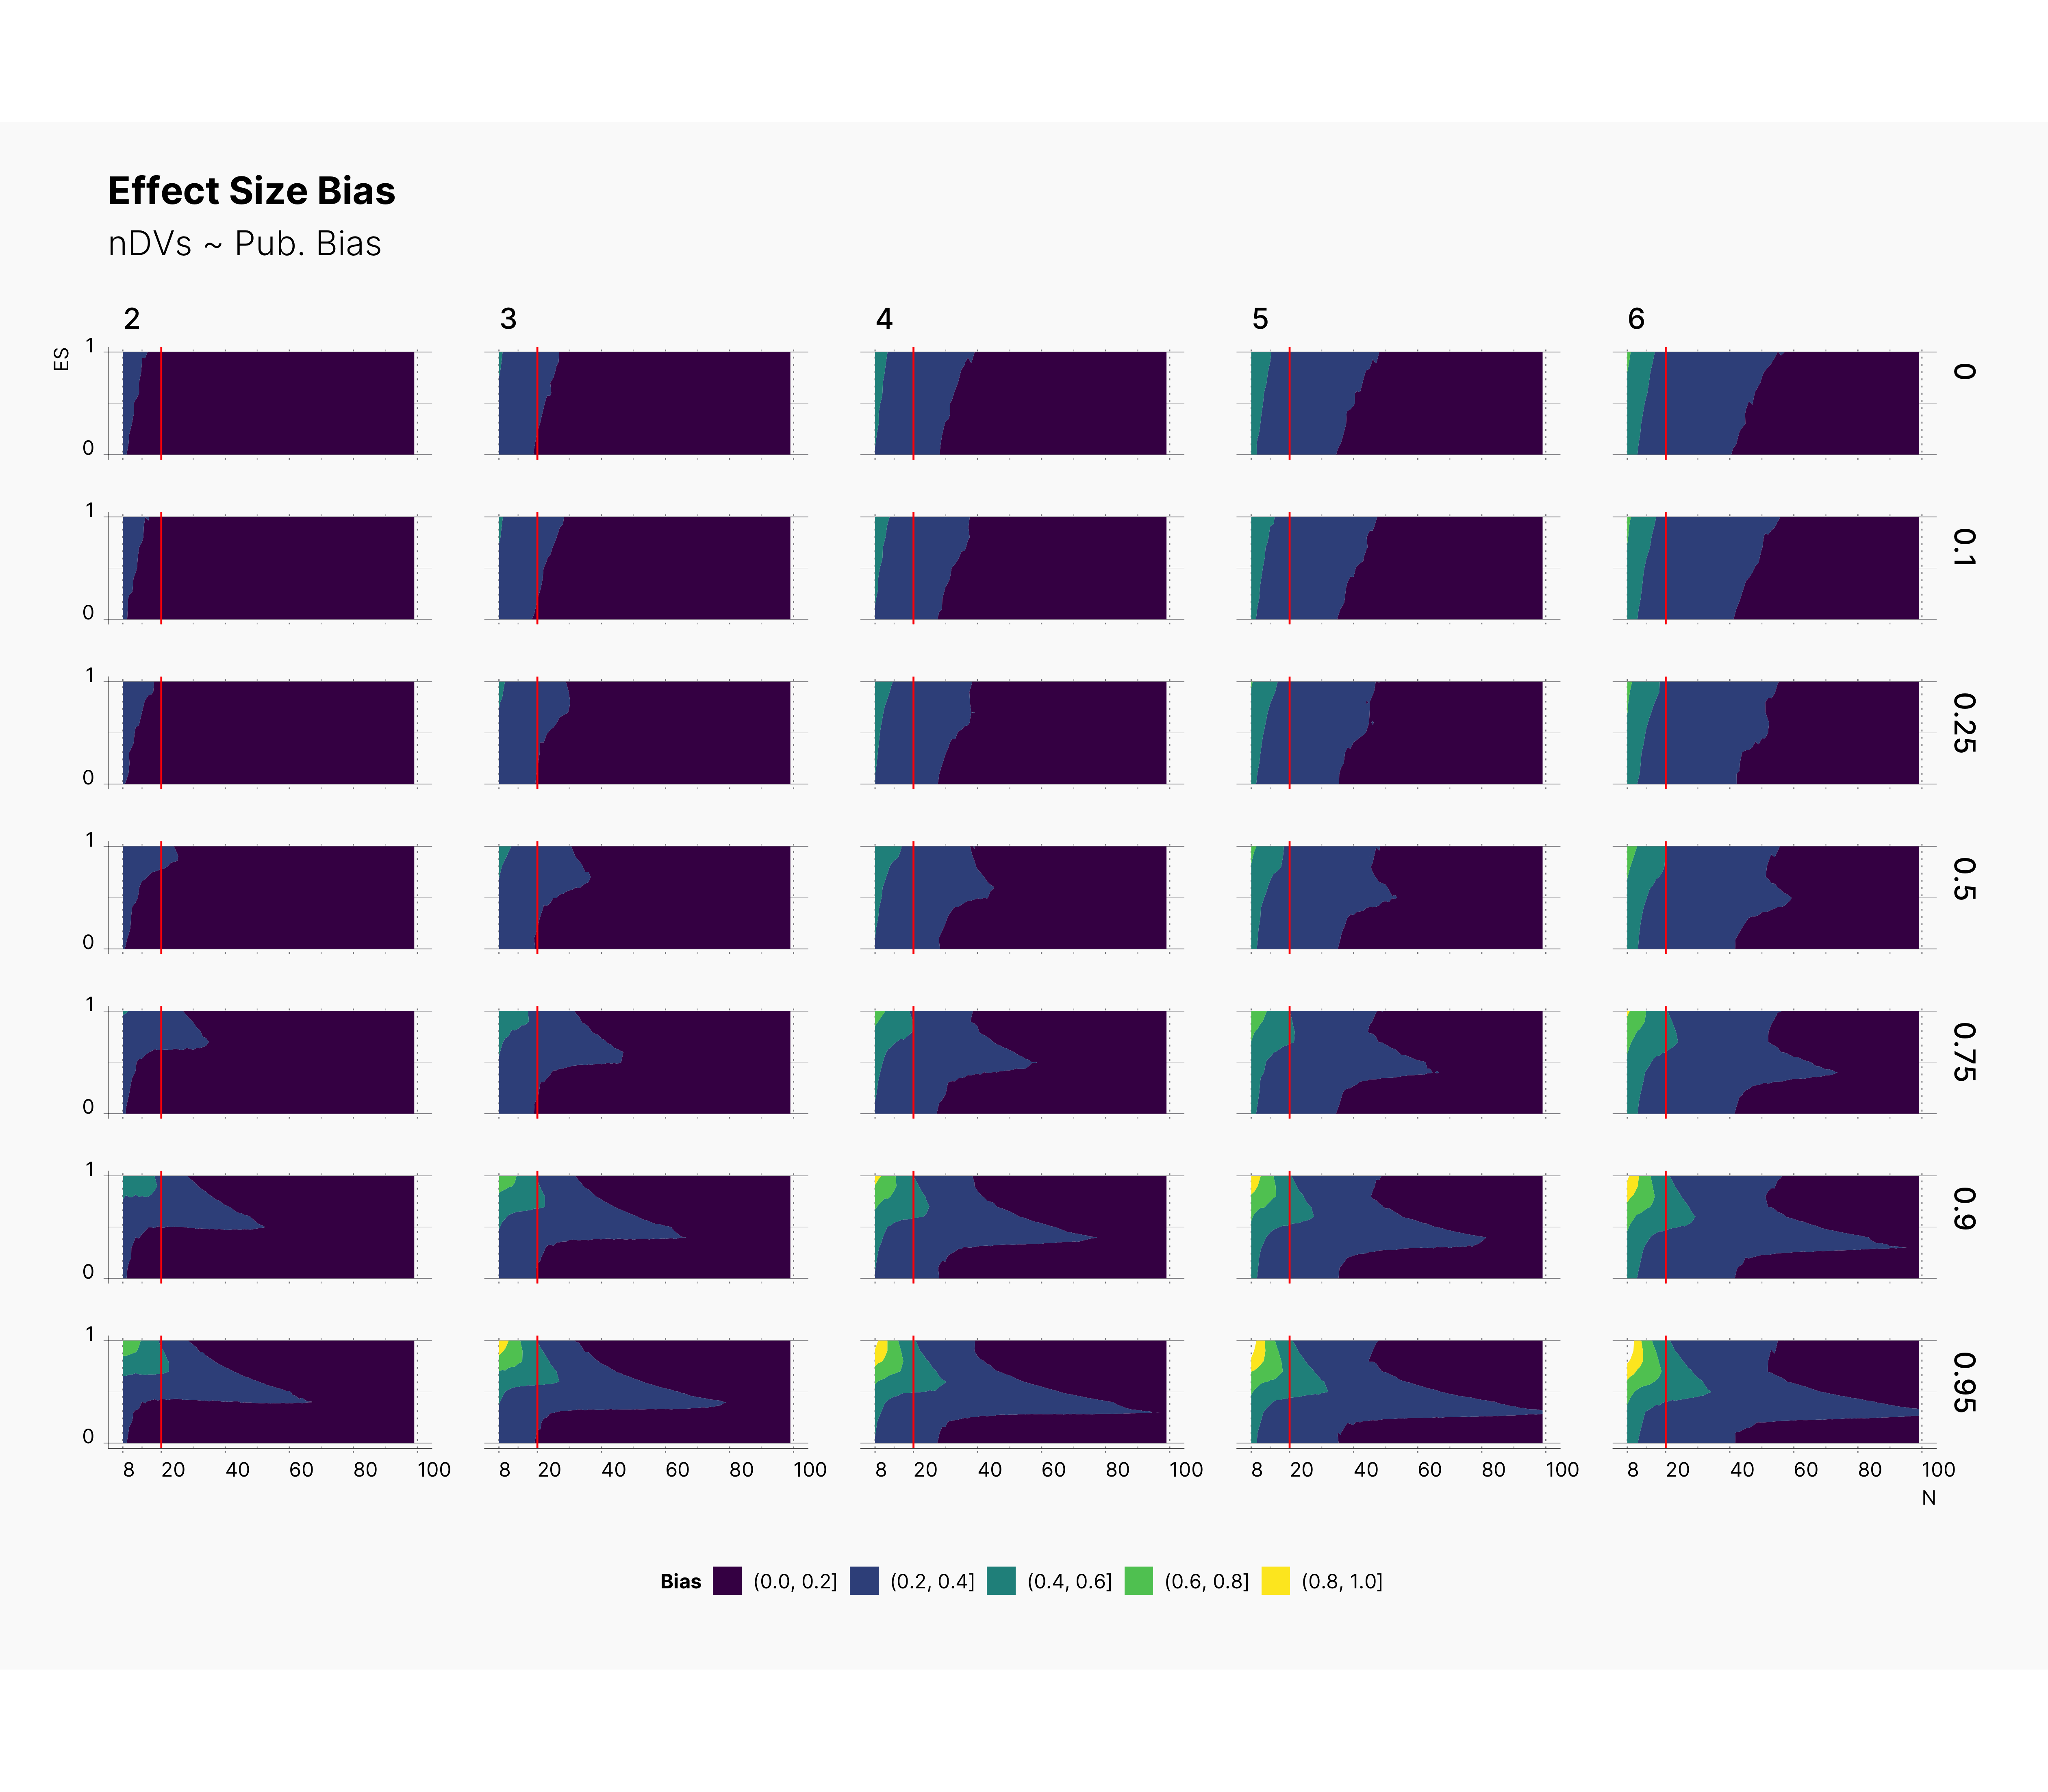
Looking at the level of effect size bias, we oberve an interesting phenomena where increasing the number of depedent variables, m, streches the bias region toward right, meaning as we increase m, we will most definitely incrase our overall bias. Noticably, increasing the publication bias, will shift our bias toward studies with lower true effect size, θ, and larger sample size. Combined with our observations from PFS, we can speculate that journals with high publication bias are either accumulating studies with low sample size and large biases (d > 0.6), or studies with large sample size and medium biases, 0.0 < d < 0.6.
Focusing our attention to a region of N ≲ 20, we can see that the level of bias could be as high as 80% and reaching 100% as we increase the publication bias.
Surprisingly, we see that lowering ɑ will shift the bias toward higher true effect sizes, θ. As we discussed during the analysis of PFS, this phenomena entails that as we lower the ɑ, we reduce researcher's chance of finding significant results while we force those significants results to have a higher bias. Moreover, we can see the devestating effect of lower ɑ-level combined with high publications bias. In fact, to add to our conclusion, we see that journals with lower ɑ-level, will tend to accumulate publications with high biases toward upper bound of true effect size. In fact, their effect sizes look more dramatic while being grimly incorrect.
