Data Strategies
Data Strategy is the source of data, i.e., population. It knows the underlying design, and its properties. During the research preperation stage, the Researcher reaches our to the Data Strategy object and uses it to populates — ie., generates/collects data for — its Experiment.
Study Design
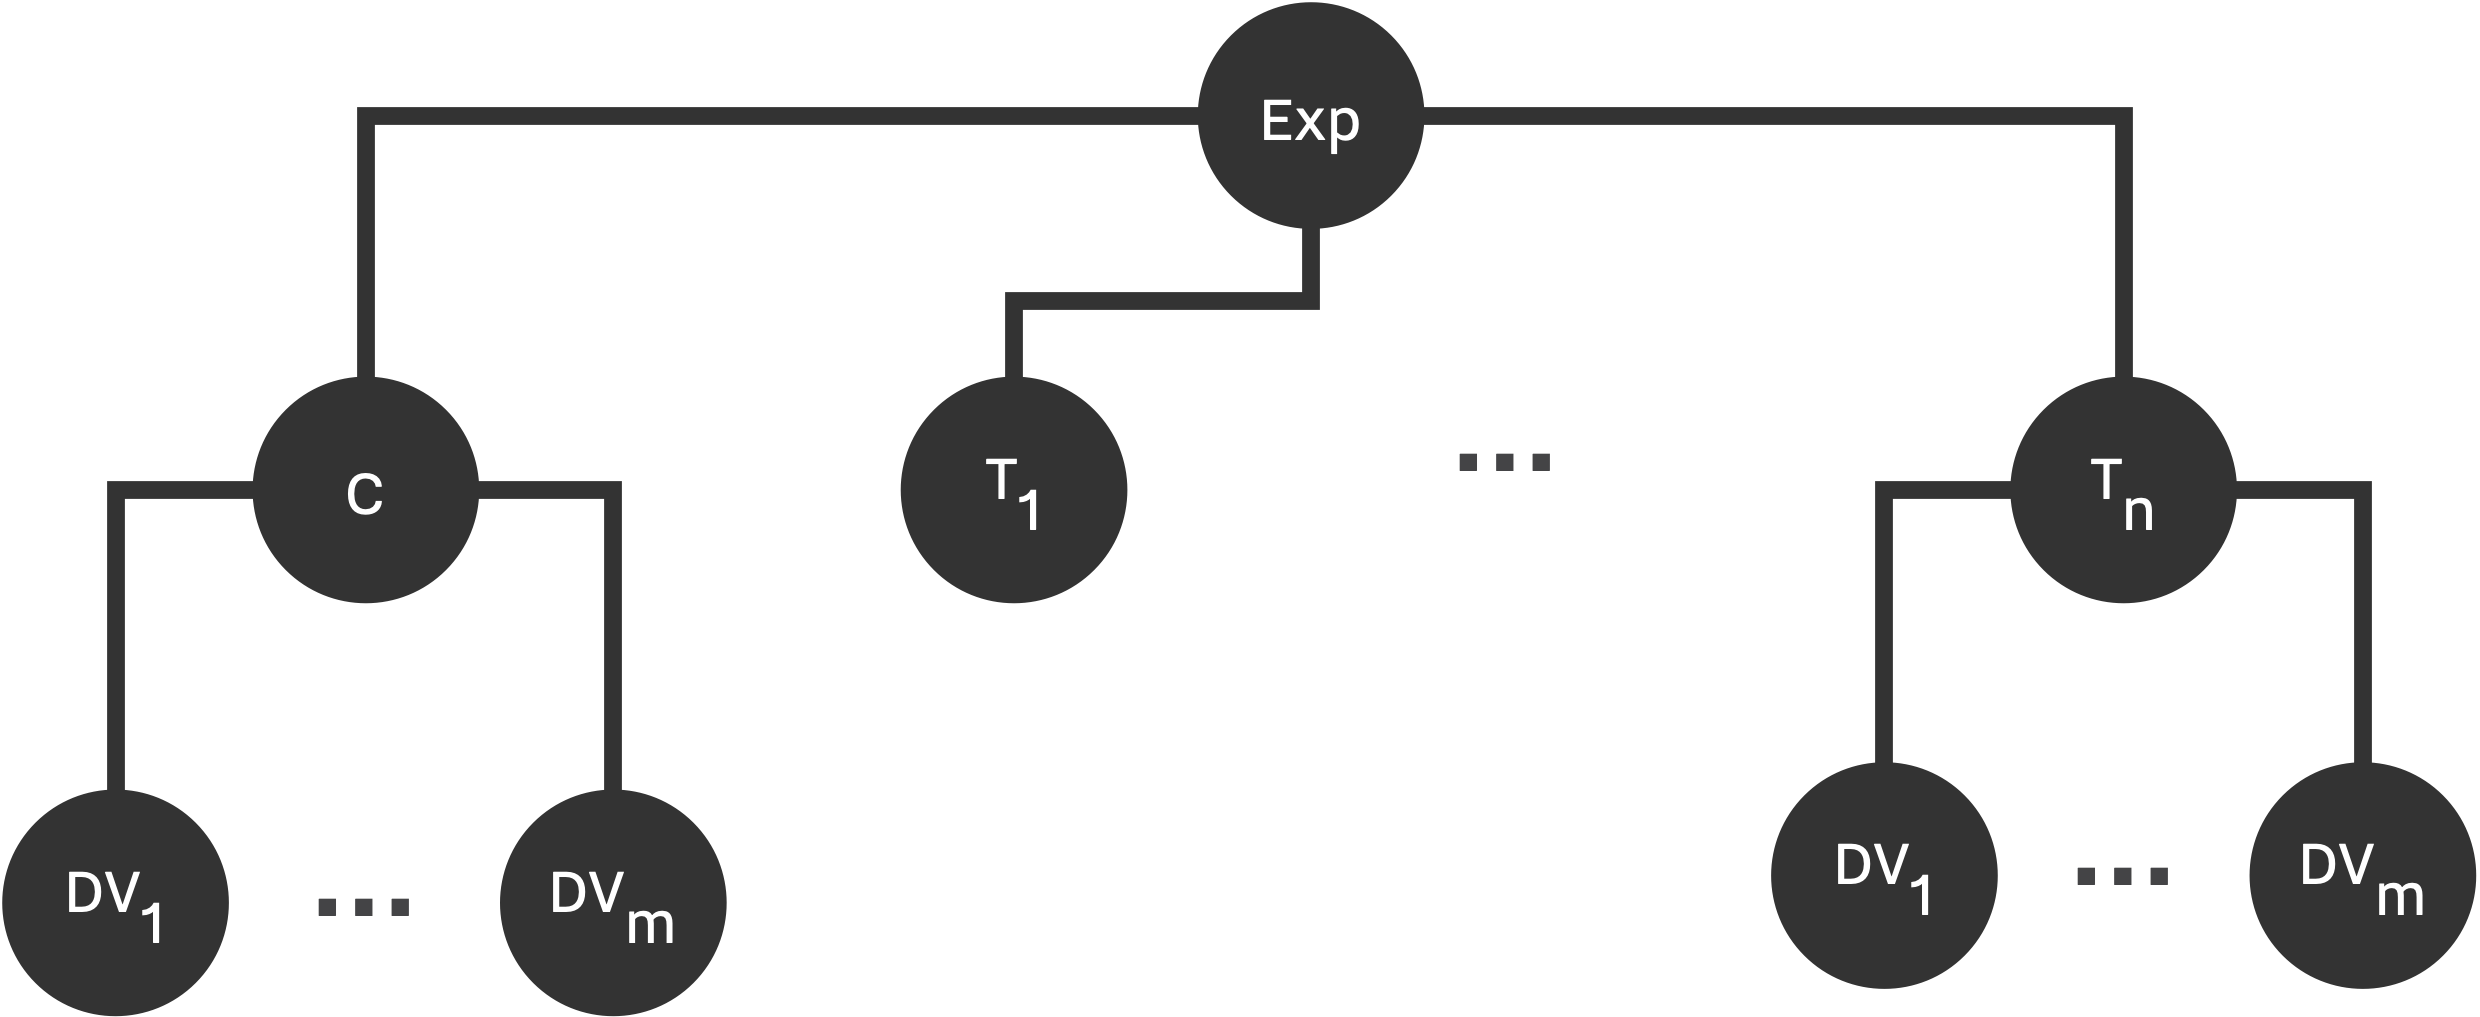
Parameters of Data Strategy are intertwined with experiment design parameters. Before defining the model, we need to specify the structure of our design, number of observations in each group, and number of replications (if applicable). Study design is specified by assigning the number of conditions, n (n_conditions), and the number of dependent variables in each condition, m (n_dep_vars). After specifying our design, each group is going to be populated by n_obs observations based on the given model, specified in data_strategy.
{
    "experiment_parameters": {
        "n_reps": 5,
        "n_conditions": 2,
        "n_dep_vars": 1,
        "n_obs": 25,
        "data_strategy": {
            "name": "",
            ...
        }
    }
}
We can configure types and specifications of the model using data_strategy parameters. In the rest of this section, we discuss the specification of Linear Model and Graded Response Model data strategies as the two currently avilable methods.
Linear Model
In the case of Linear Model, SAM models \bar{y} = \bar{x} + \bar{\epsilon} where \bar{x} and \bar{\epsilon} are vectors of values drawn either from a single multivariate distribution, or a set of univariate distributions. Two following configurations showcase variants of this setup. As it is shown, it is possible to mix and match uni- and multi-variate distributions in order to acheive a certain population characteristics.
SAM supports a wide range of statistical distributions. While most distirbutions accept a set of predefined parameters, multivariate normal distribution offers some helper parameters for easier configuration, Table 1. For instance, we are able to set a fixed value for covariance and standard deviation and guide SAM to generate an appropriate covariance matrix., e.g., setting stddevs to 1, and covs to 0 leads to the generation of Identity matrix of m × n.
- TODO: Improve the table
| Parameters | Value / Type |
|---|---|
means |
μ, double or array |
stddevs |
σ2, double or array |
covs |
σx y, double |
sigma |
Σ, matrix |
Linear Model Configuration: Multivariate Normal
{
"n_conditions": 2,
"n_dep_vars": 1,
"n_obs": 25,
"data_strategy": {
    "name": "LinearModel",
    "measurements": {
        "dist": "mvnorm_distribution",
        "means": [0, 0.2],
        "covs": 0.0,
        "stddevs": 1.0
    },
    "errors": {
        "dist": "mvnorm_distribution",
        "means": [0, 0],
        "covs": 0.0,
        "stddevs": 1.0
    }
}
Linear Model Configuration: Custom Distributions
{
"data_strategy": {
    "n_conditions": 2,
    "n_dep_vars": 1,
    "n_obs": 25,
    "name": "LinearModel",
    "measurements": {
        "dist": "mvnorm_distribution",
        "means": [0, 0.2],
        "covs": 0.0,
        "stddevs": 1.0
    },
    "errors": [
        {
            "dist": "cauchy_distribution",
            "a": 0,
            "b": 0.1
        },
        {
            "dist": "cauchy_distribution",
            "a": 0,
            "b": 0.1
        }
    ]
}
Warning
It's important to keep in mind that the given distribution should be able to account for the pre-defined study design; otherwise, SAM cannot initialize the Experiment and an error will occur.
General Graded Response Model1
The current implementation of the Graded Response Model is based on the model introduced by Samejima1 where we use Rasch model as the default response function. According to Rasch model, the probablity of person j answering an item i correctly, Pr(X_{ij} = 1), can be calculated based on the difficulty, \beta_{i}, of the item i and the ability, \theta_{j}, of a person j with the following model2:
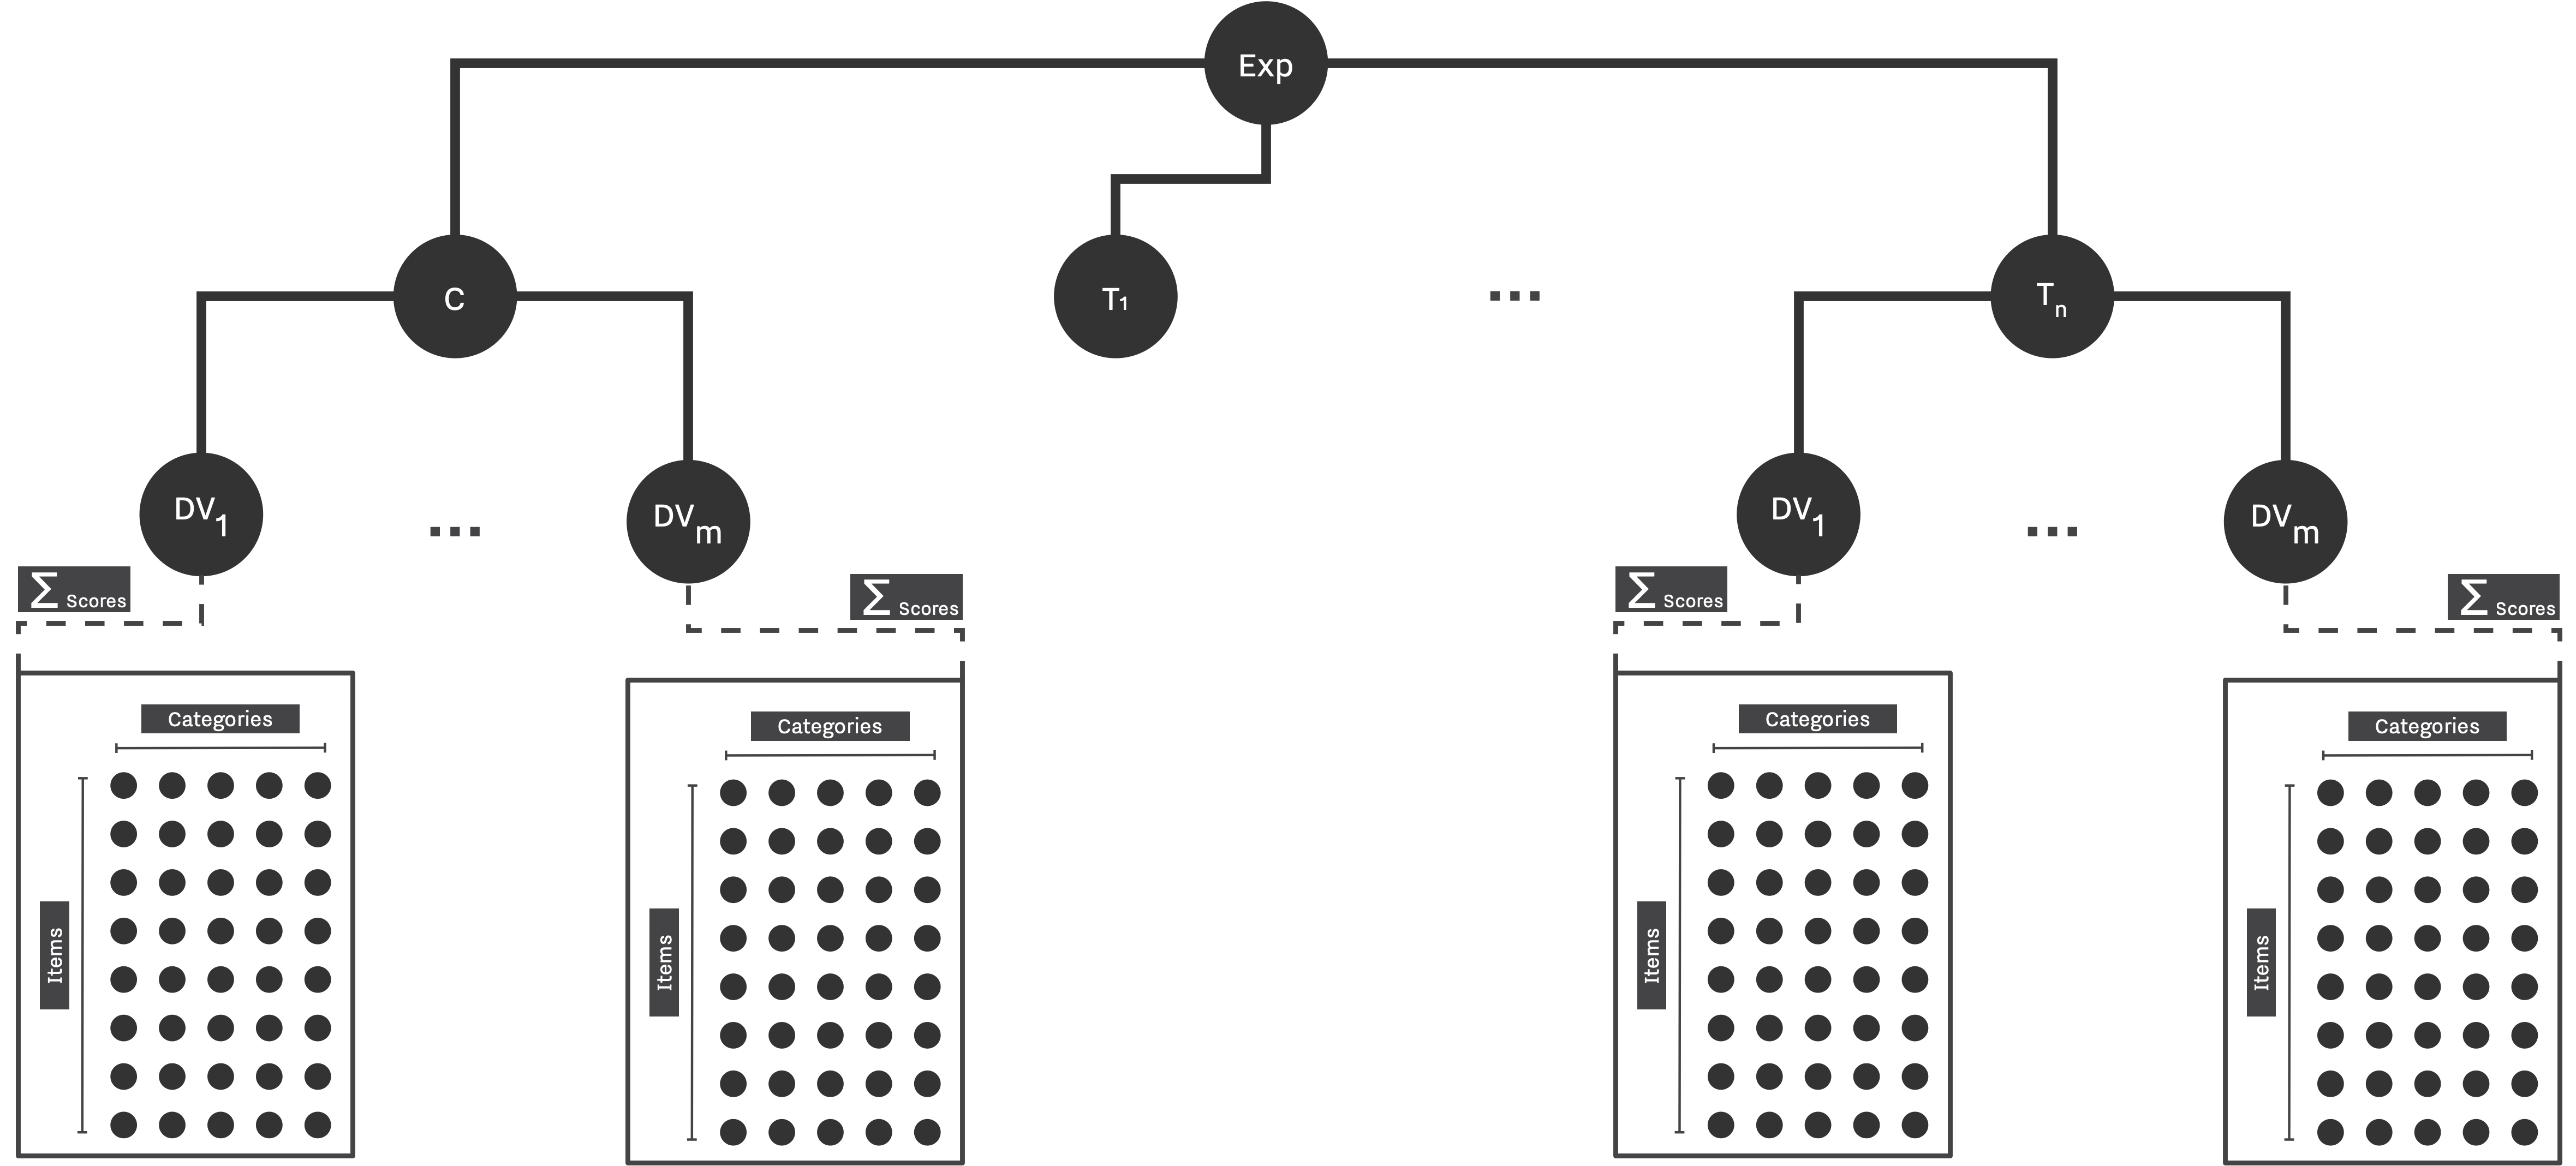
Besides general design parameters, we need to provide number of categories, as well as number of items per category to be able to completely setup a GRM. Thereafter, like before, we also need to define the underlying distributions of abilities and difficulties. Figure 2 shows the schematic of GRM as it is being implemented in SAM.
- TODO: Improve the table
| Parameters | Value / Type |
|---|---|
n_items |
int |
abilities |
θ, a multivariate distribution, or a list of univariate distributions |
n_categories |
int |
difficulties |
β, a multivariate distribution, or a list of univariate distributions Note: SAM models the GRM using the threshold model, therefore for c categories, we need to provide k - 1 distributions, or dimension in the case utilizing multivariate distribution. |
An example of GRM configuration can be found below, with it, we model a study with 2 groups, 10 items, and 3 categories for each item, while examinee's abilities is drawn from a multivariate normal distribution of θ ~ MN(O, I). For more elaborate usecase of this model, see Bakker et al., 2014.
Graded Response Model Configuration
{
    "name": "GradedResponseModel",
    "n_conditions": 2,
    "n_dep_vars": 1,
    "n_obs": 25,
    "data_strategy": {
        "n_items": 10,
        "abilities": {
            "dist": "mvnorm_distribution",
            "means": [0, 0],
            "stddevs": 1.0,
            "covs": 0.0
        },
        "n_categories": 3,
        "difficulties": [
            {
                "dist": "normal_distribution",
                "mean": 0,
                "stddev": 1.0
            },
            {
                "dist": "normal_distribution",
                "mean": 0,
                "stddev": 1.0
            }
        ],
    }
}
Info
Since SAM is mainly a C++ library, it supports all available statistical distributions available in STL. For multivariate distributions, SAM uses available distributions in baaraan library.
-
Fumiko Samejima. Graded Response Model, pages 85–100. Springer New York, New York, NY, 1997. URL: https://doi.org/10.1007/978-1-4757-2691-6_5, doi:10.1007/978-1-4757-2691-6_5. ↩↩
-
Susan E Embretson and Steven Paul Reise. Item response theory for psychologists. Maheah. New Jersey: Lawrence Erlbaum Associates, Publishers, 2000. ↩