Optional Stopping Variation
After investigating the influecens of initial selection logic, and sample size, here, we will investigate the effect of applying several variants of Optional Stopping on the probability of finding significant results and the level of effect size bias. Similarly to our Sample Size Variation and Selection Variation studies, we will cover a range of parameters in order to draw a landscape of our both target metrics, e.g., Probability of Finding Significant (PFS), and Effect Size Bias, (ESB).
Study Design
Based on results of our sample size study, we will adjust our sample size parameters, from simulating the entire range of [8, 100] to a discrete set of values. We think our approximation can still provide an overview of the interaction as we observed a predictable change of PFS and ES Bias along a fine-grind range of N. For the rest of Experiment’s parameters, we use the same set of parameters in order to draw a complete and comparable picture as before.
- μ ∈ [0, 1]
- m ∈ {2, 4, 6}
- N ∈ {10, 20, 30, 40, 50, 60, 70, 80}
- Pb ∈ {0, 0.1, 0.25, 0.5, 0.75, 0.9, 0.95}
In order to cover a range of optional stopping approaches, we start by simulating a more conventional optional stopping and narrow down our search parameters.
Optional Stopping on Both Groups
In our first study, we simulate the optional stopping by adding new observations as much as of S percent of the current sample size to every group. For example, a group with N = 20 will have 22 observations after adding 10% new observations, S = 10%. Additionally, we vary the maxiumum number of trials that the Researcher could perform the optional stopping with the given S. For instance, a Researcher — who is allowed to perform a maximum of 5 optional stopping trials — will continue adding 2 new obervations, for maximum number of 5 times, to each group until it finds a significant result. The variation of described parameters is as follow:
- S ∈ {0.1, 0.2, 0.3, 0.4, 0.5}
- T ∈ {1, 3, 5}
With these paramters, we hope that we could cover a wide range of possible optional stopping variations, and hopefully find valuable insight into the landsacpe of PFS, and ES Bias.
Configuration: Hacking Strategy
{
    ...
    "hacking_strategies": [
        [
            {
                "name": "OptionalStopping",
                "target": "Both",
                "prevalence": 1,
                "defensibility": 1,
                "max_attempts": 1,
                "n_attempts": 3,
                "ratio": 0.4,
                "stopping_condition": [
                    "sig"
                ]
            },
            [
                [
                    "sig",
                    "effect > 0",
                    "random"
                ],
                [
                    "effect > 0",
                    "min(pvalue)"
                ],
                [
                    "effect < 0",
                    "max(pvalue)"
                ]
            ],
            [
                "id < 0"
            ]
        ]
    ],
    ...
}
Results
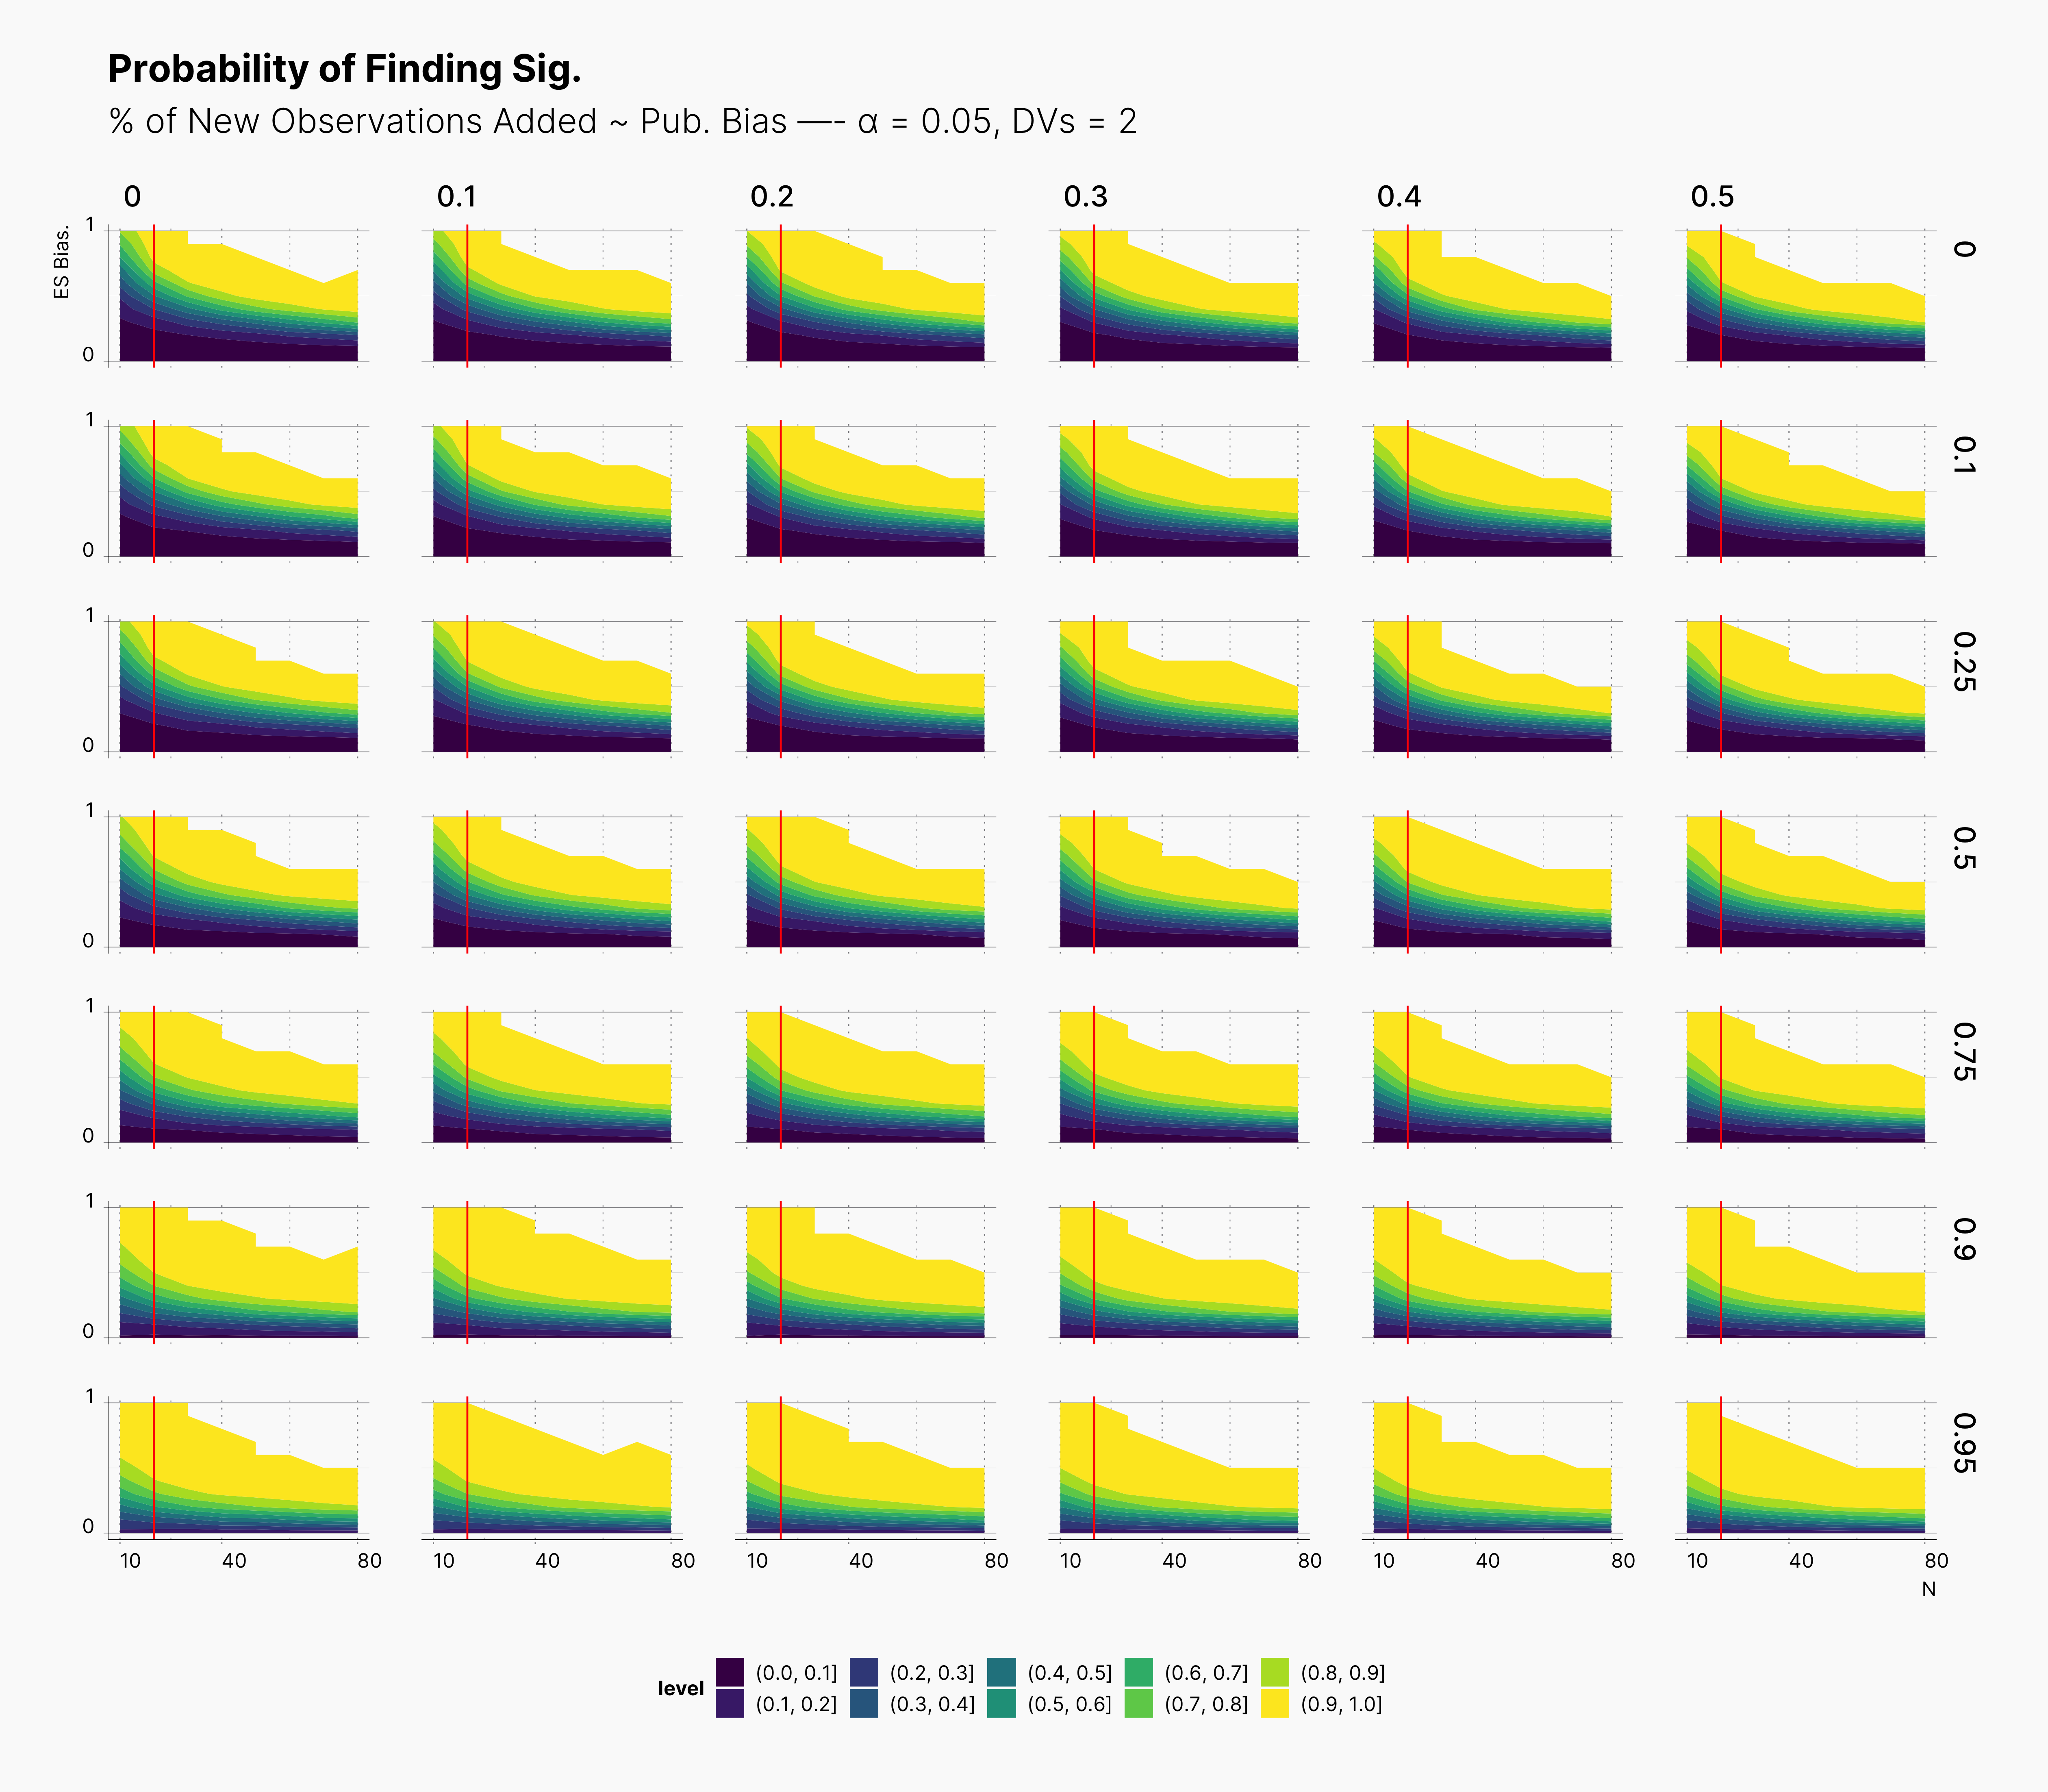
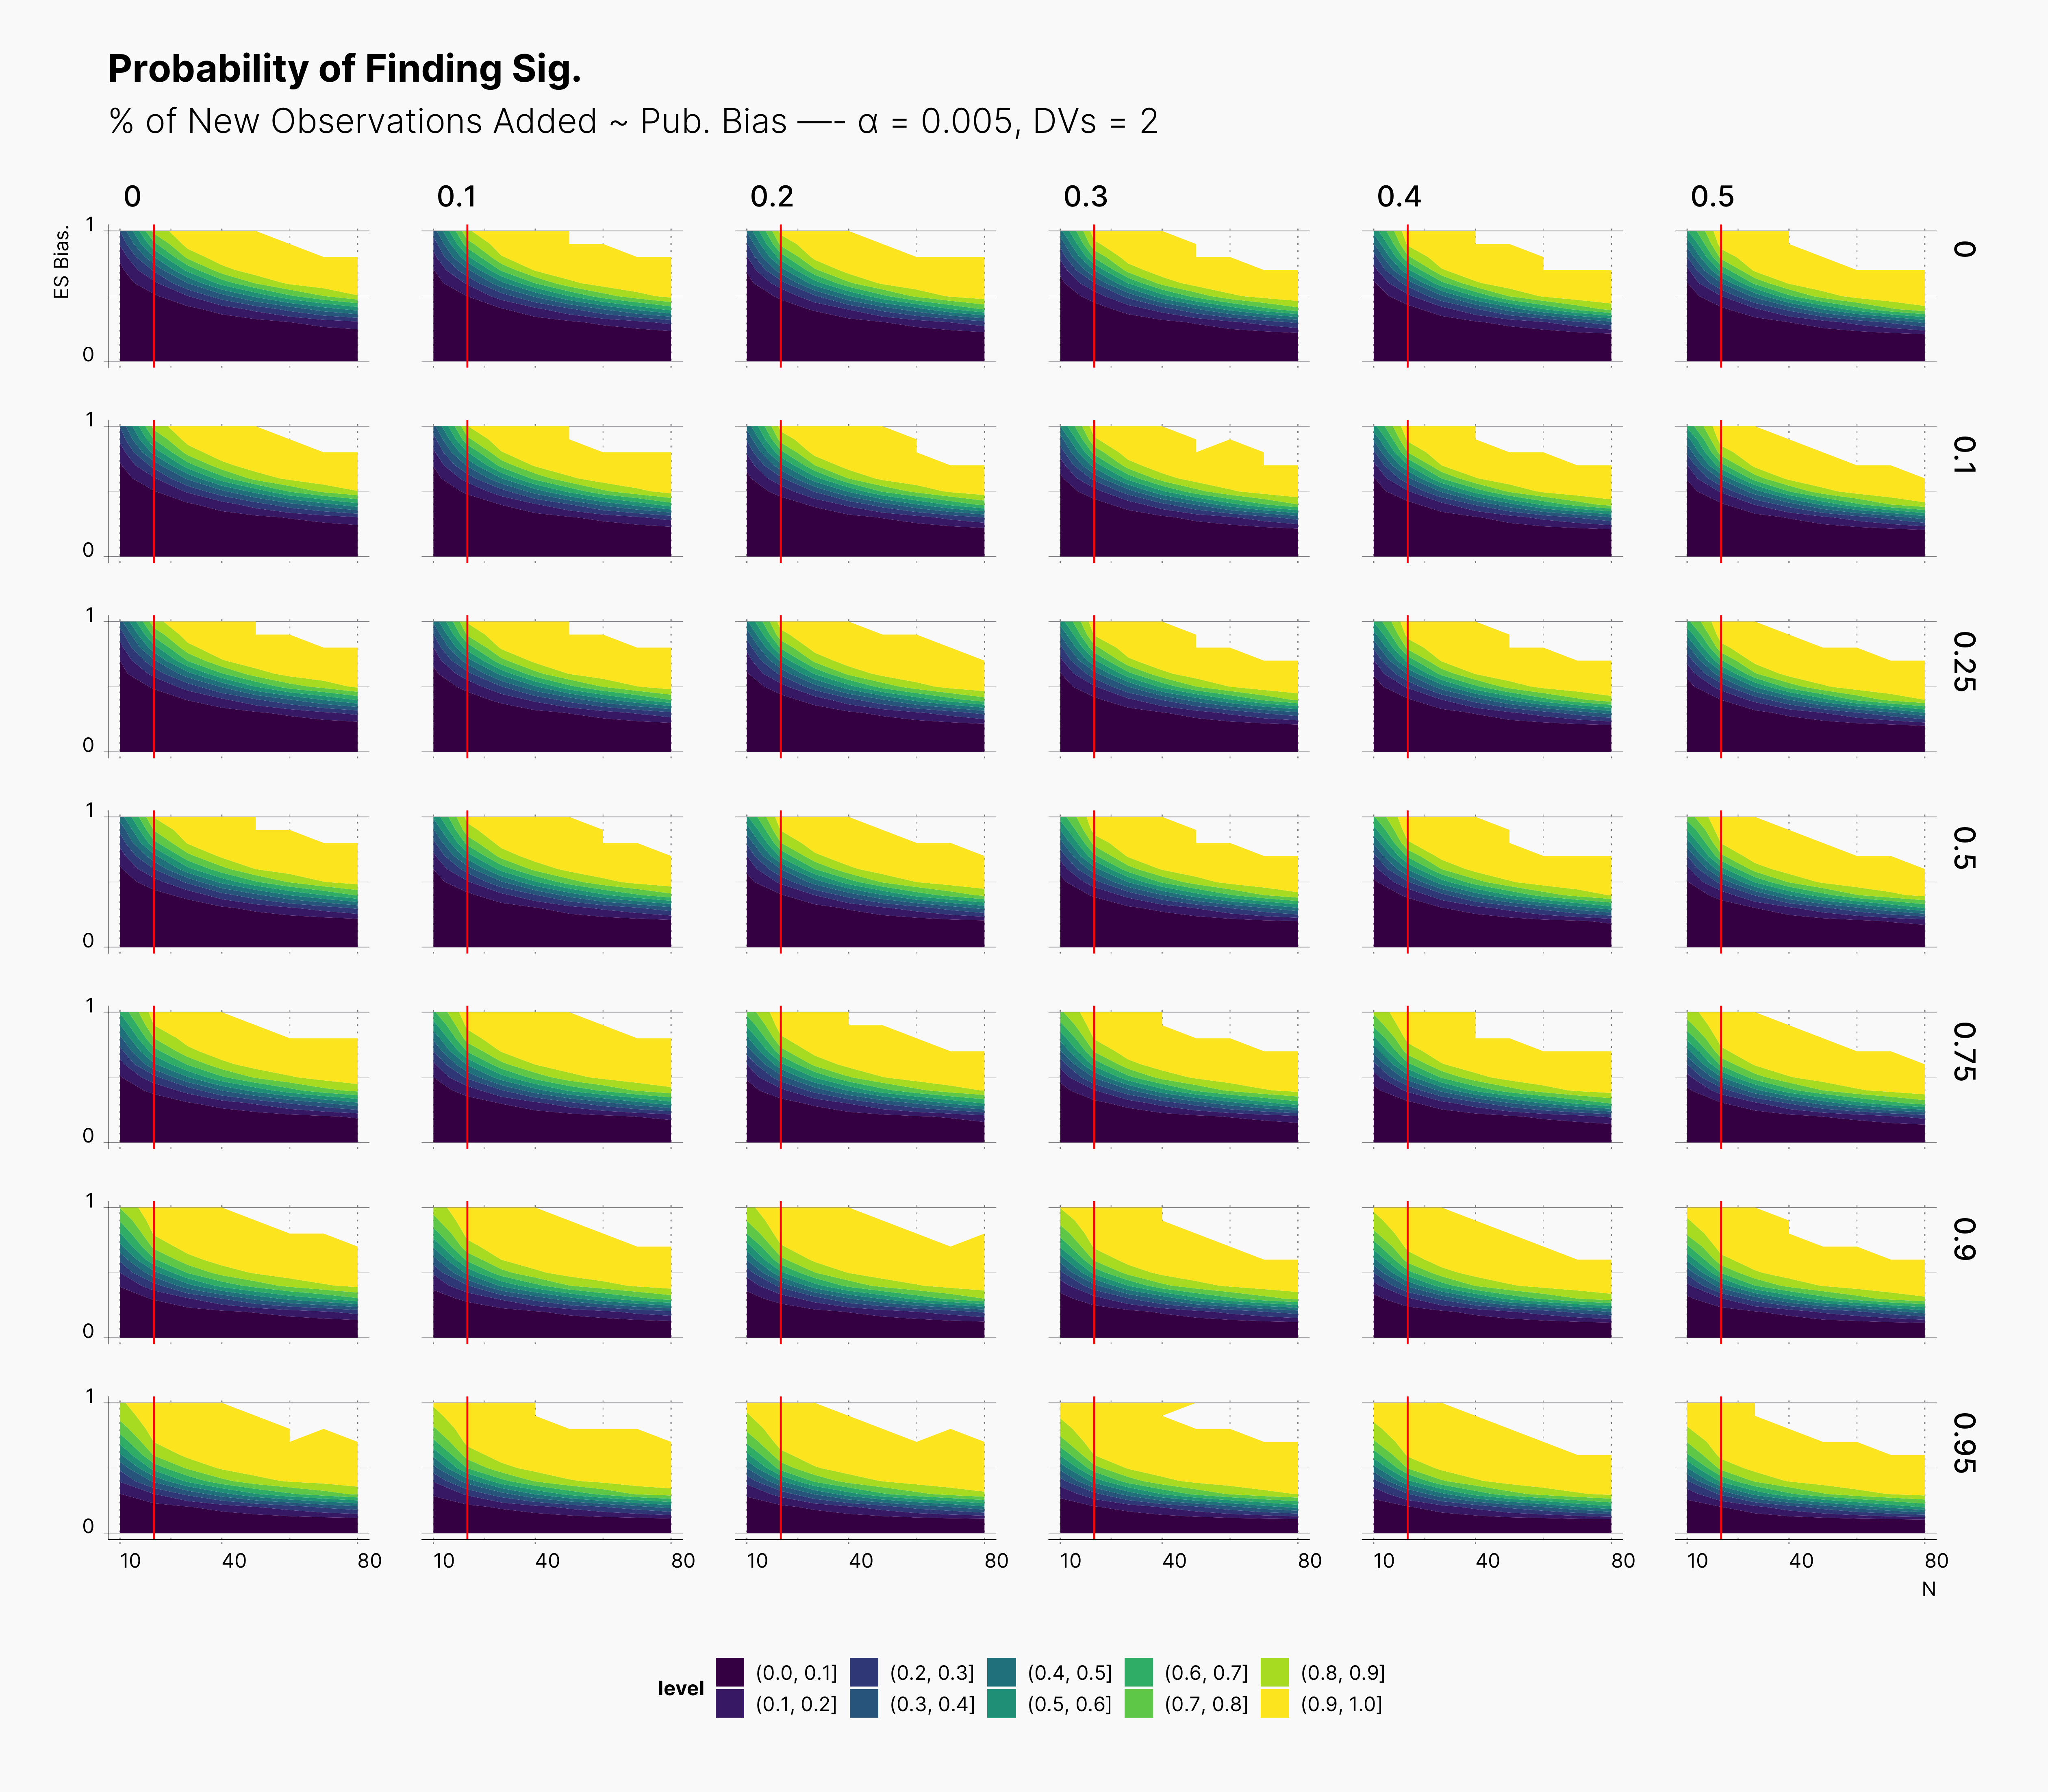
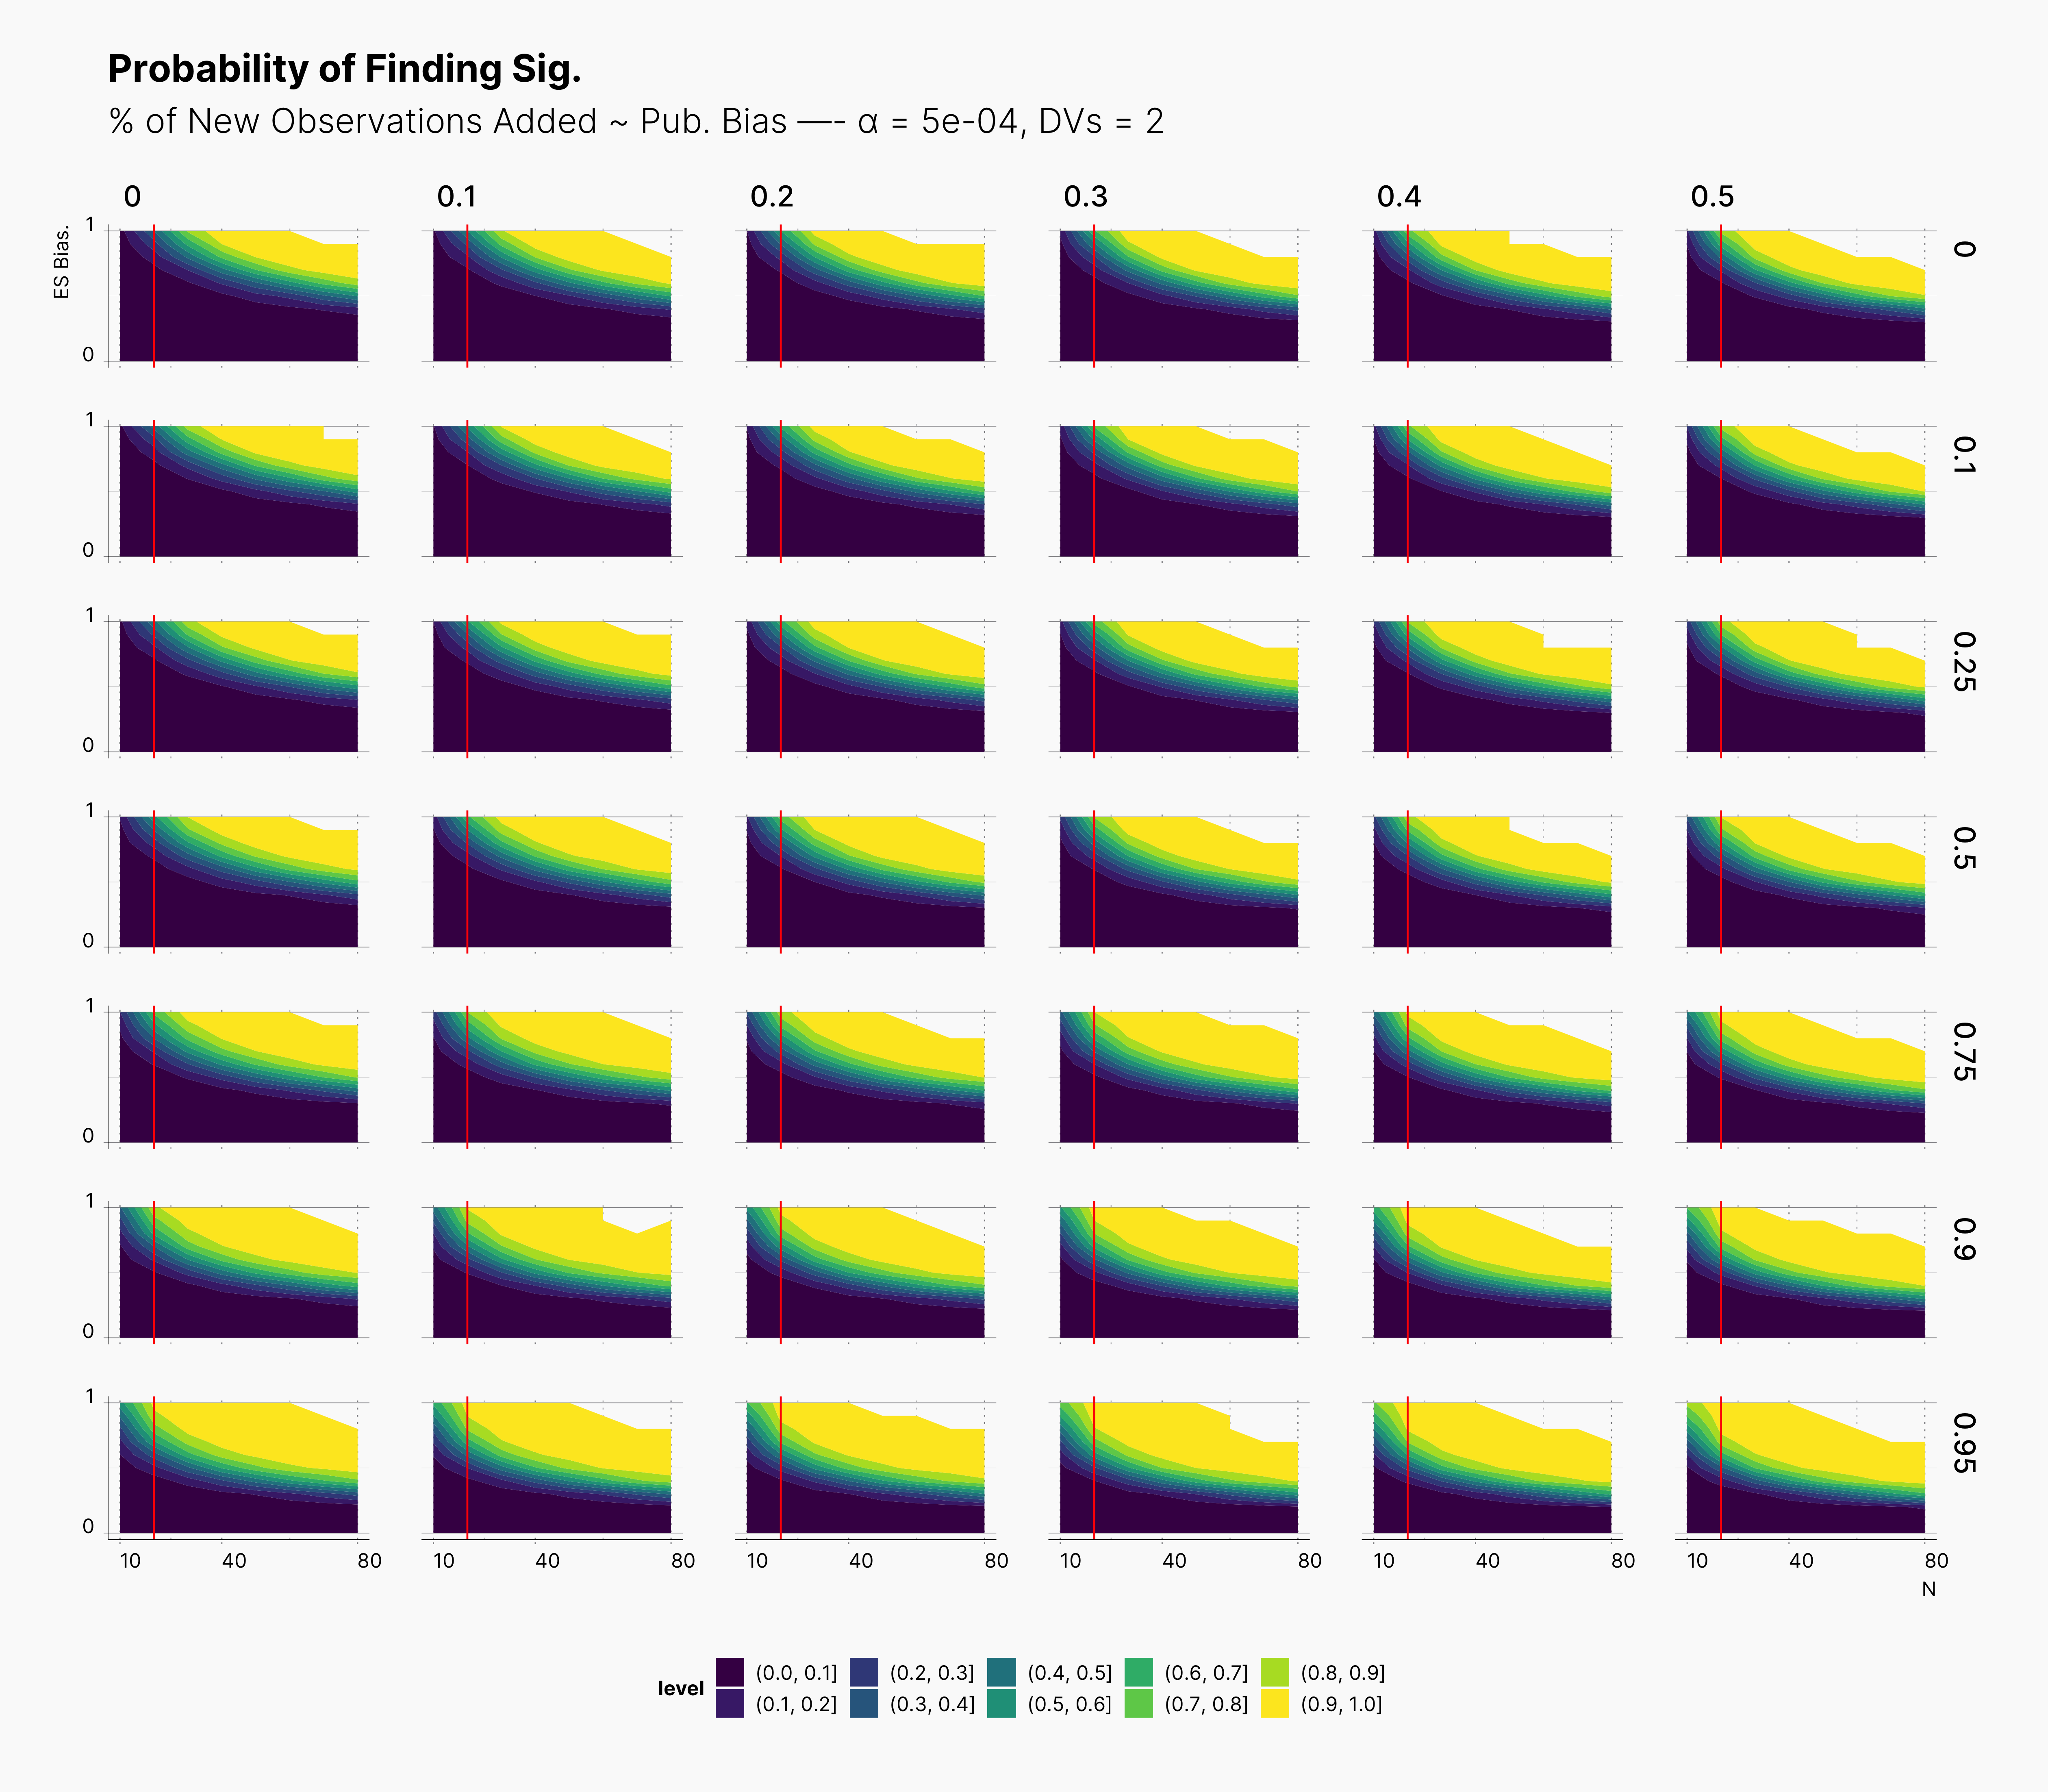
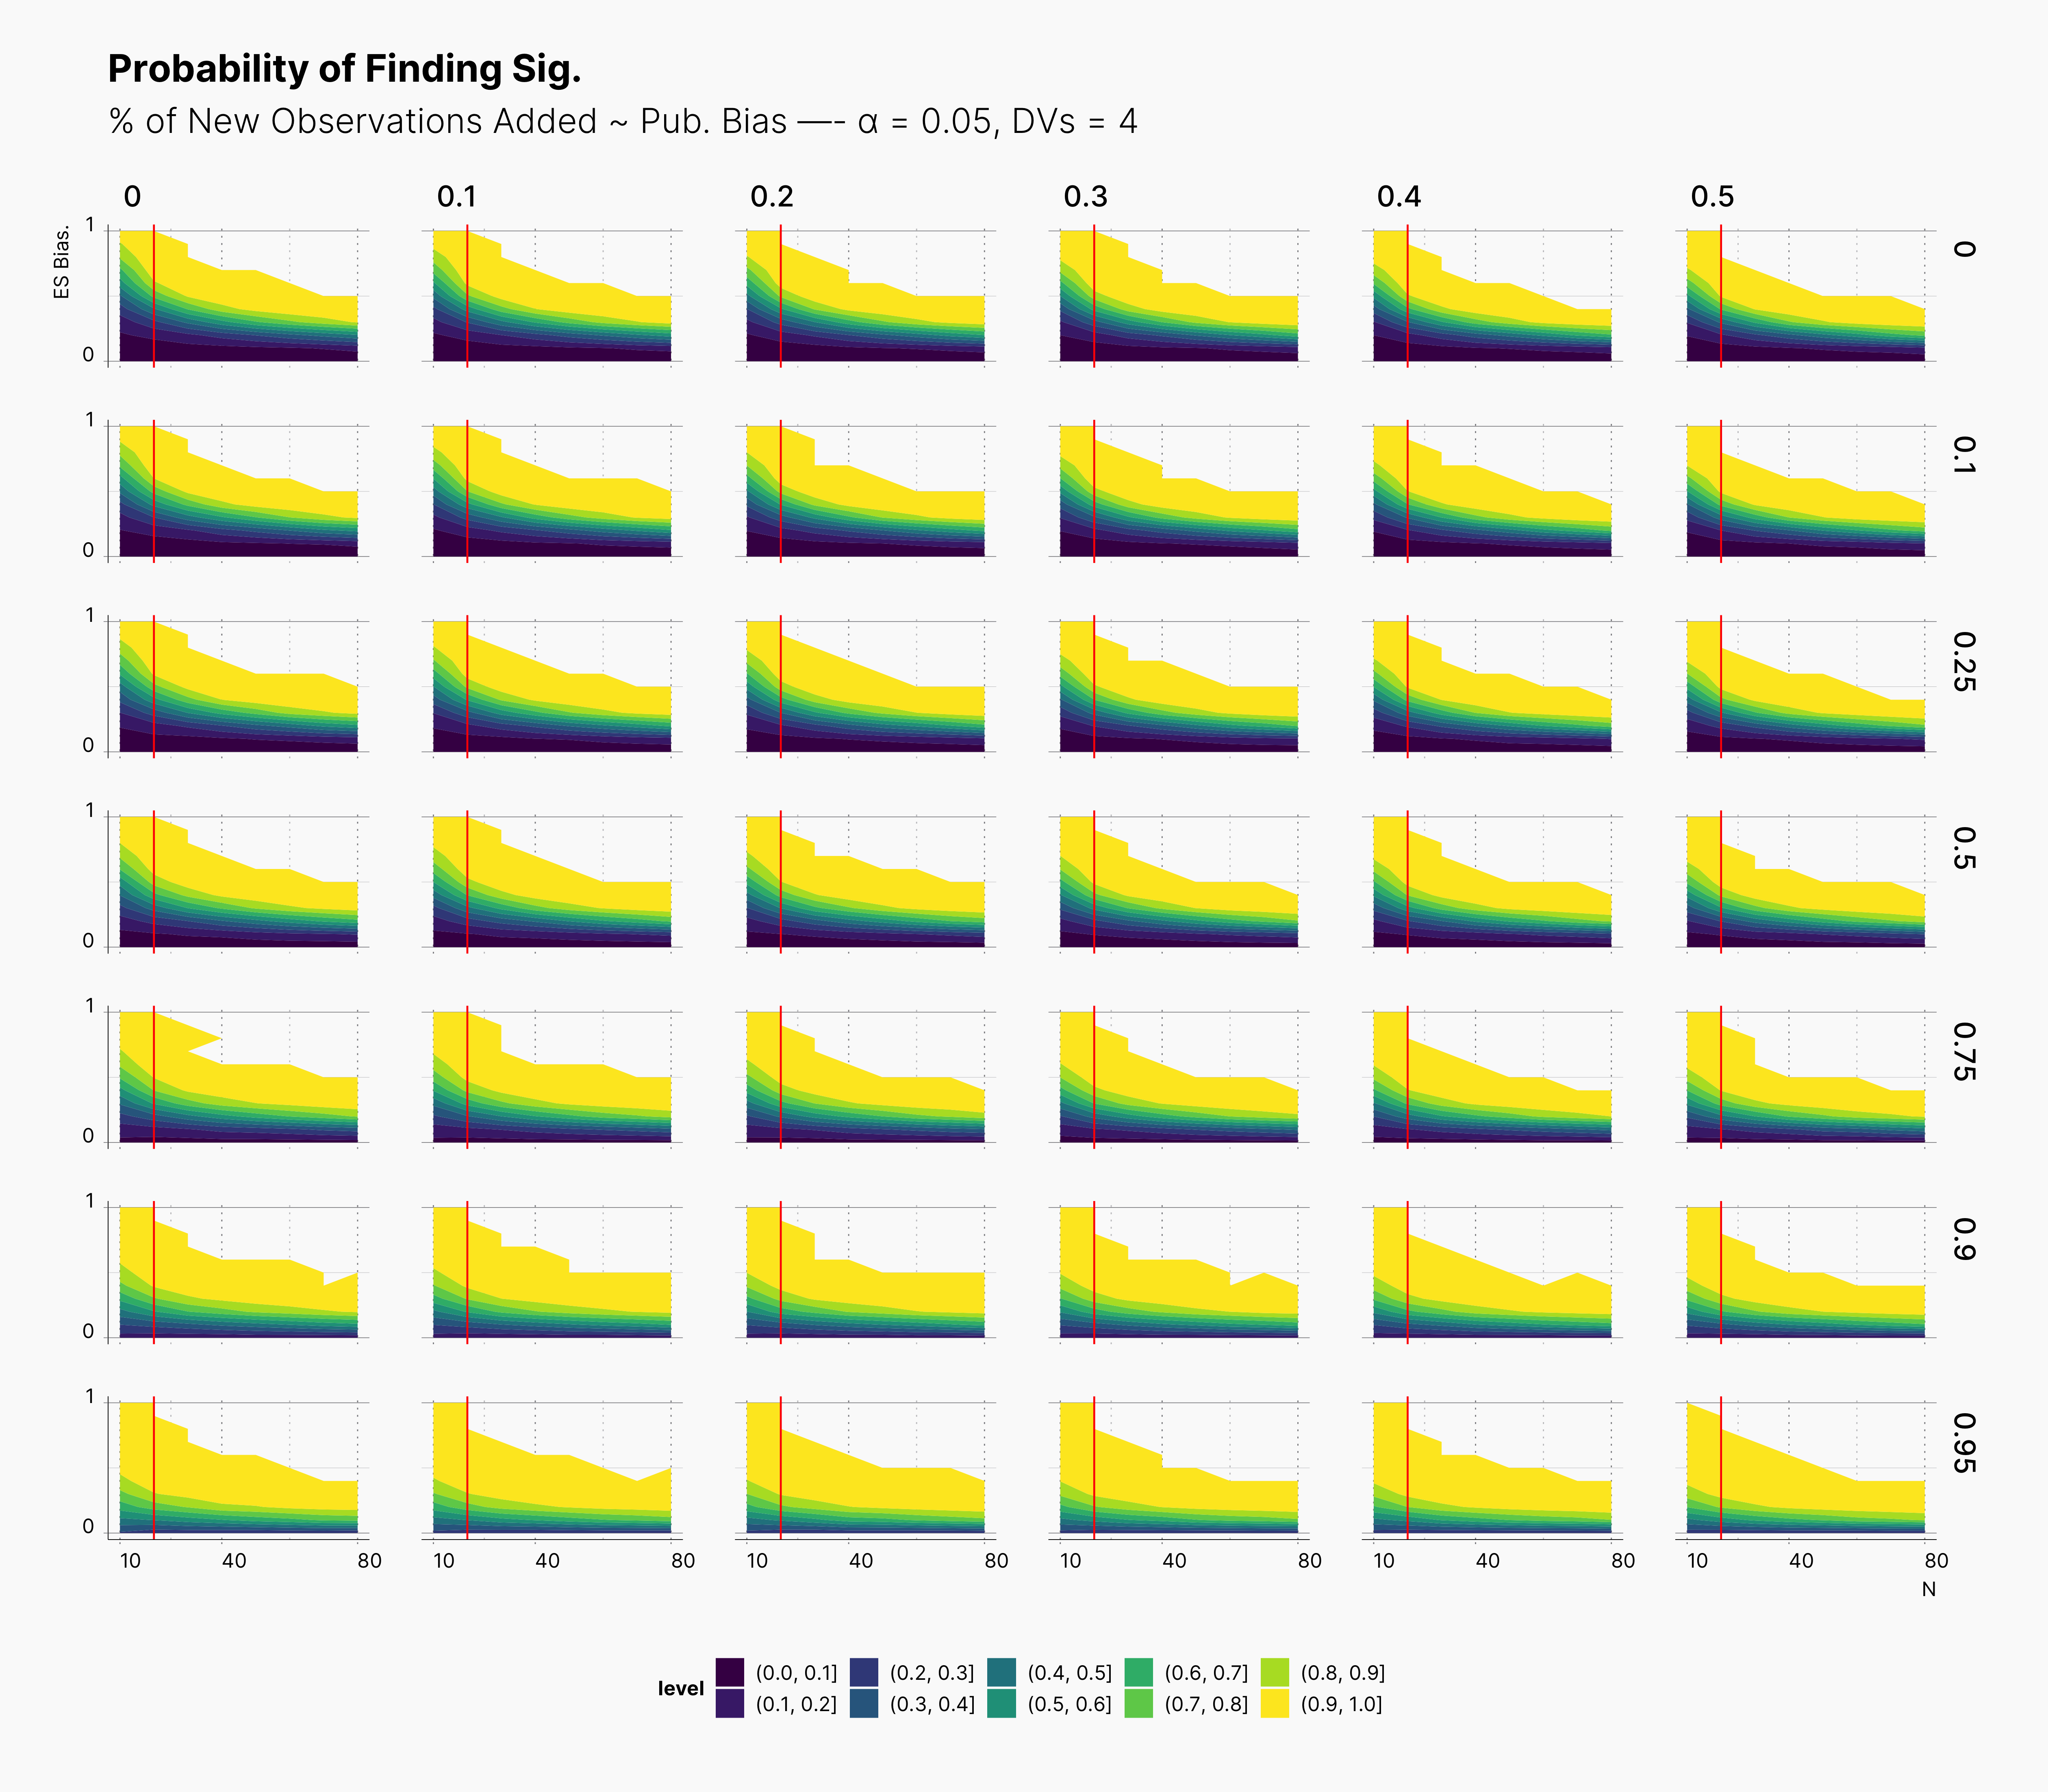
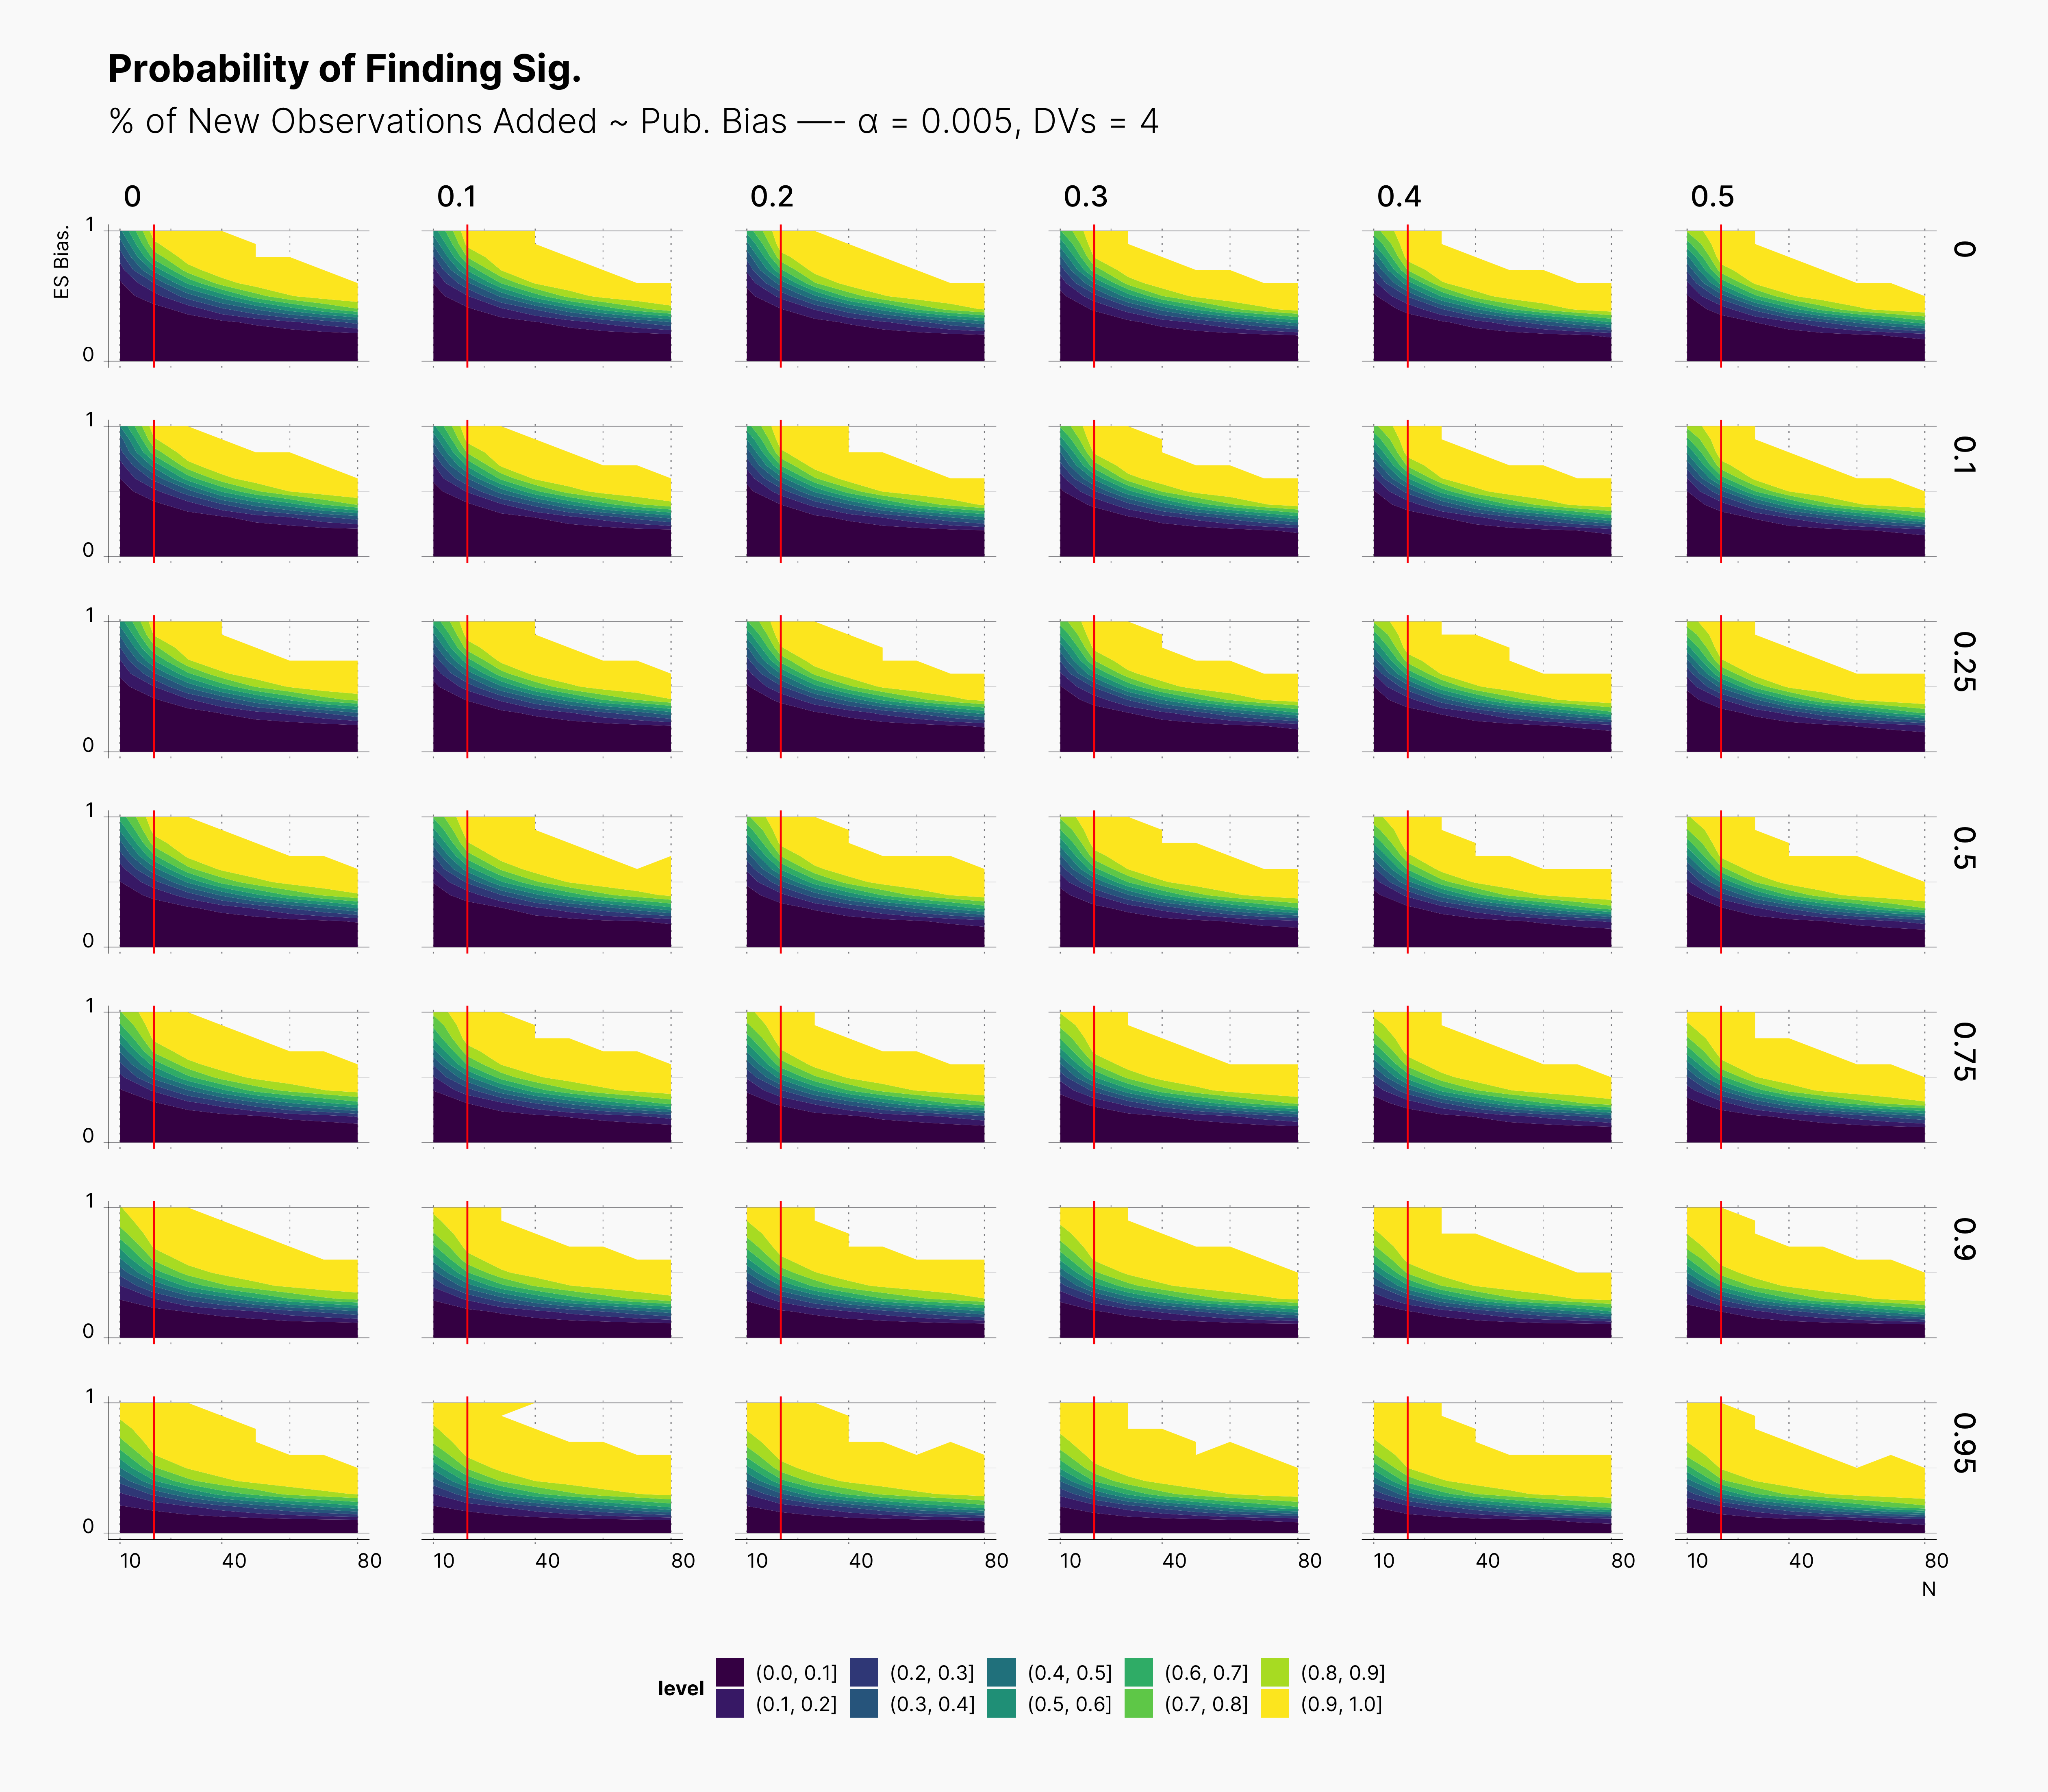
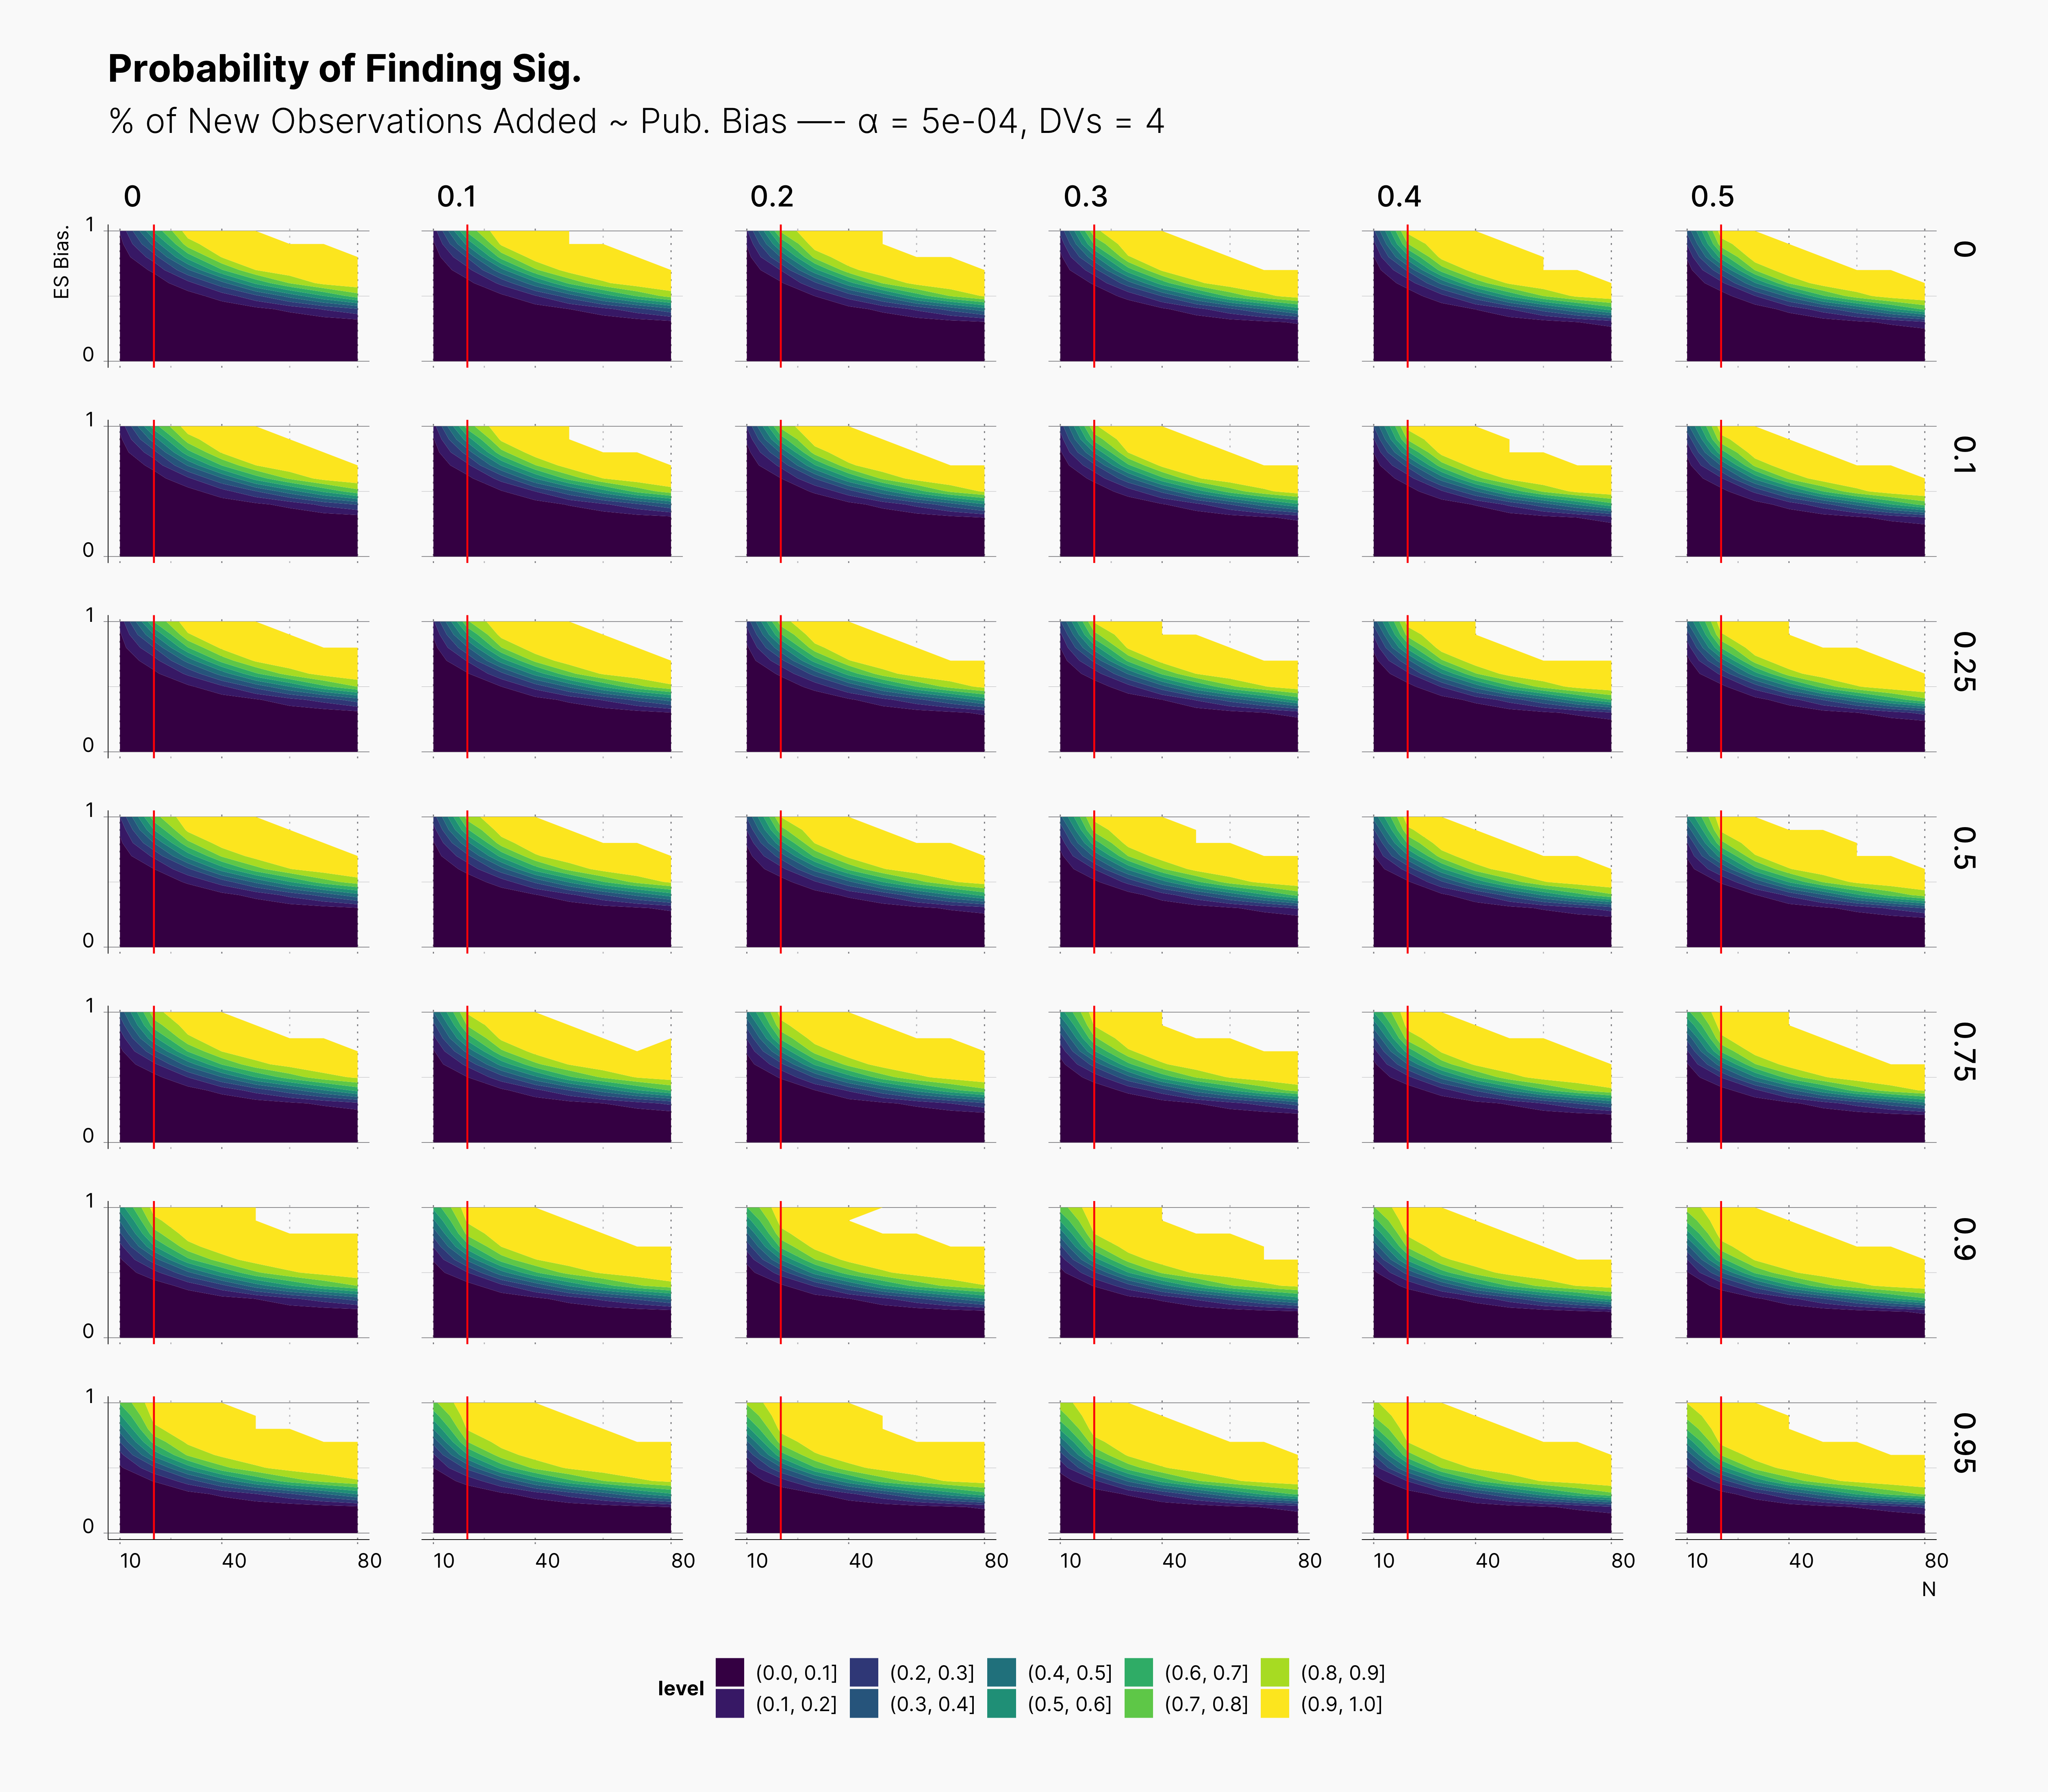
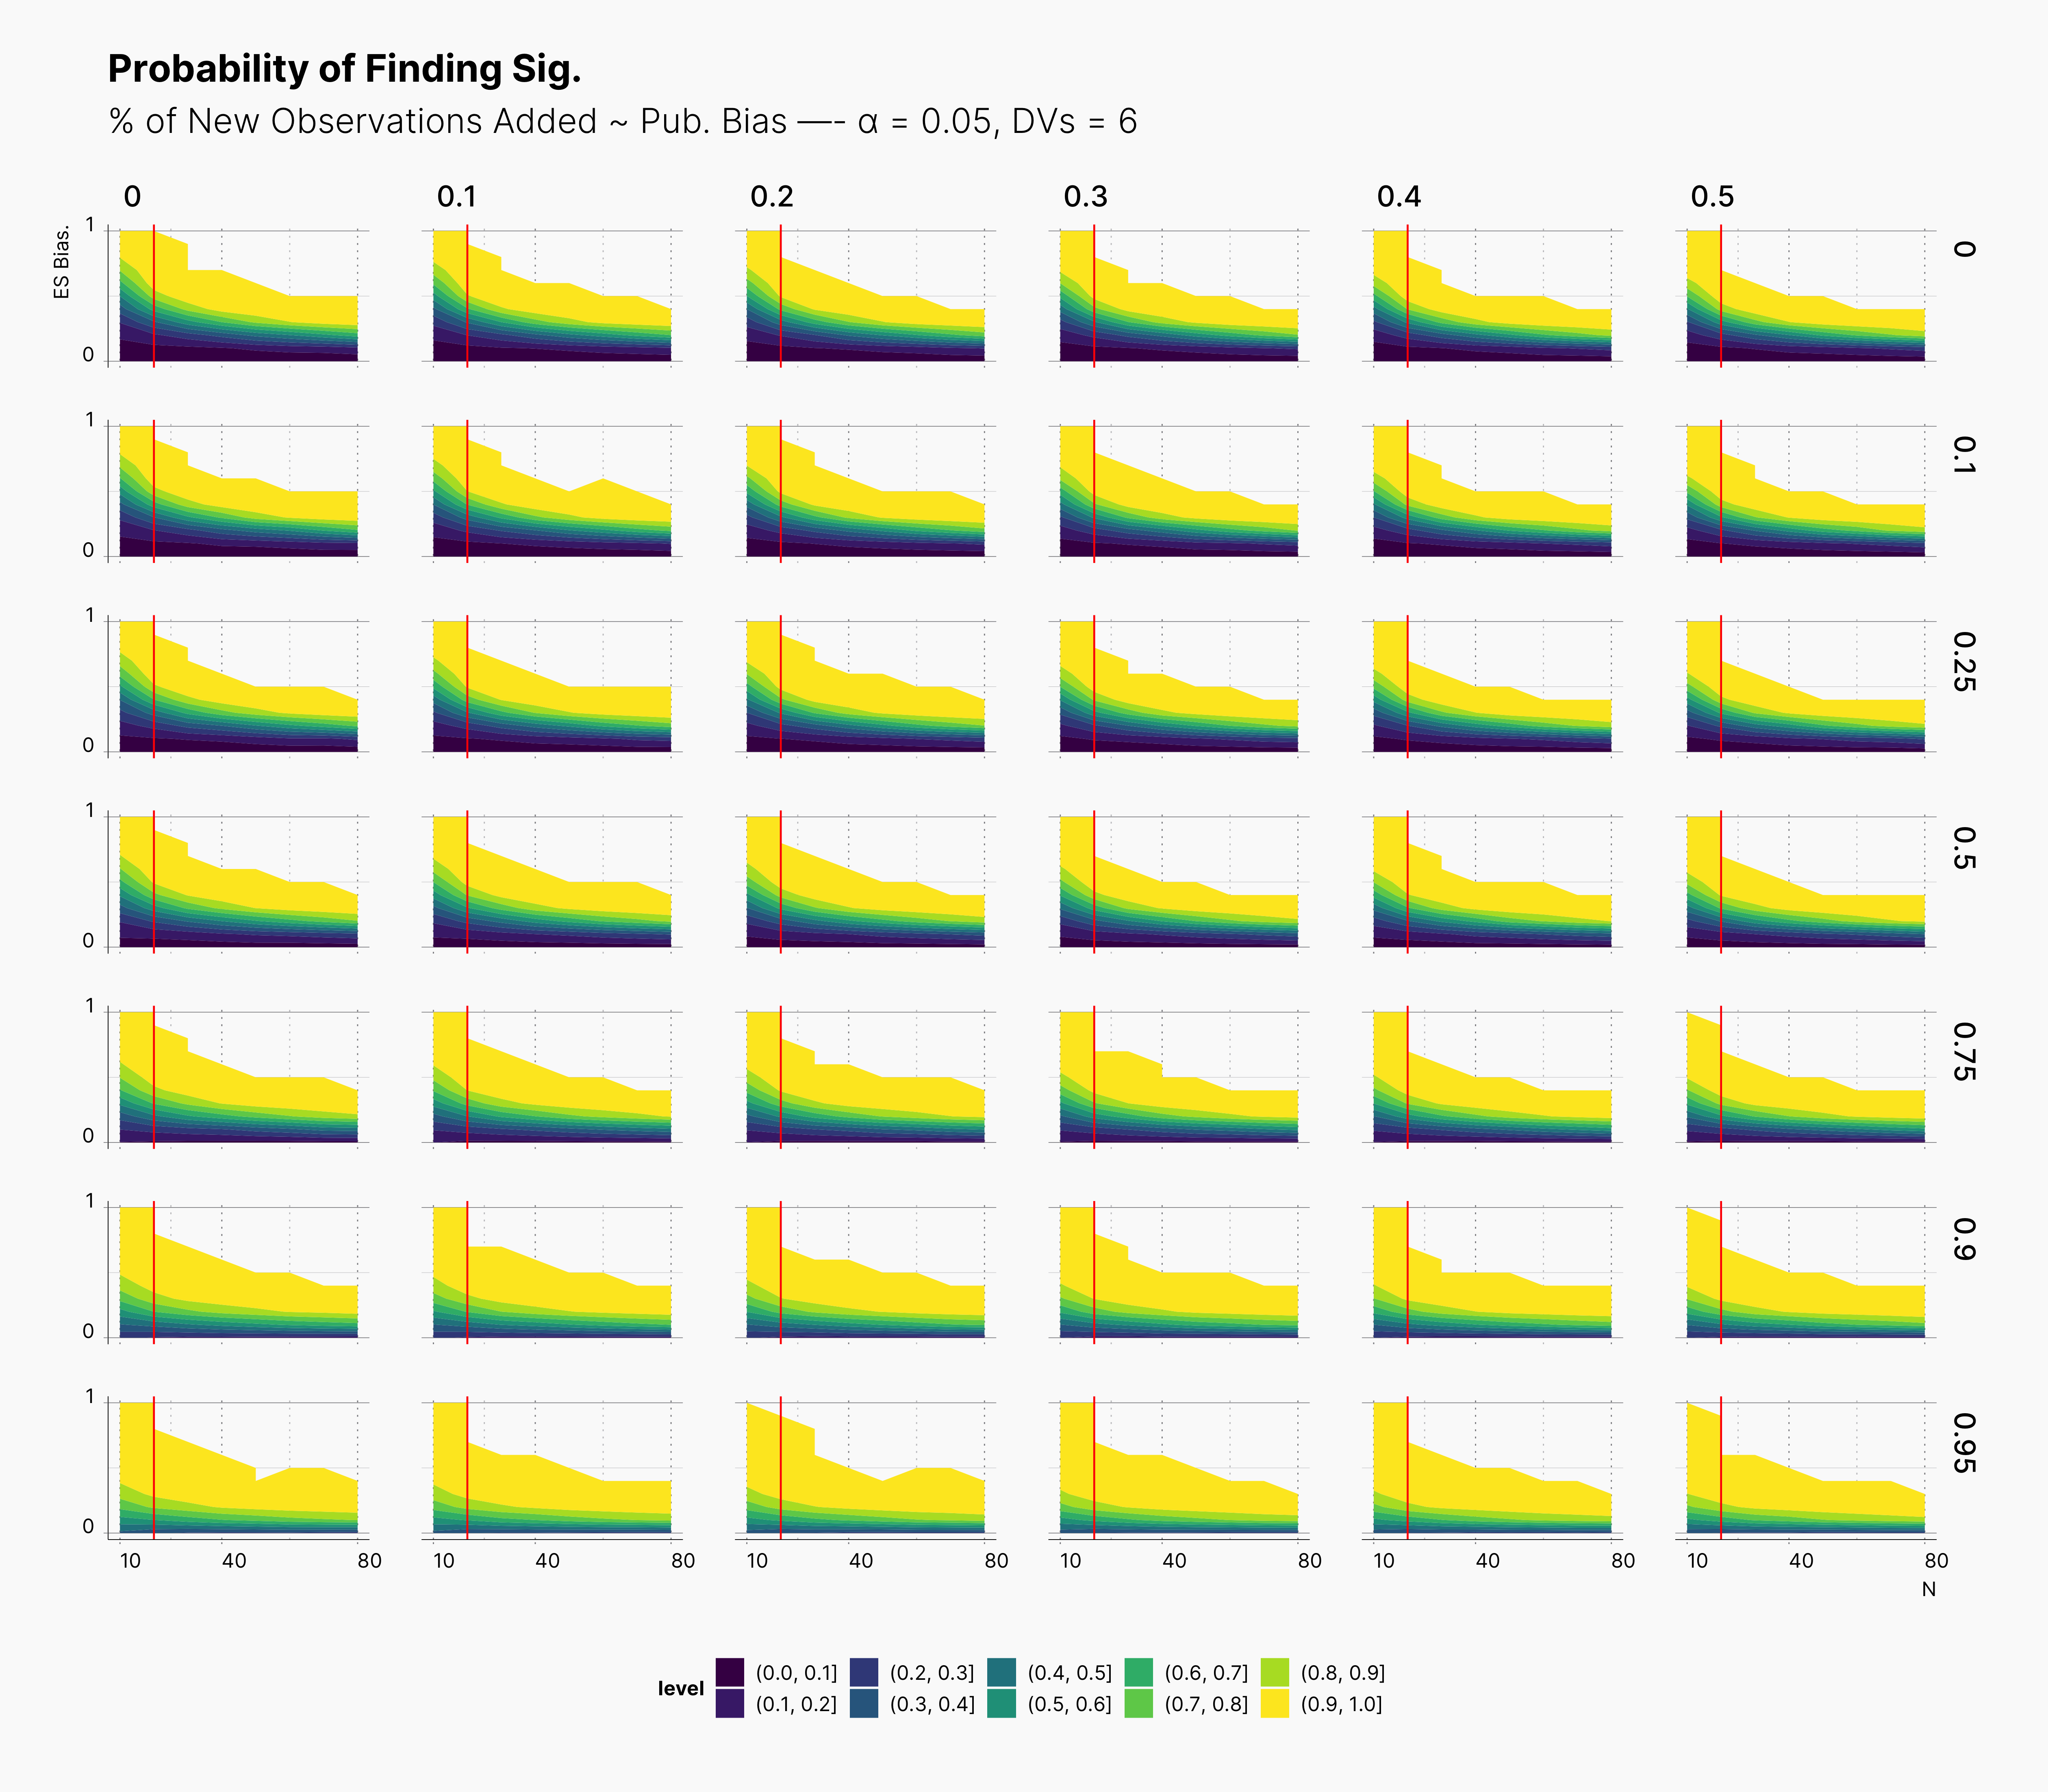
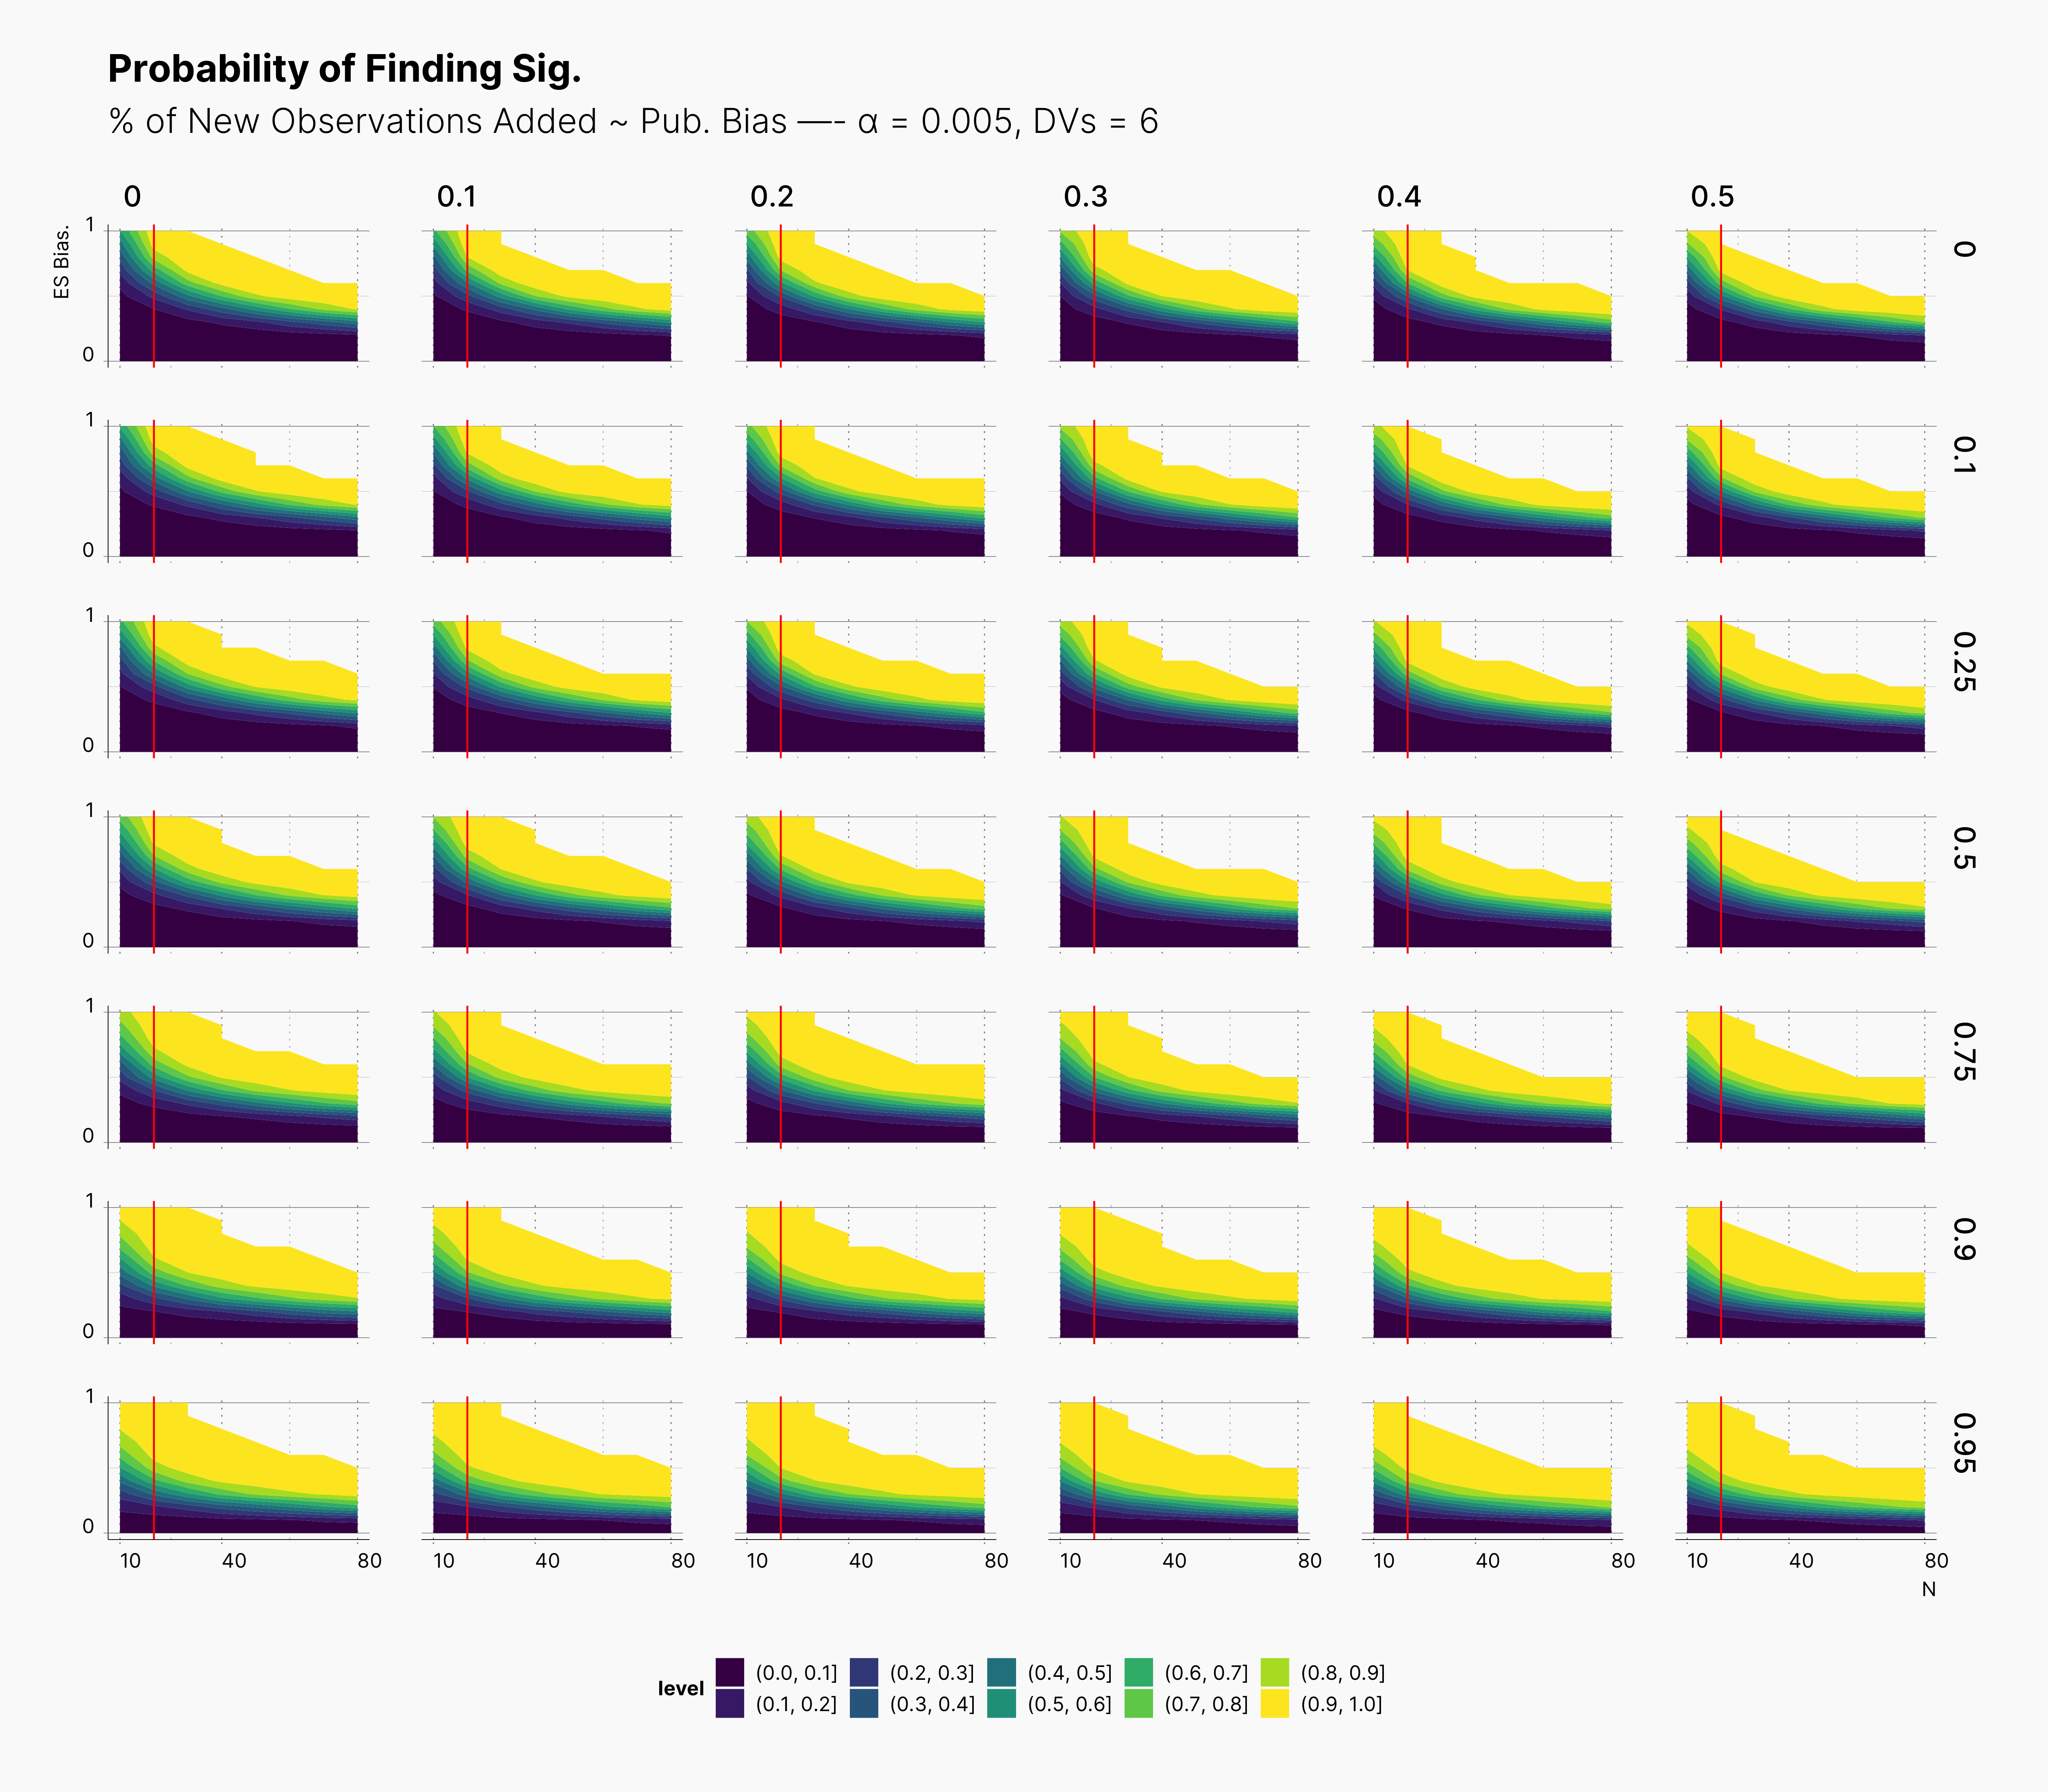
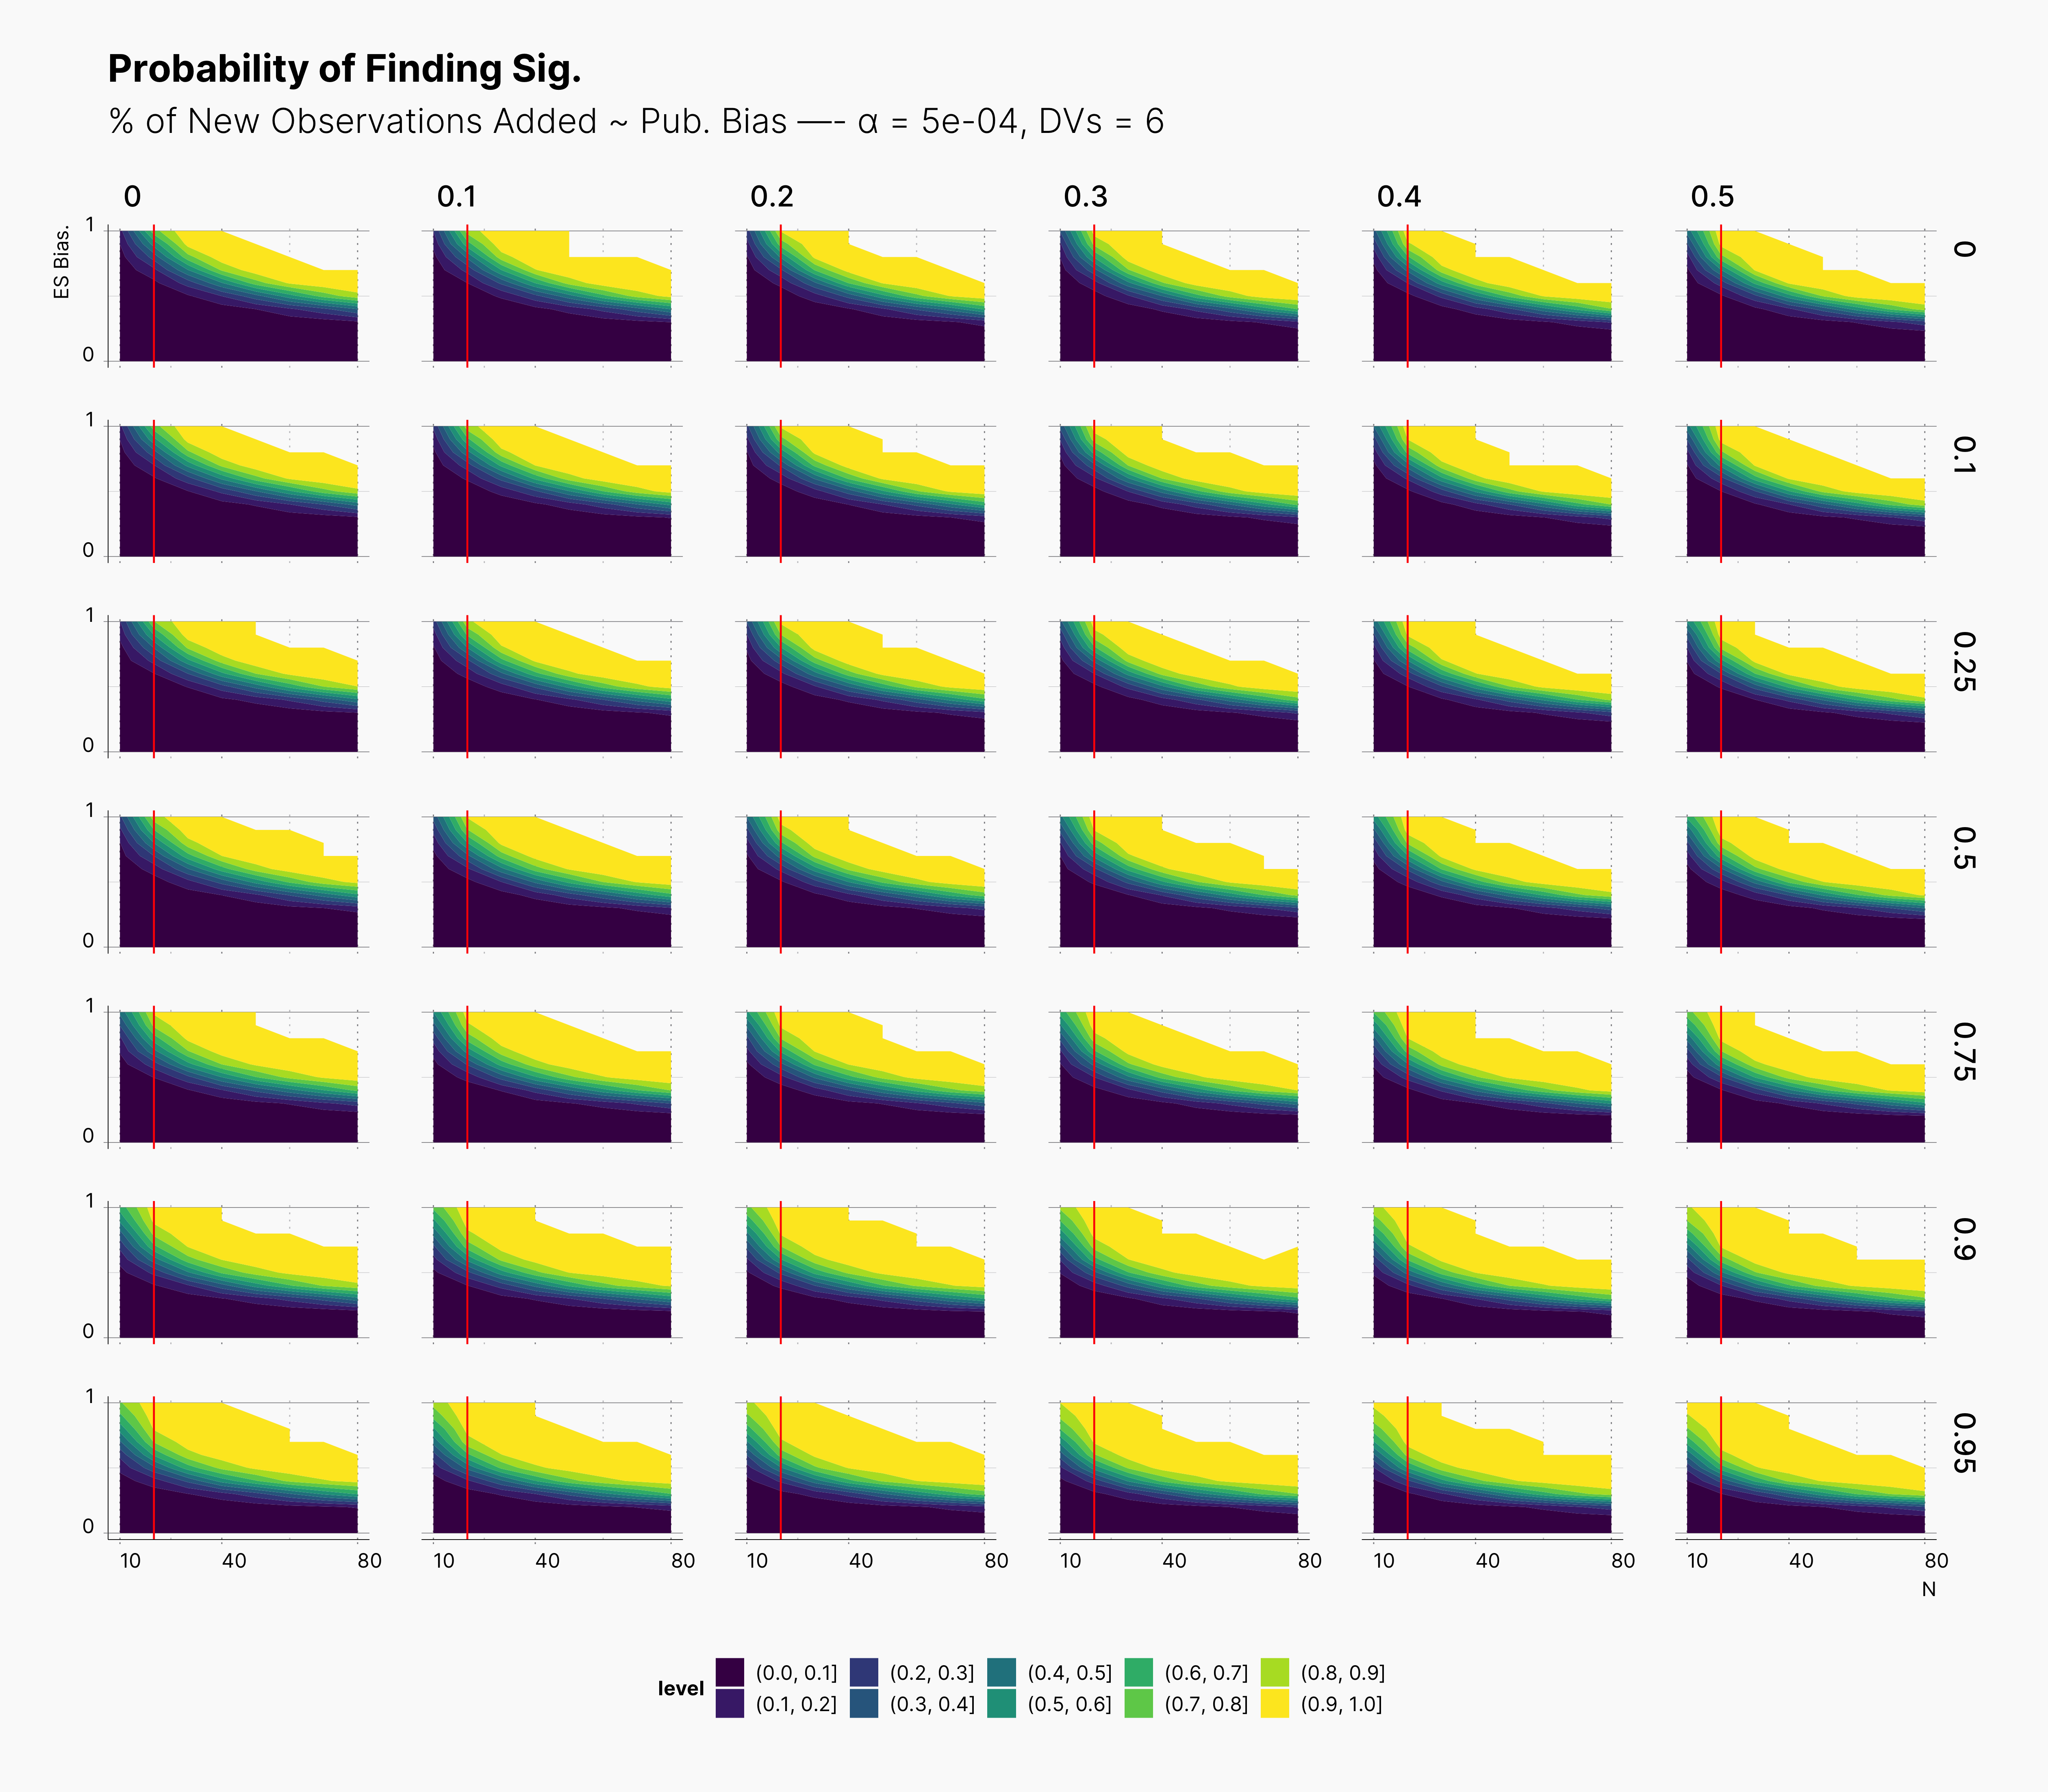
For our first results, we present the probablity of finding significant in the following set of figures. We present three main set of figures, each showcasing results from studies with different number of dependent variables, ie., 2, 4, 6. Additionally, we filtered our results for T = 1. Appendix A will discuss the effect of number of attempts.
In both cases, as we increase S, while we see some growth (and a shift toward left) in the yellow region of the contour plot, (region with highest probablity of finding significant) we do not believe that this growth or even the overall change of the landscape is noticeably different from our benchmark column — first column with no optional stopping.
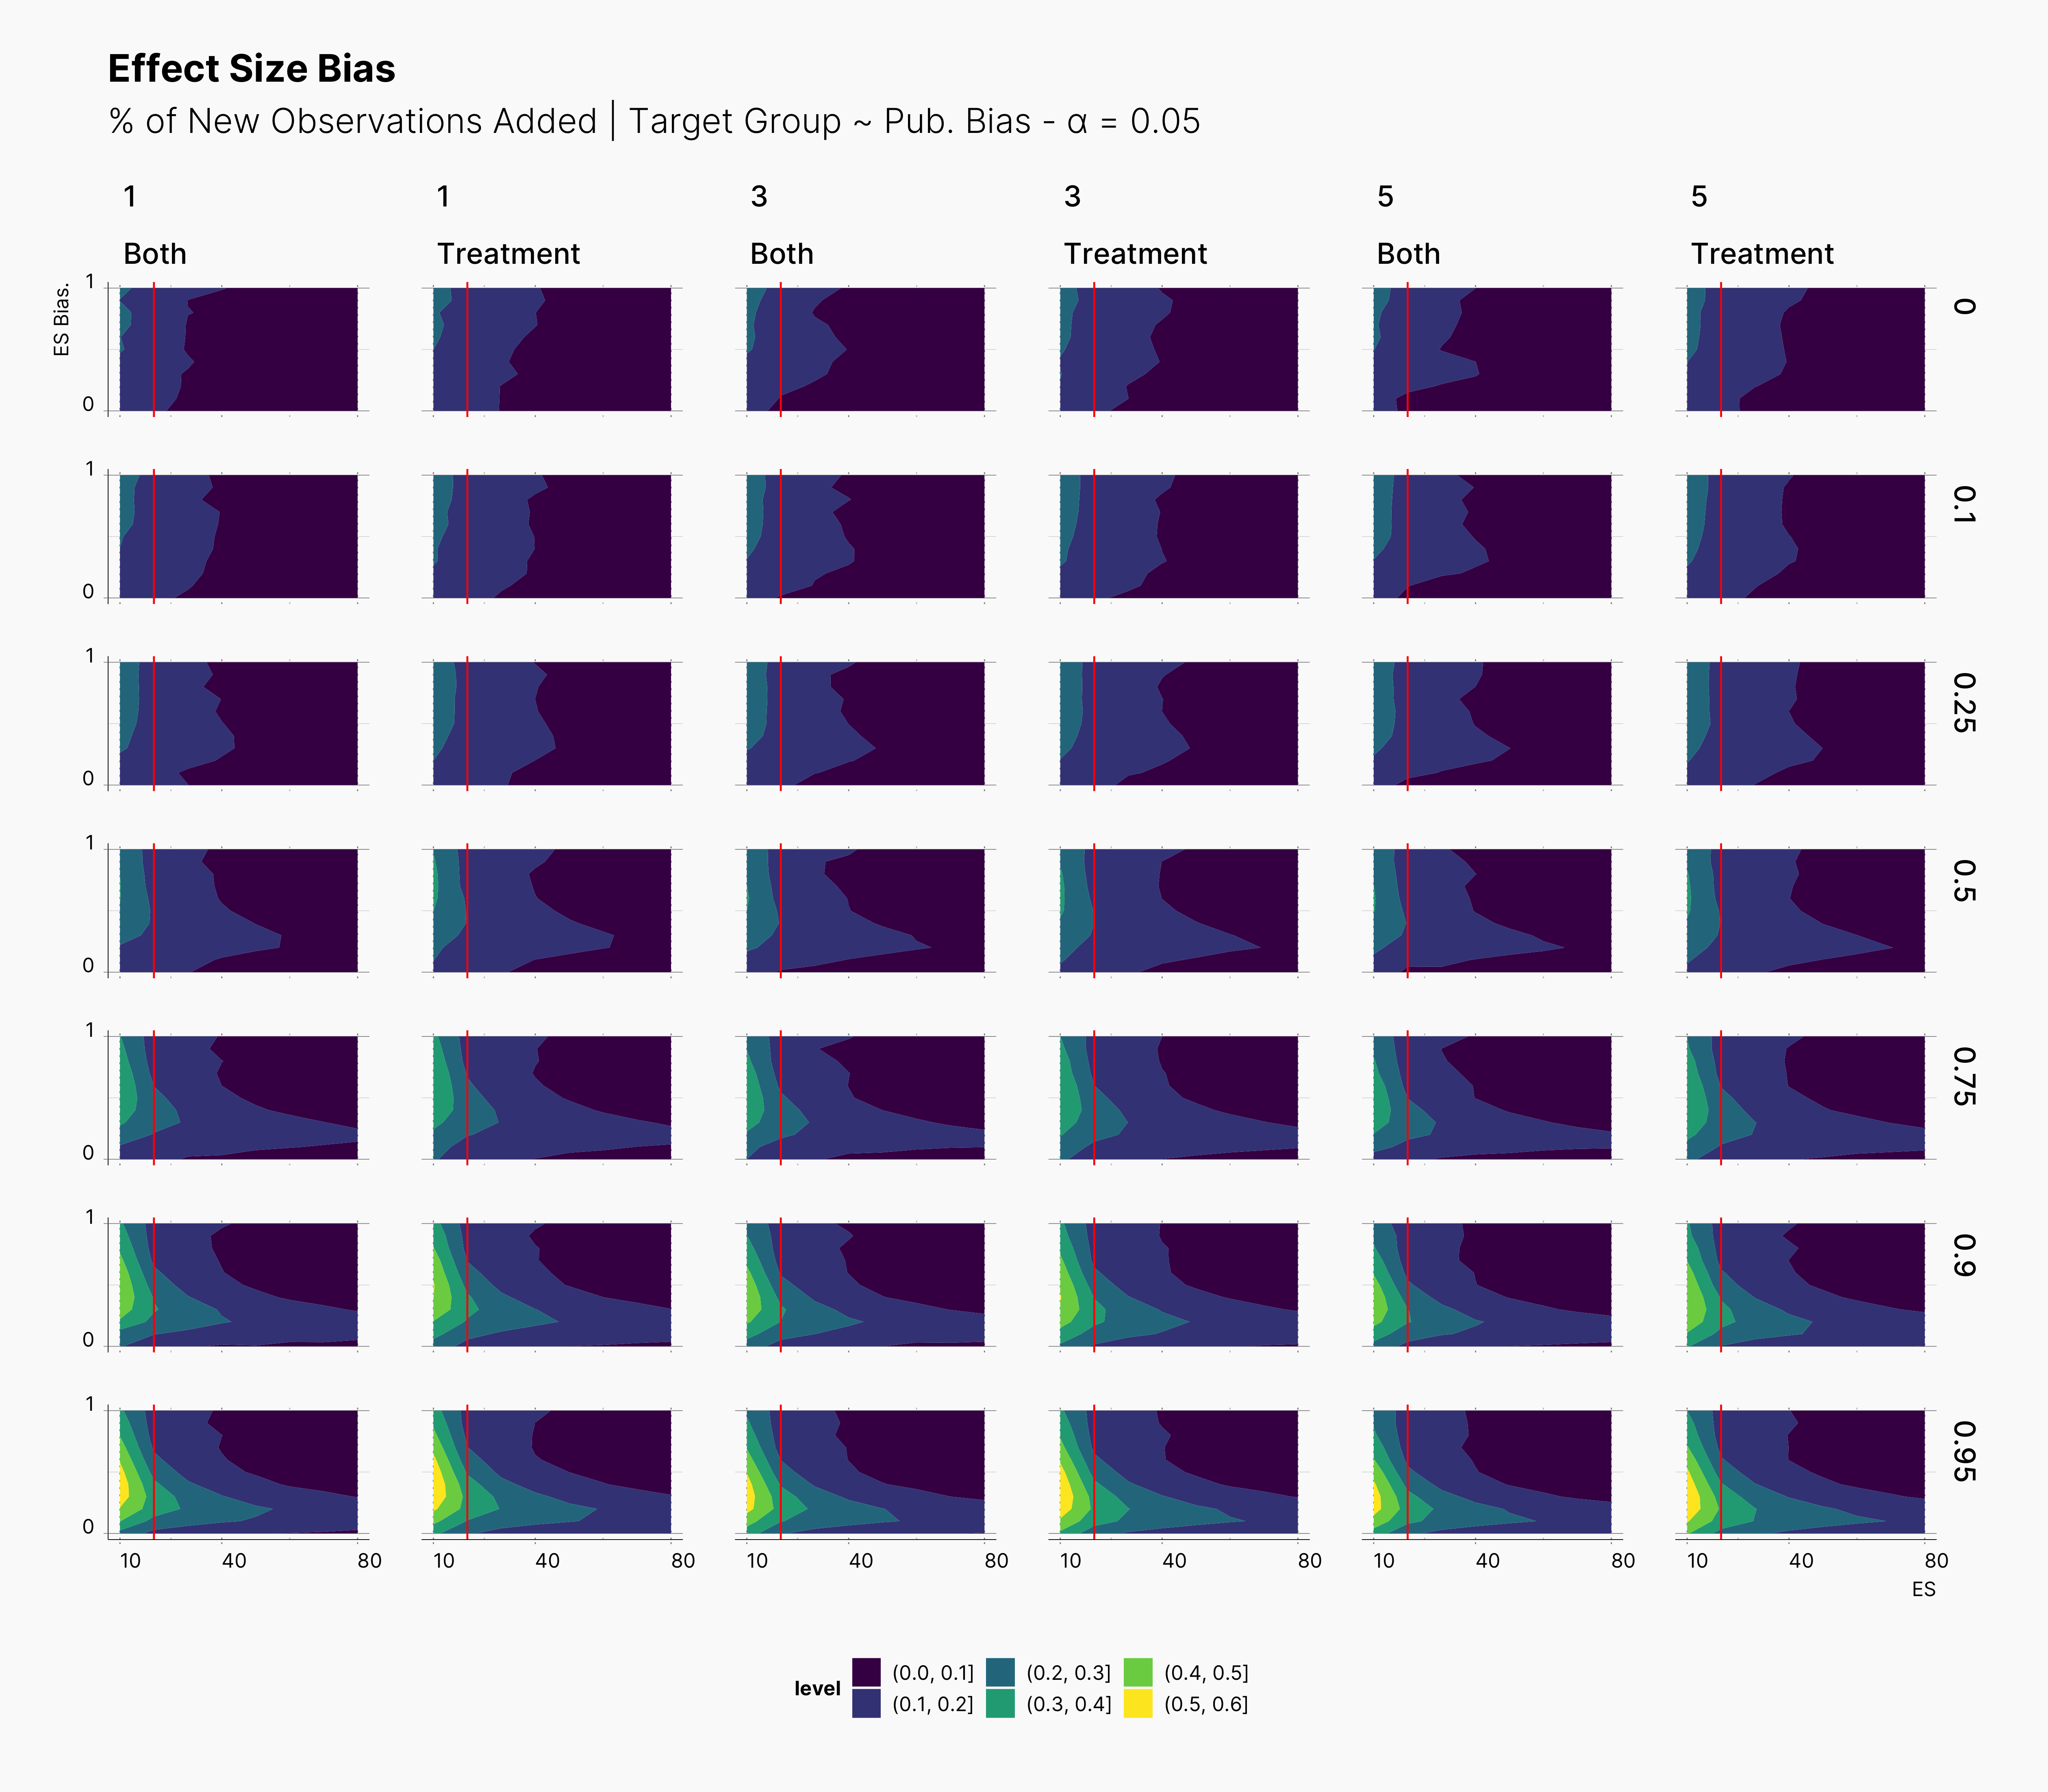
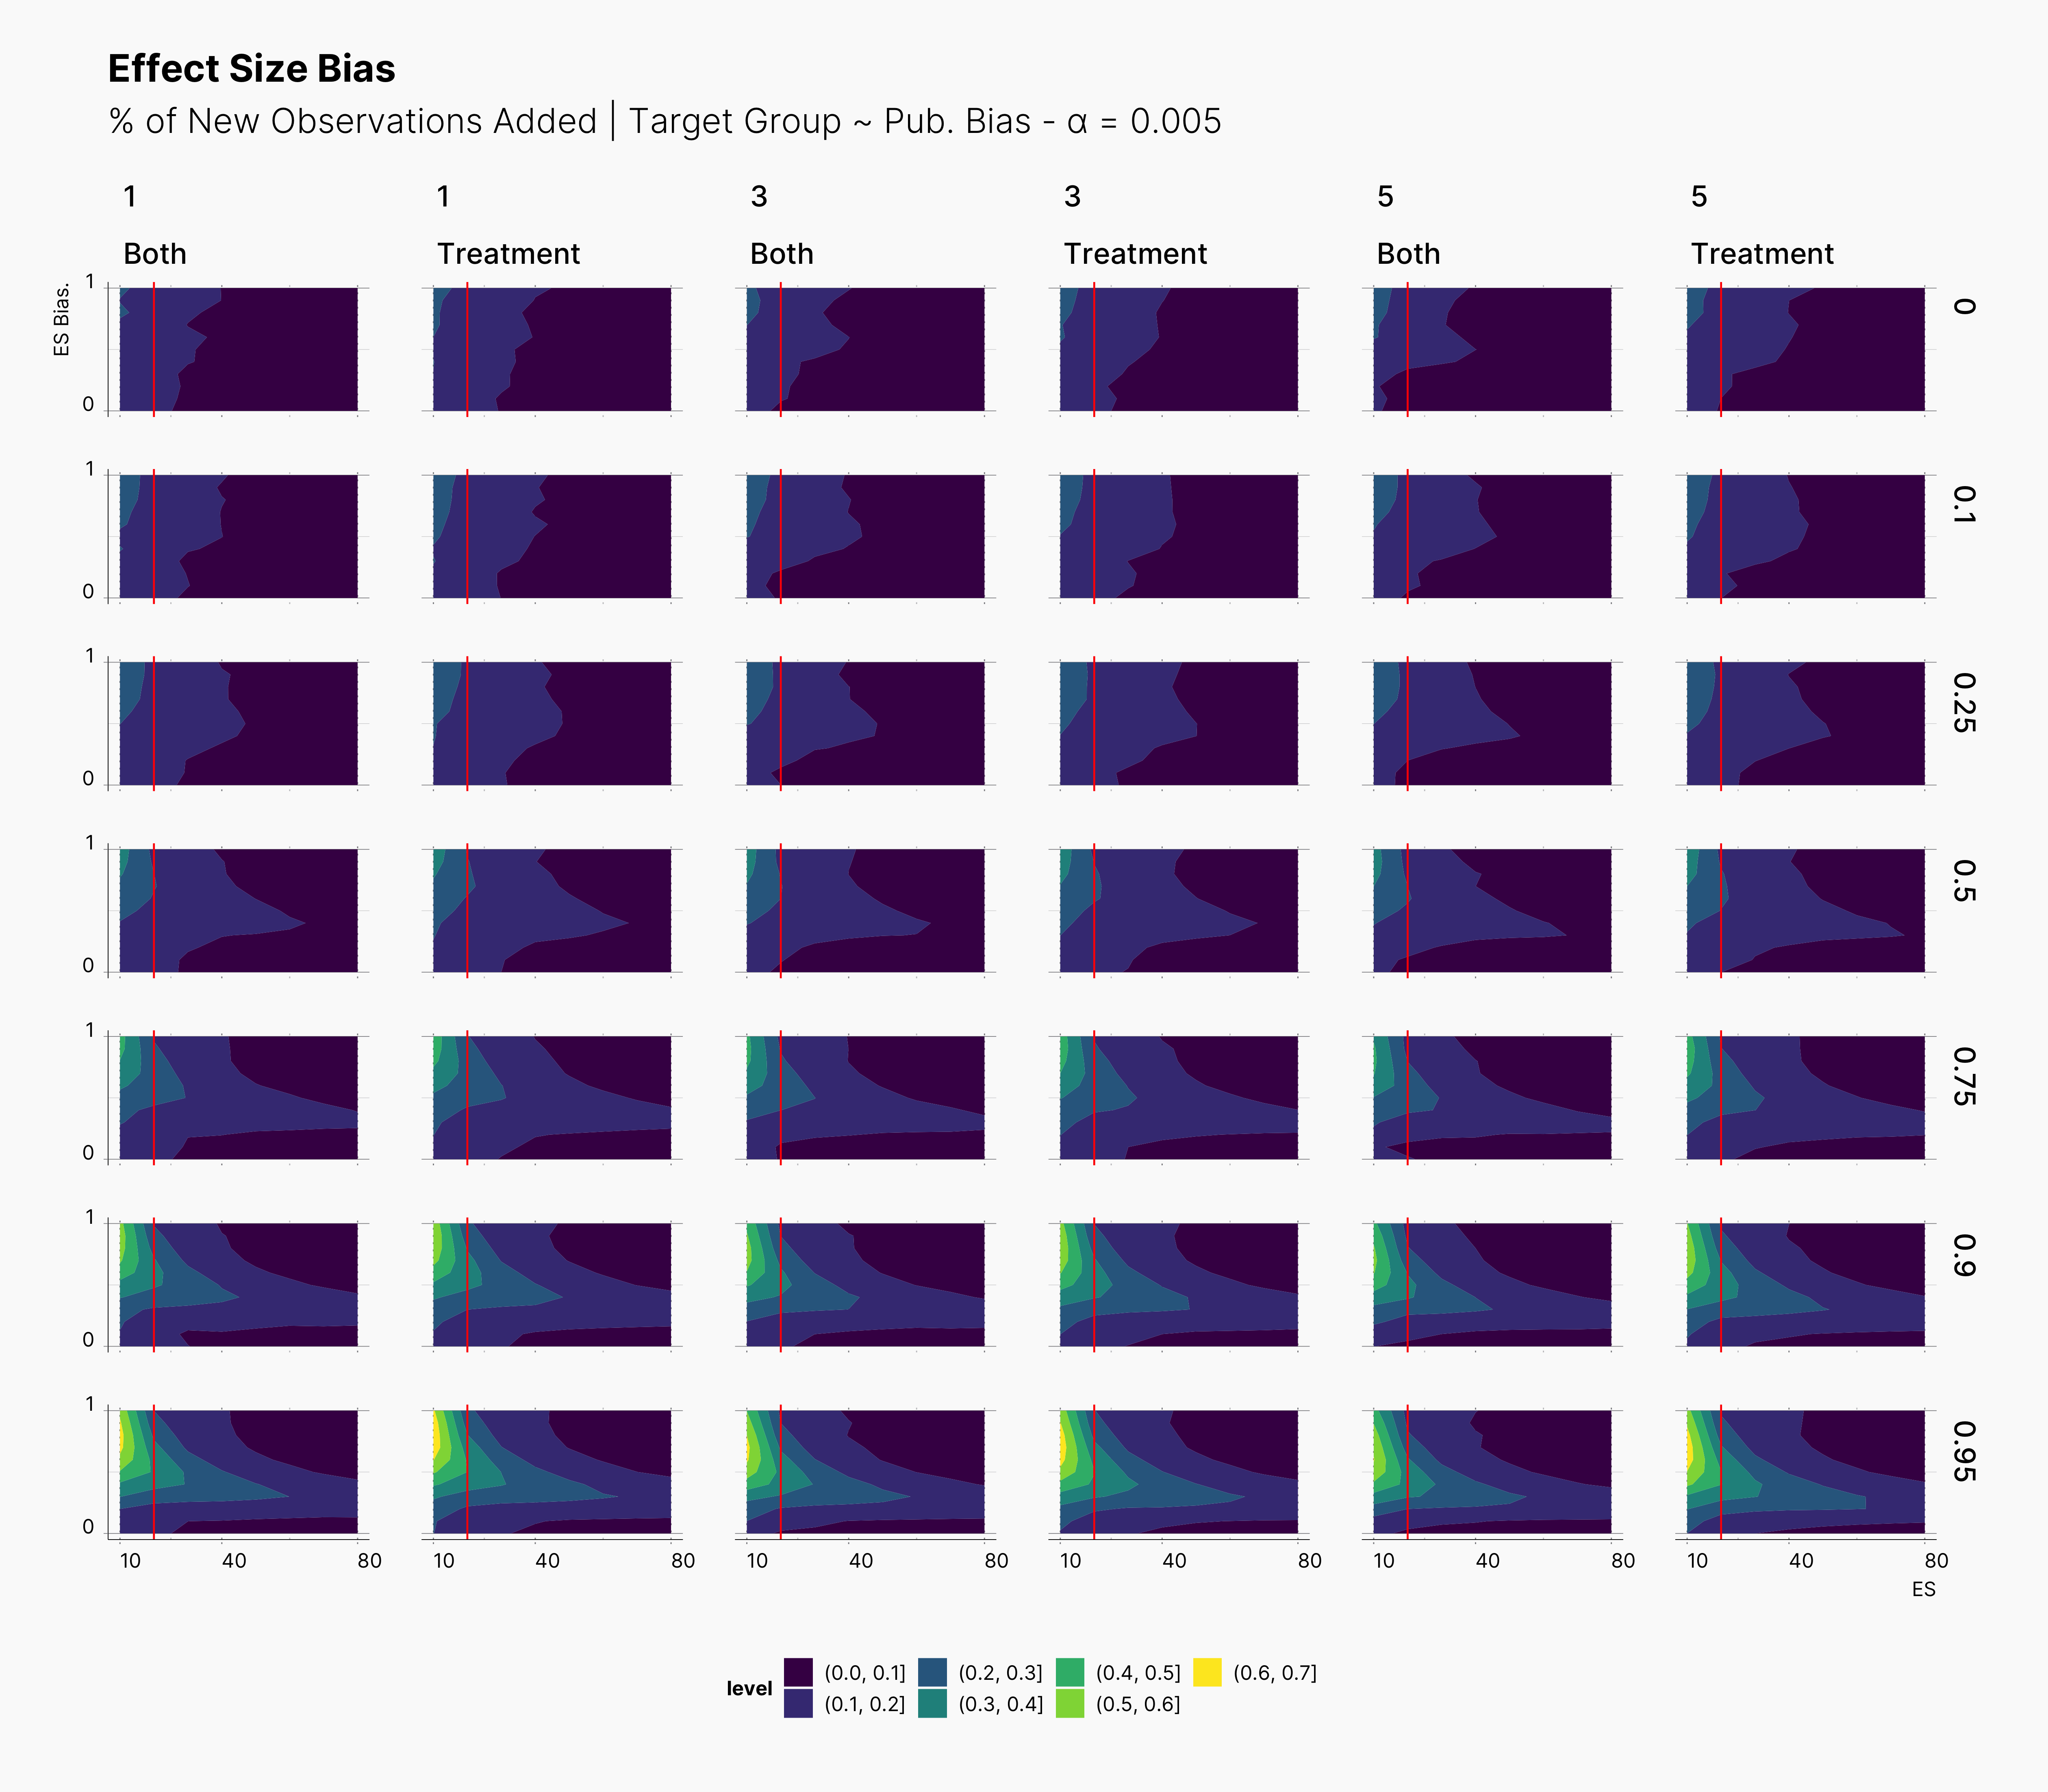
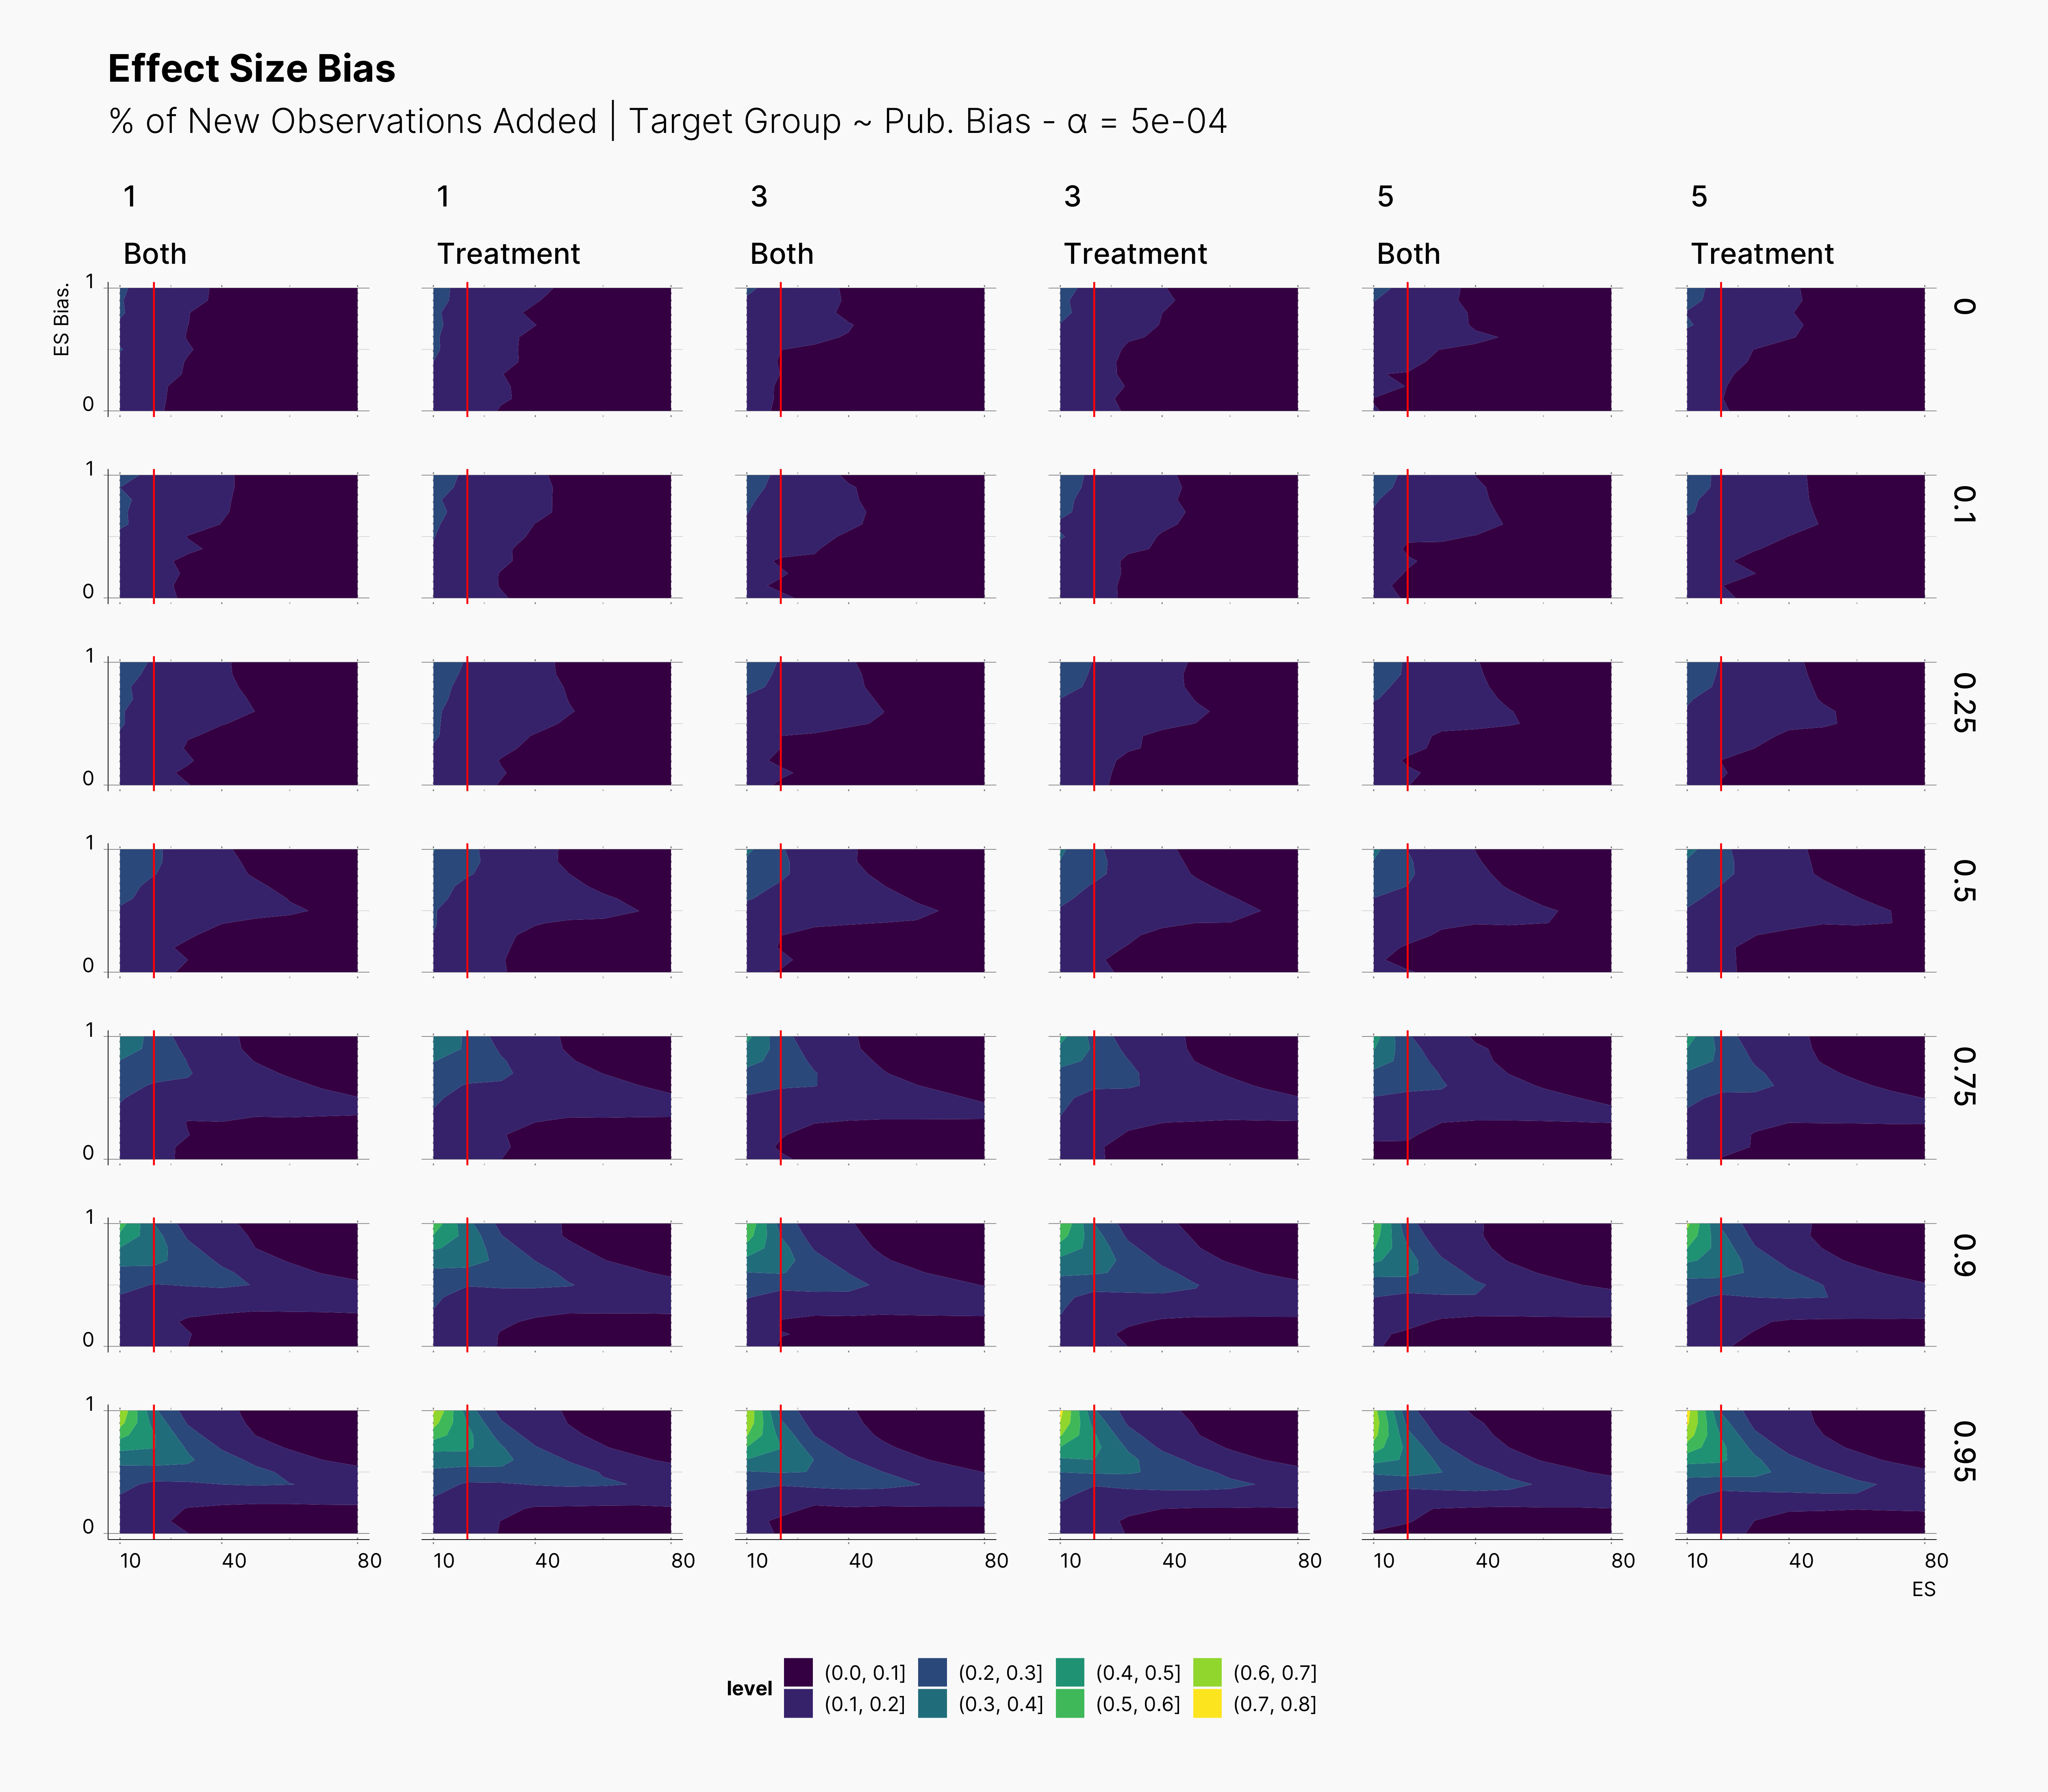
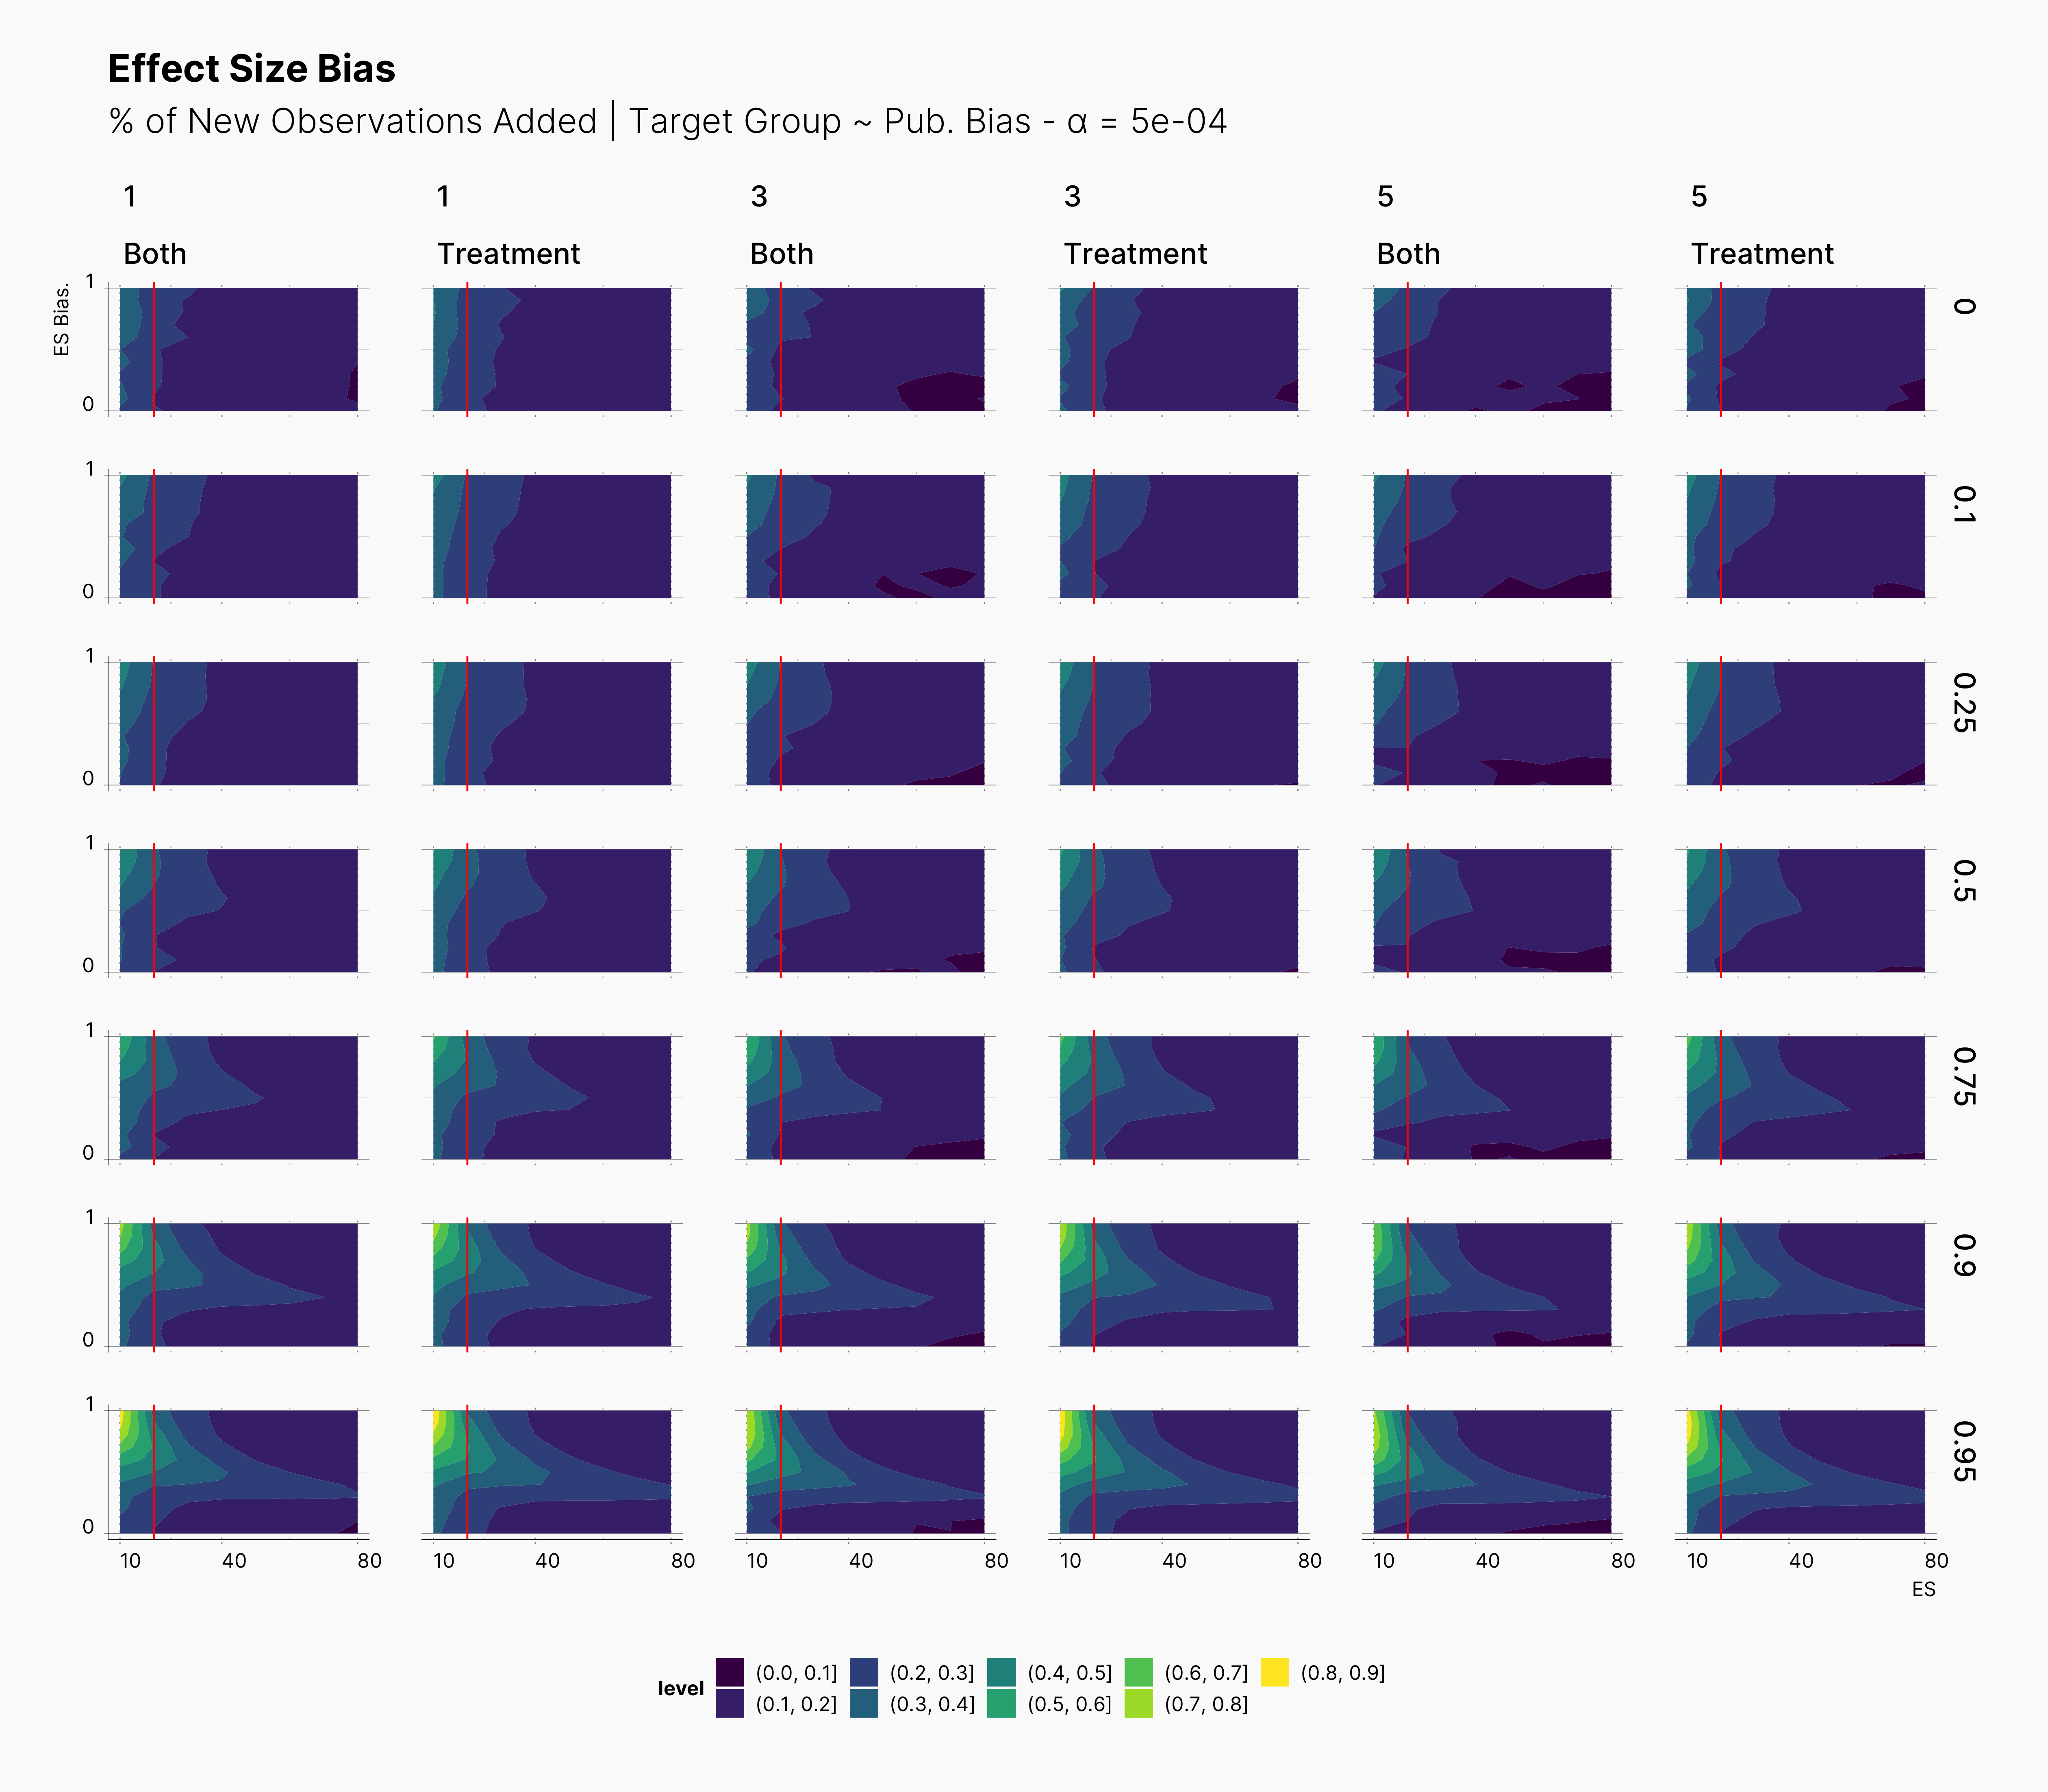
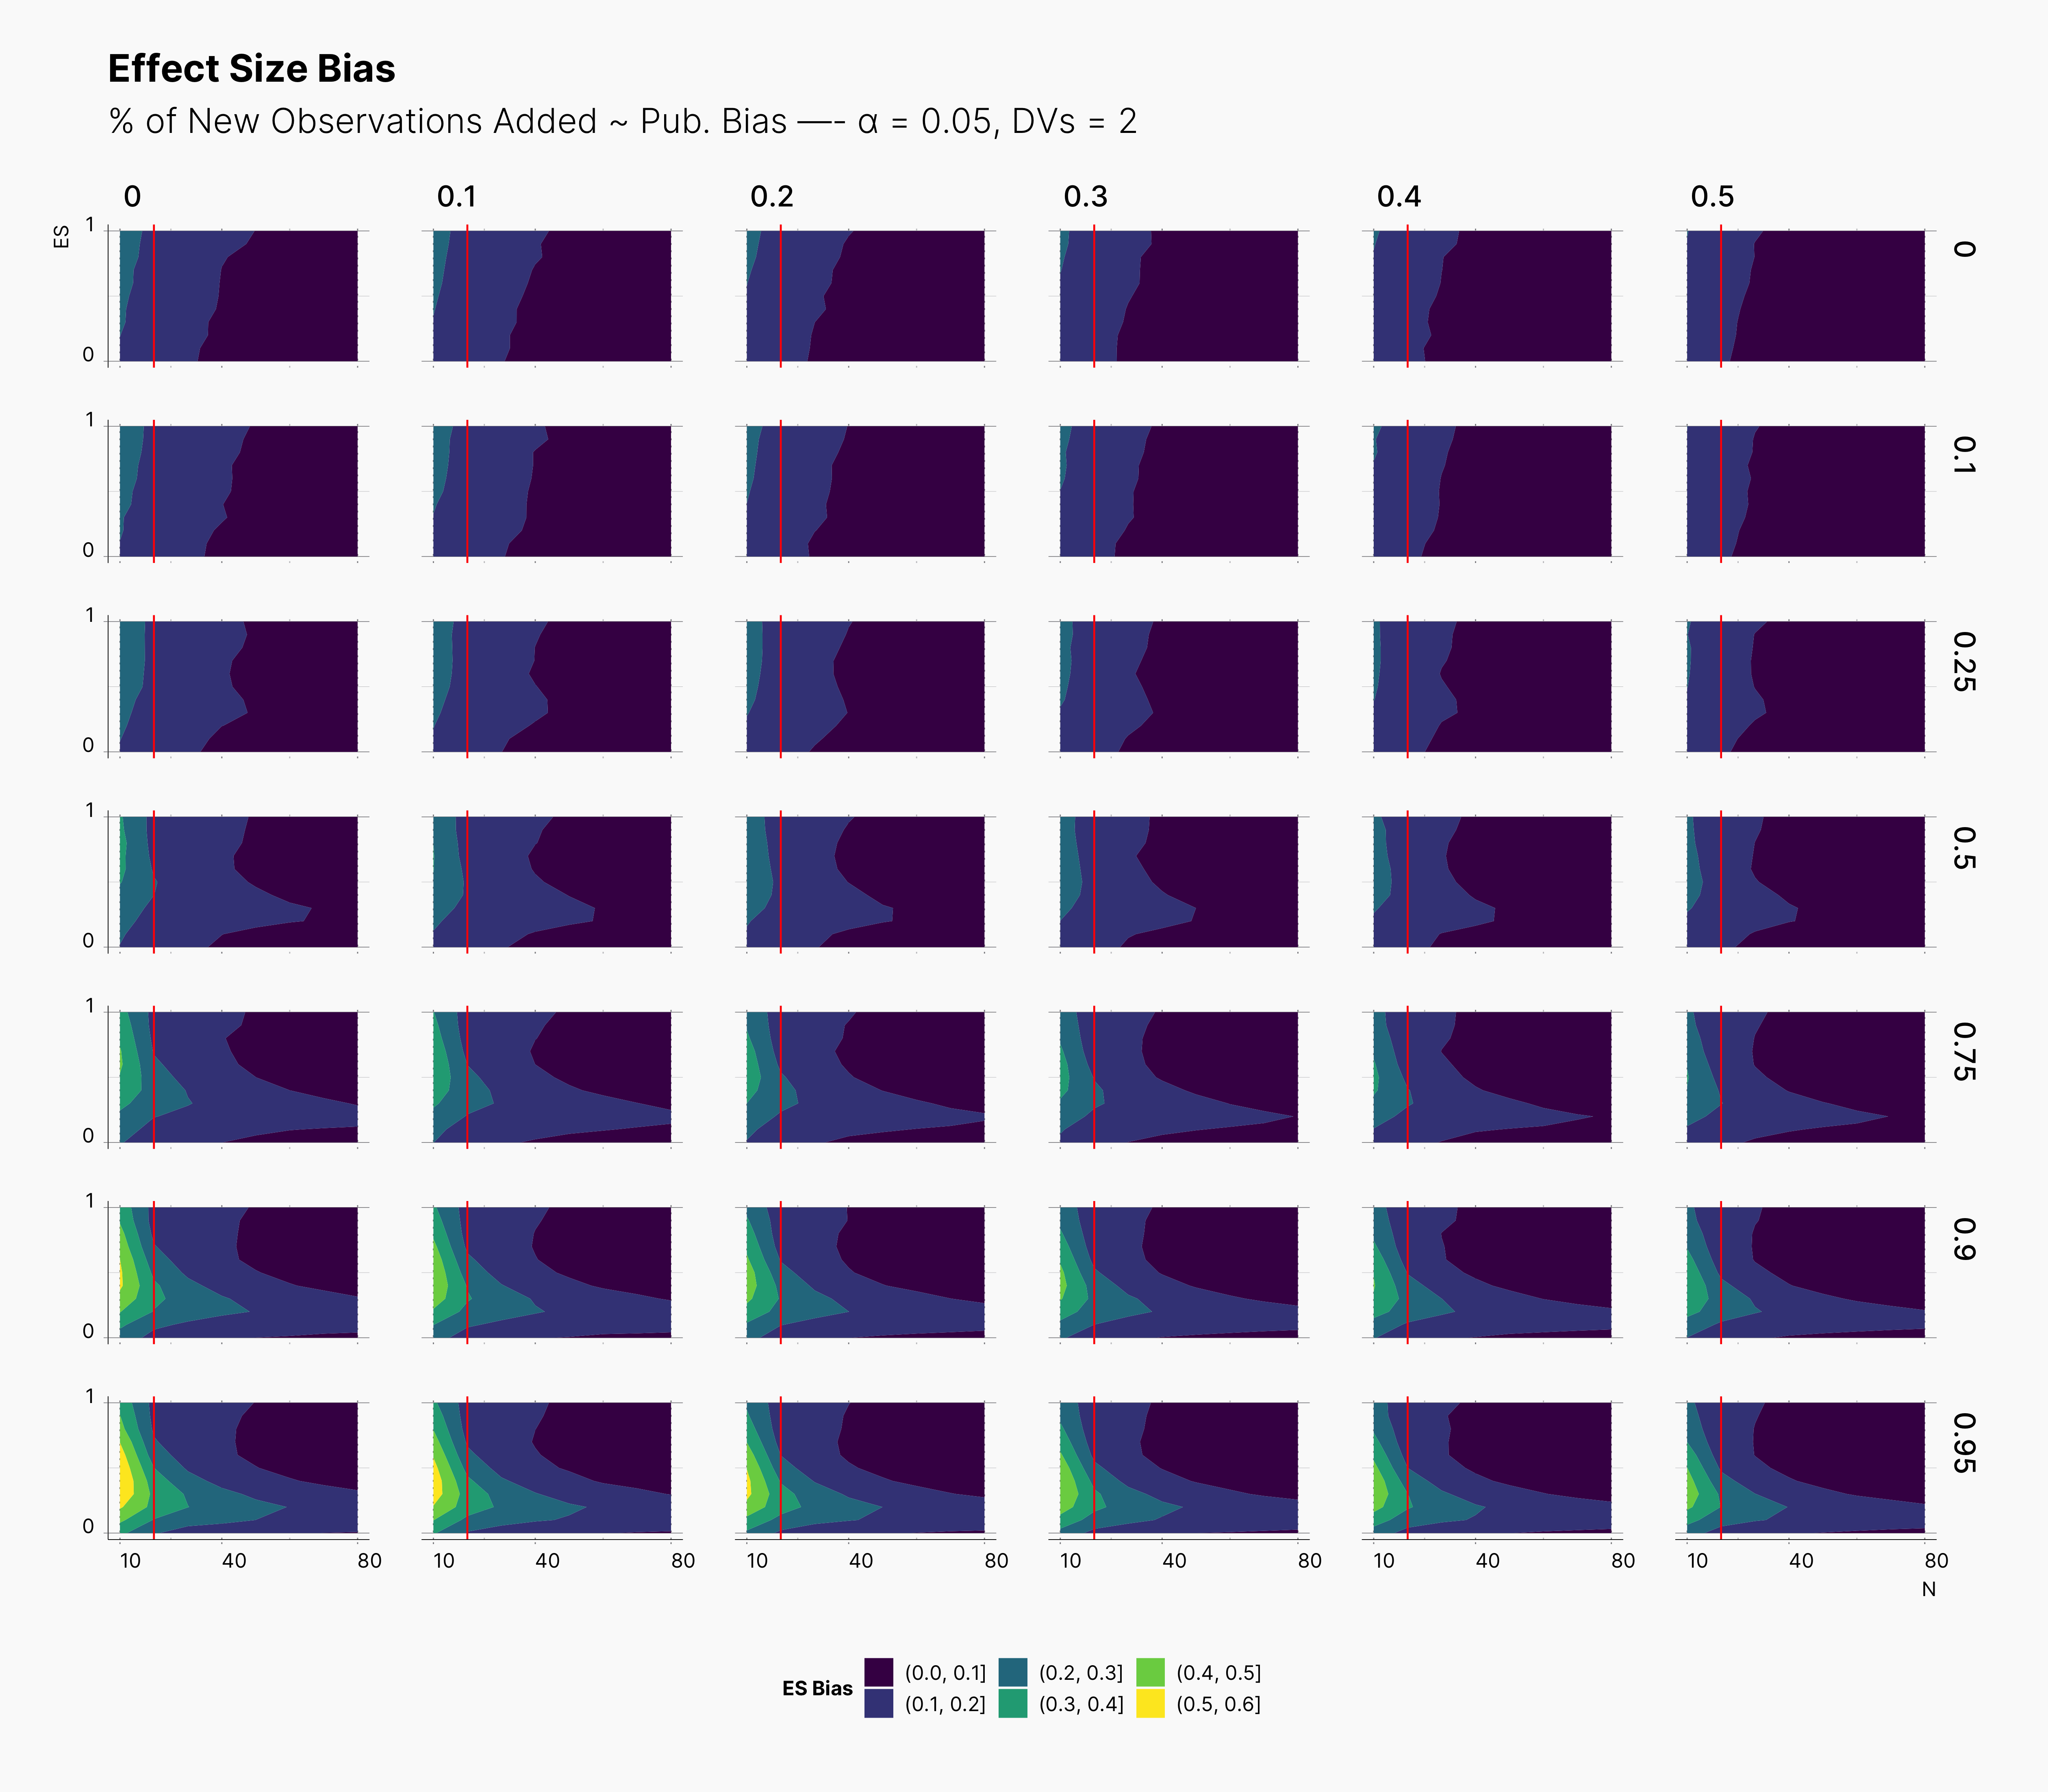
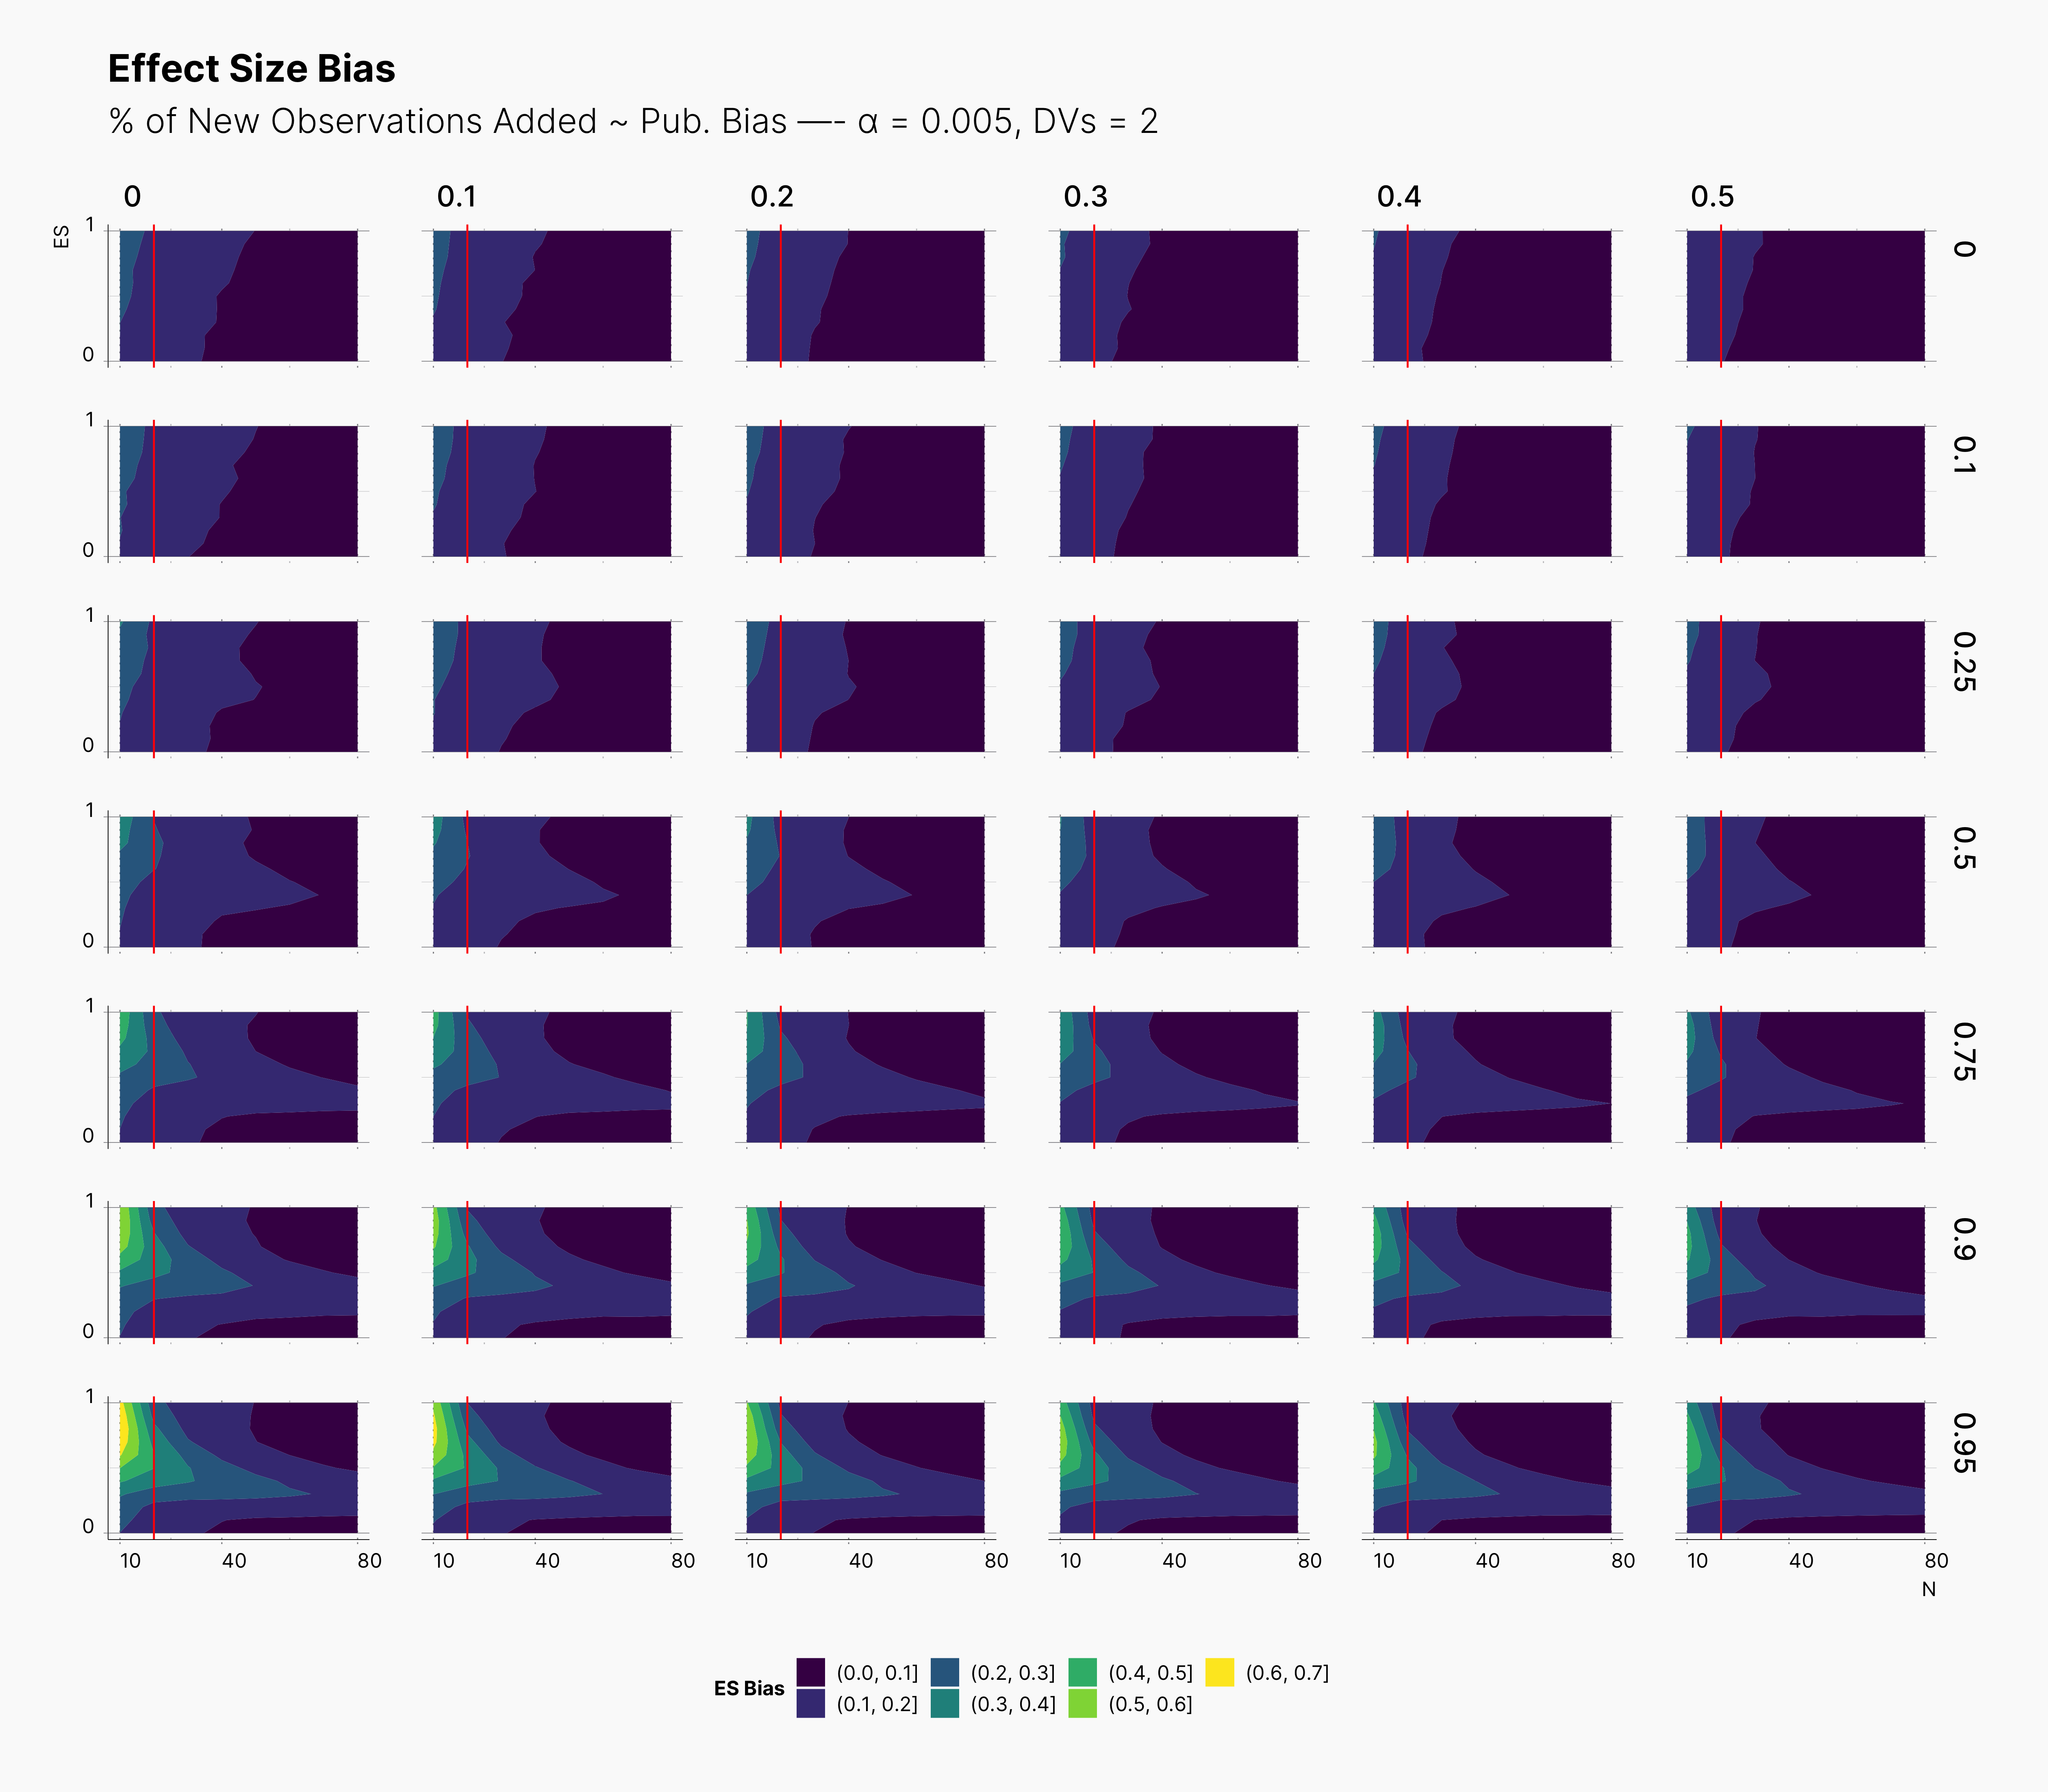
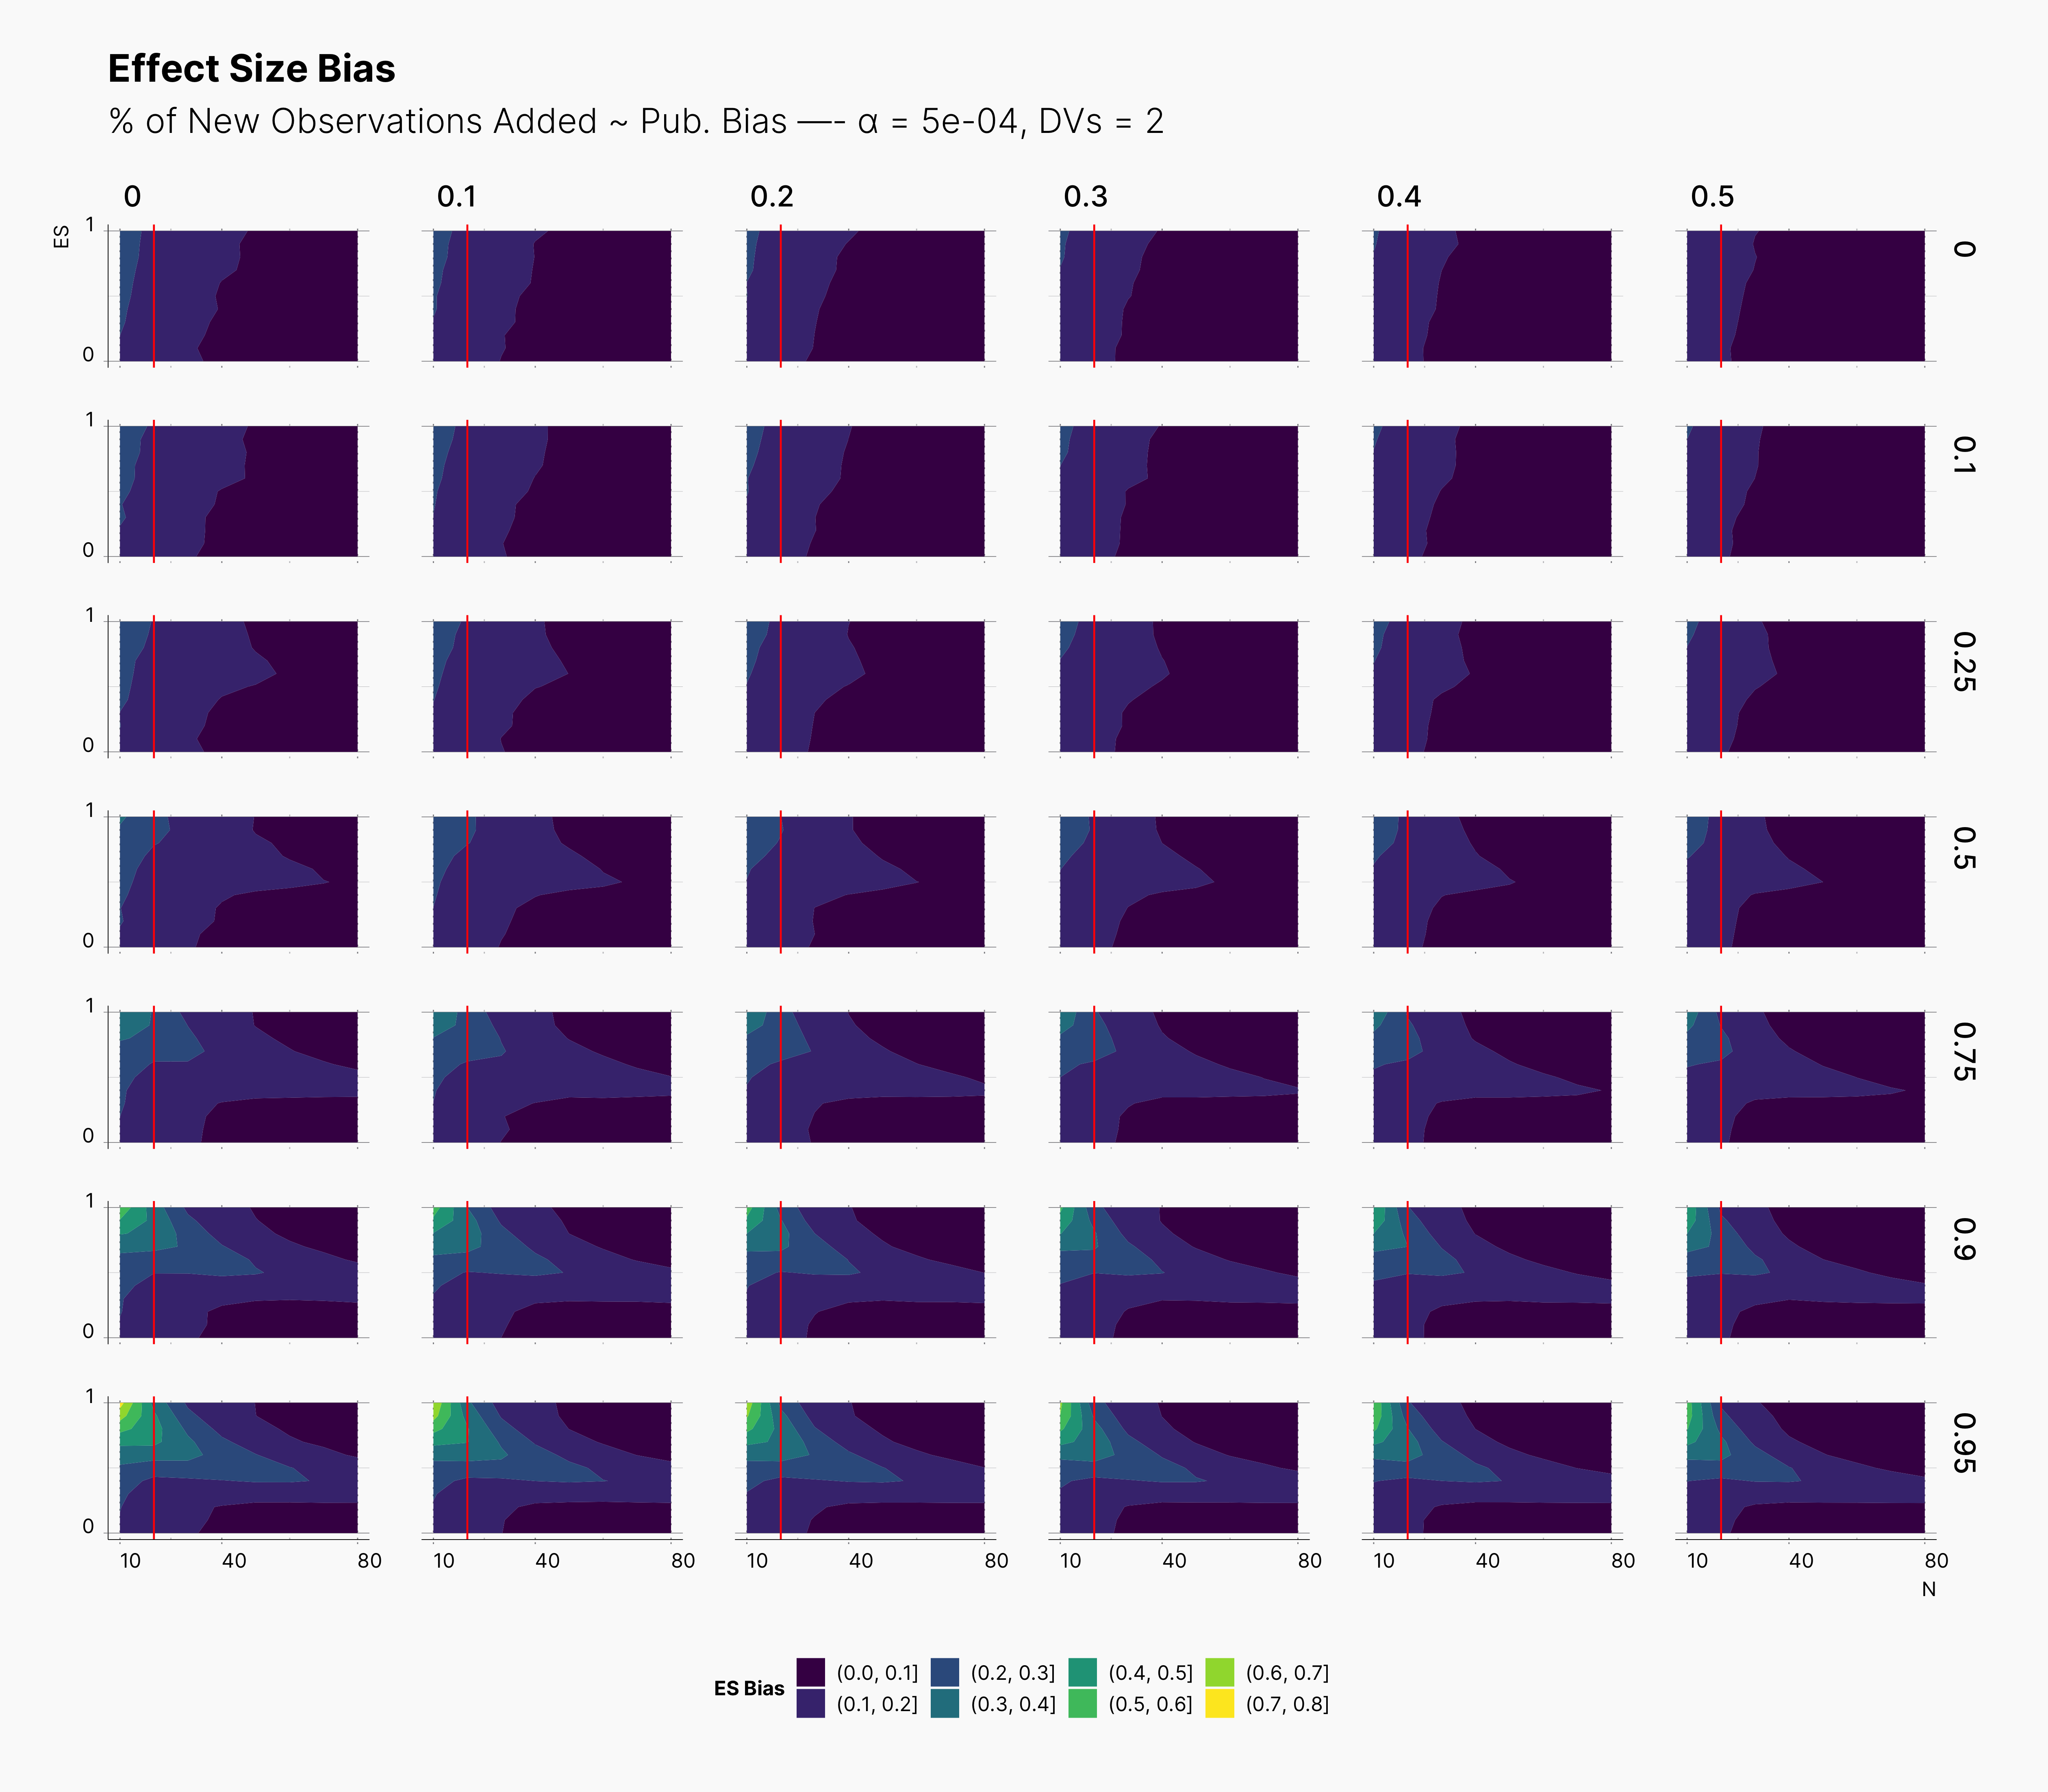
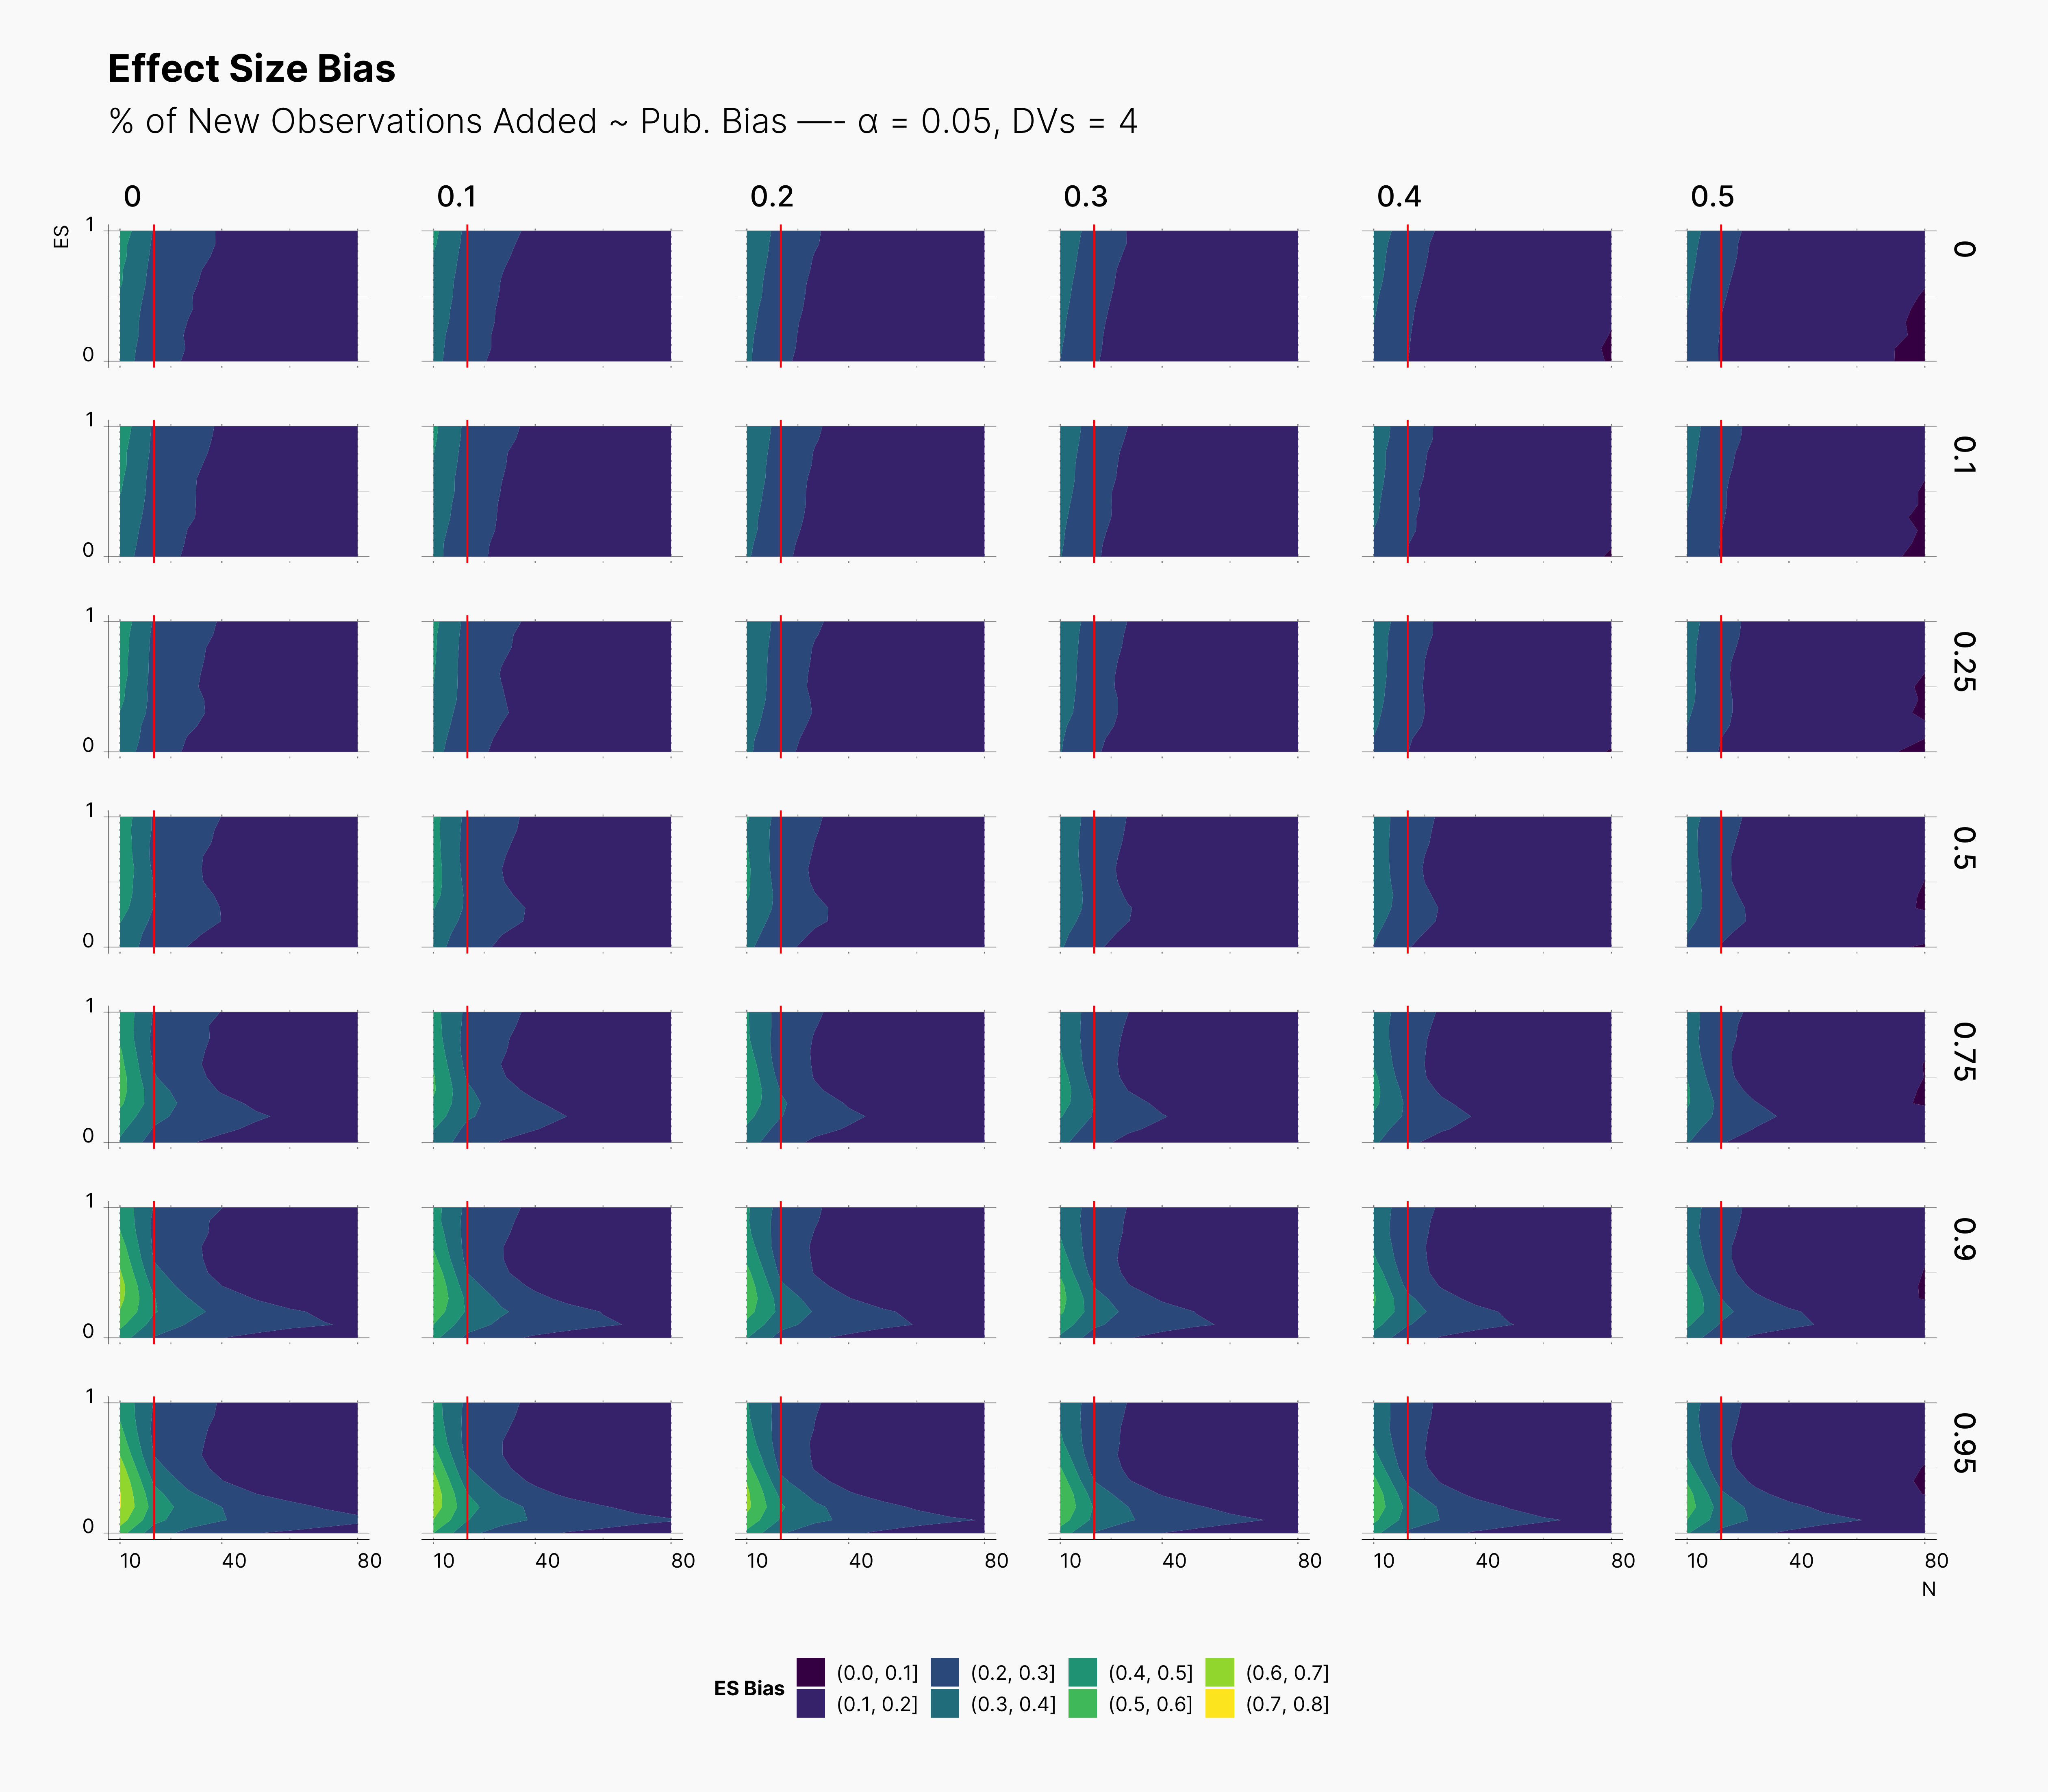
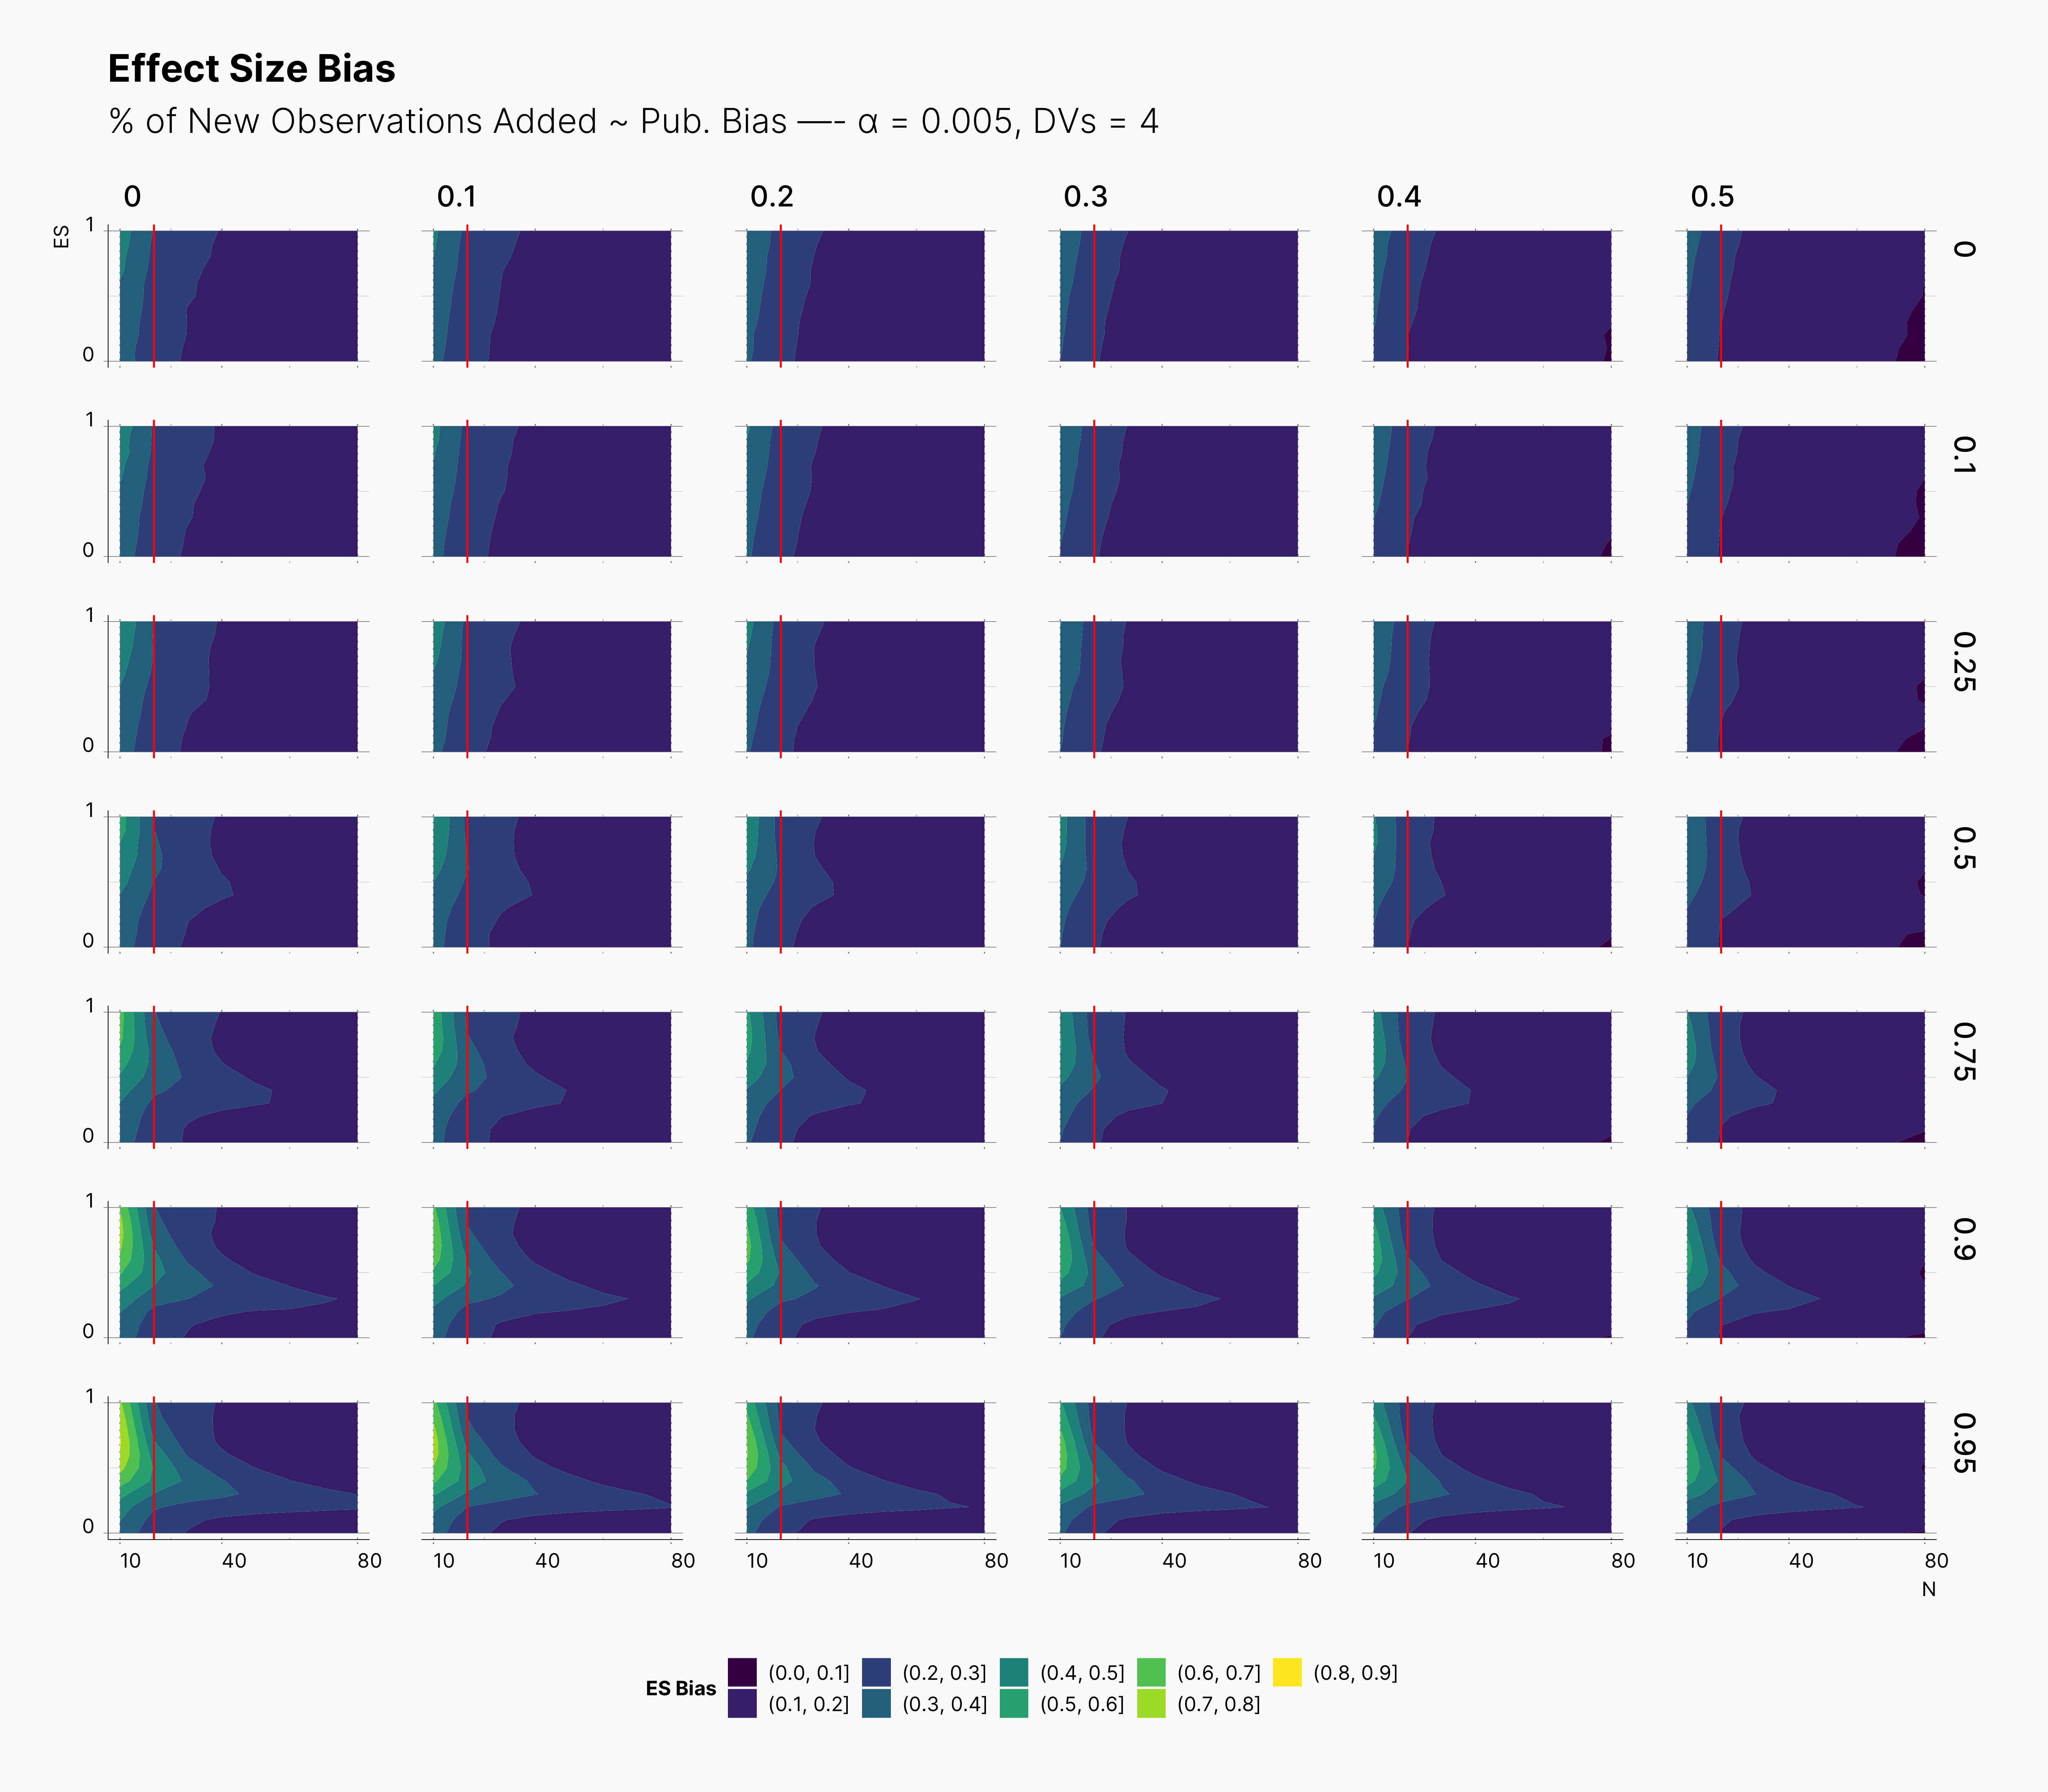
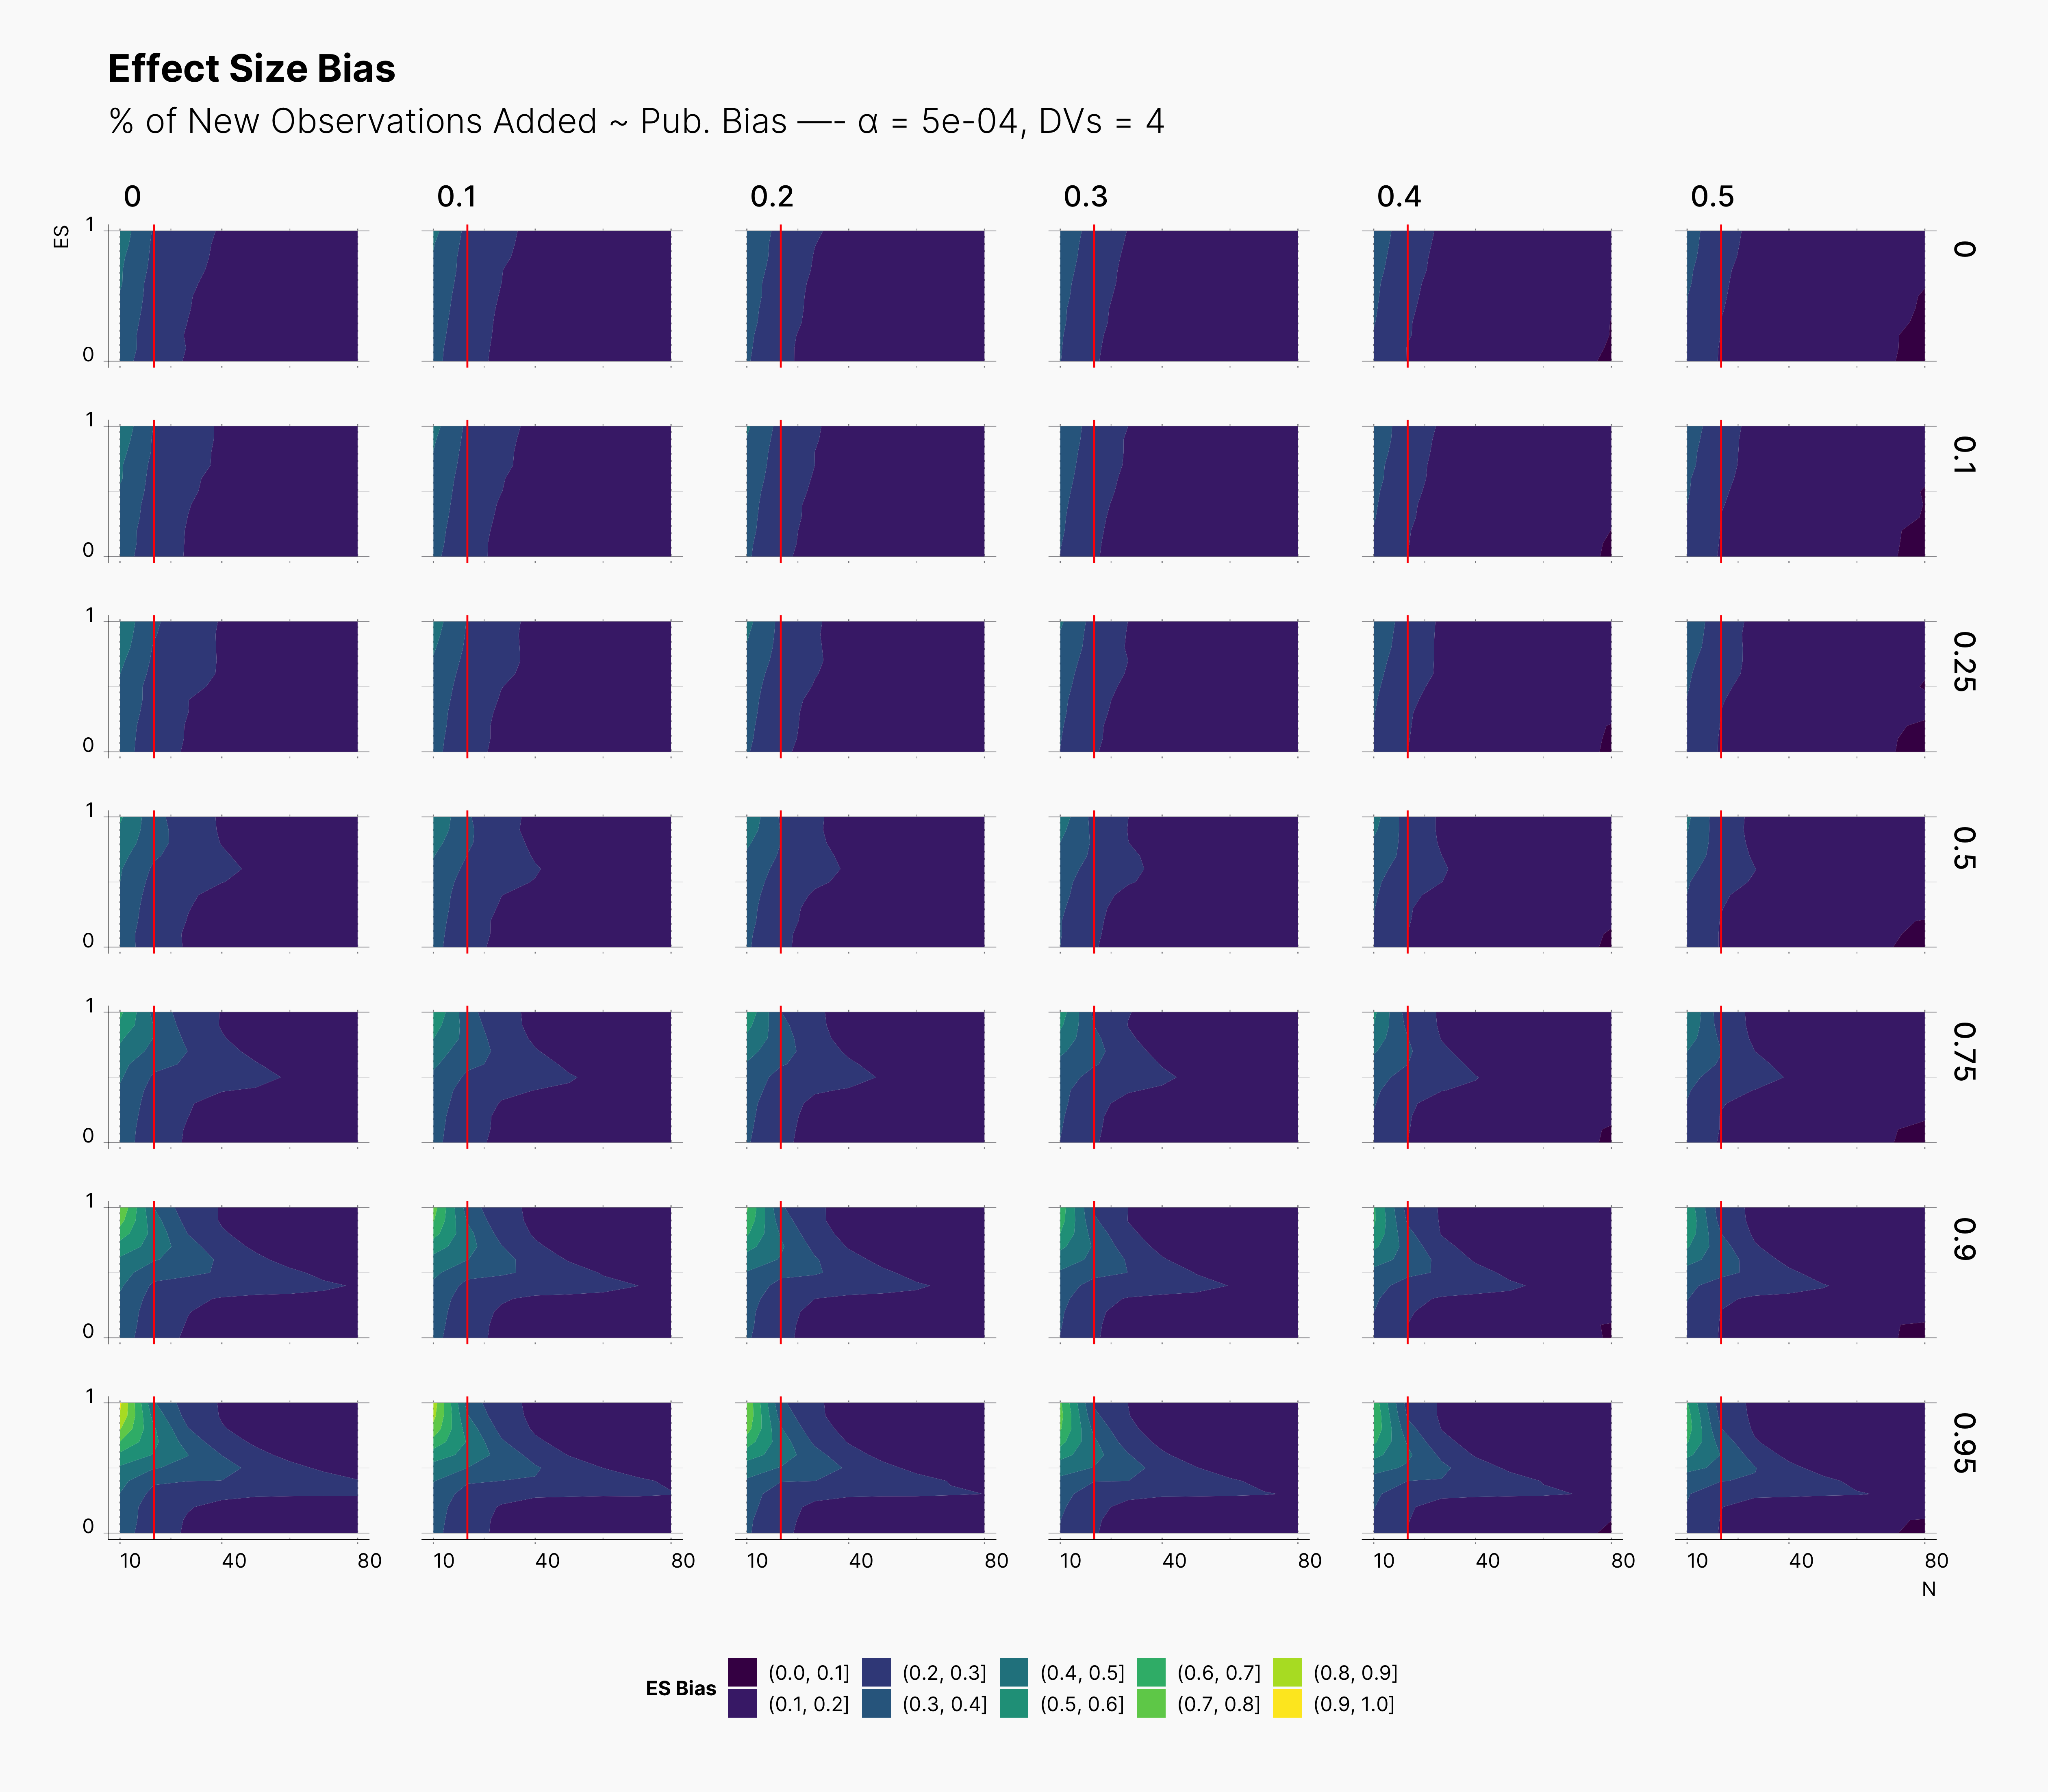
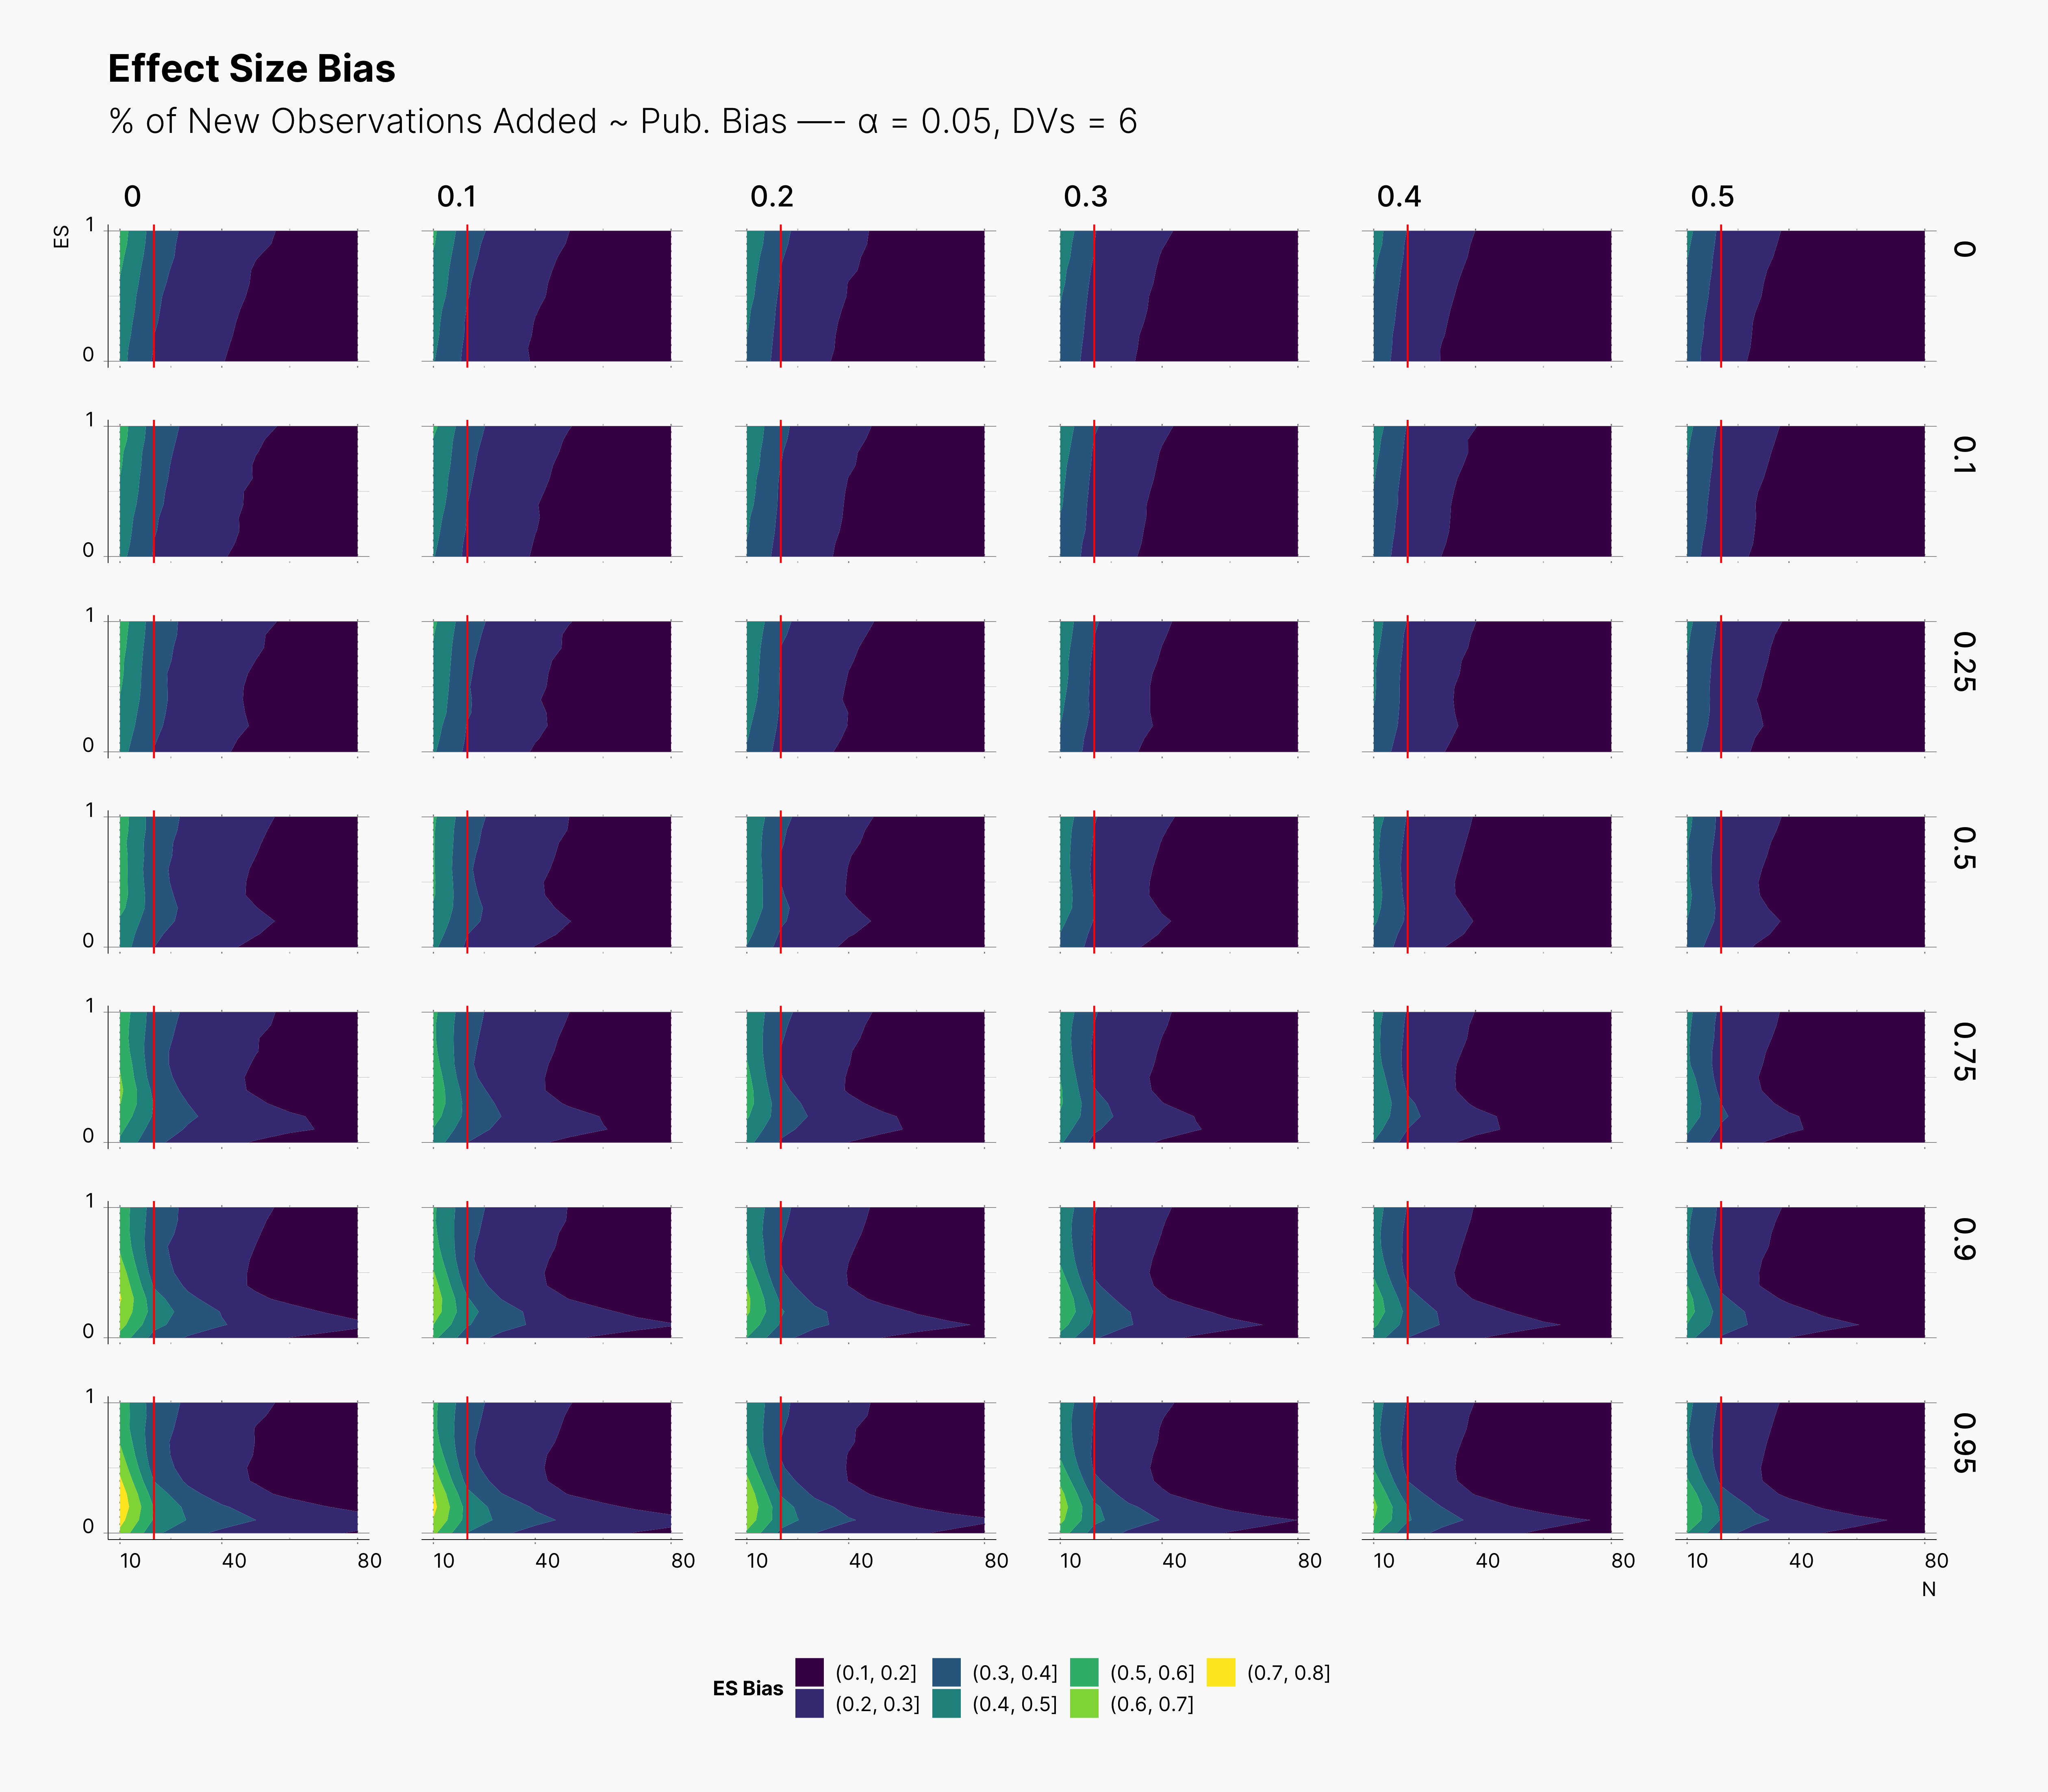
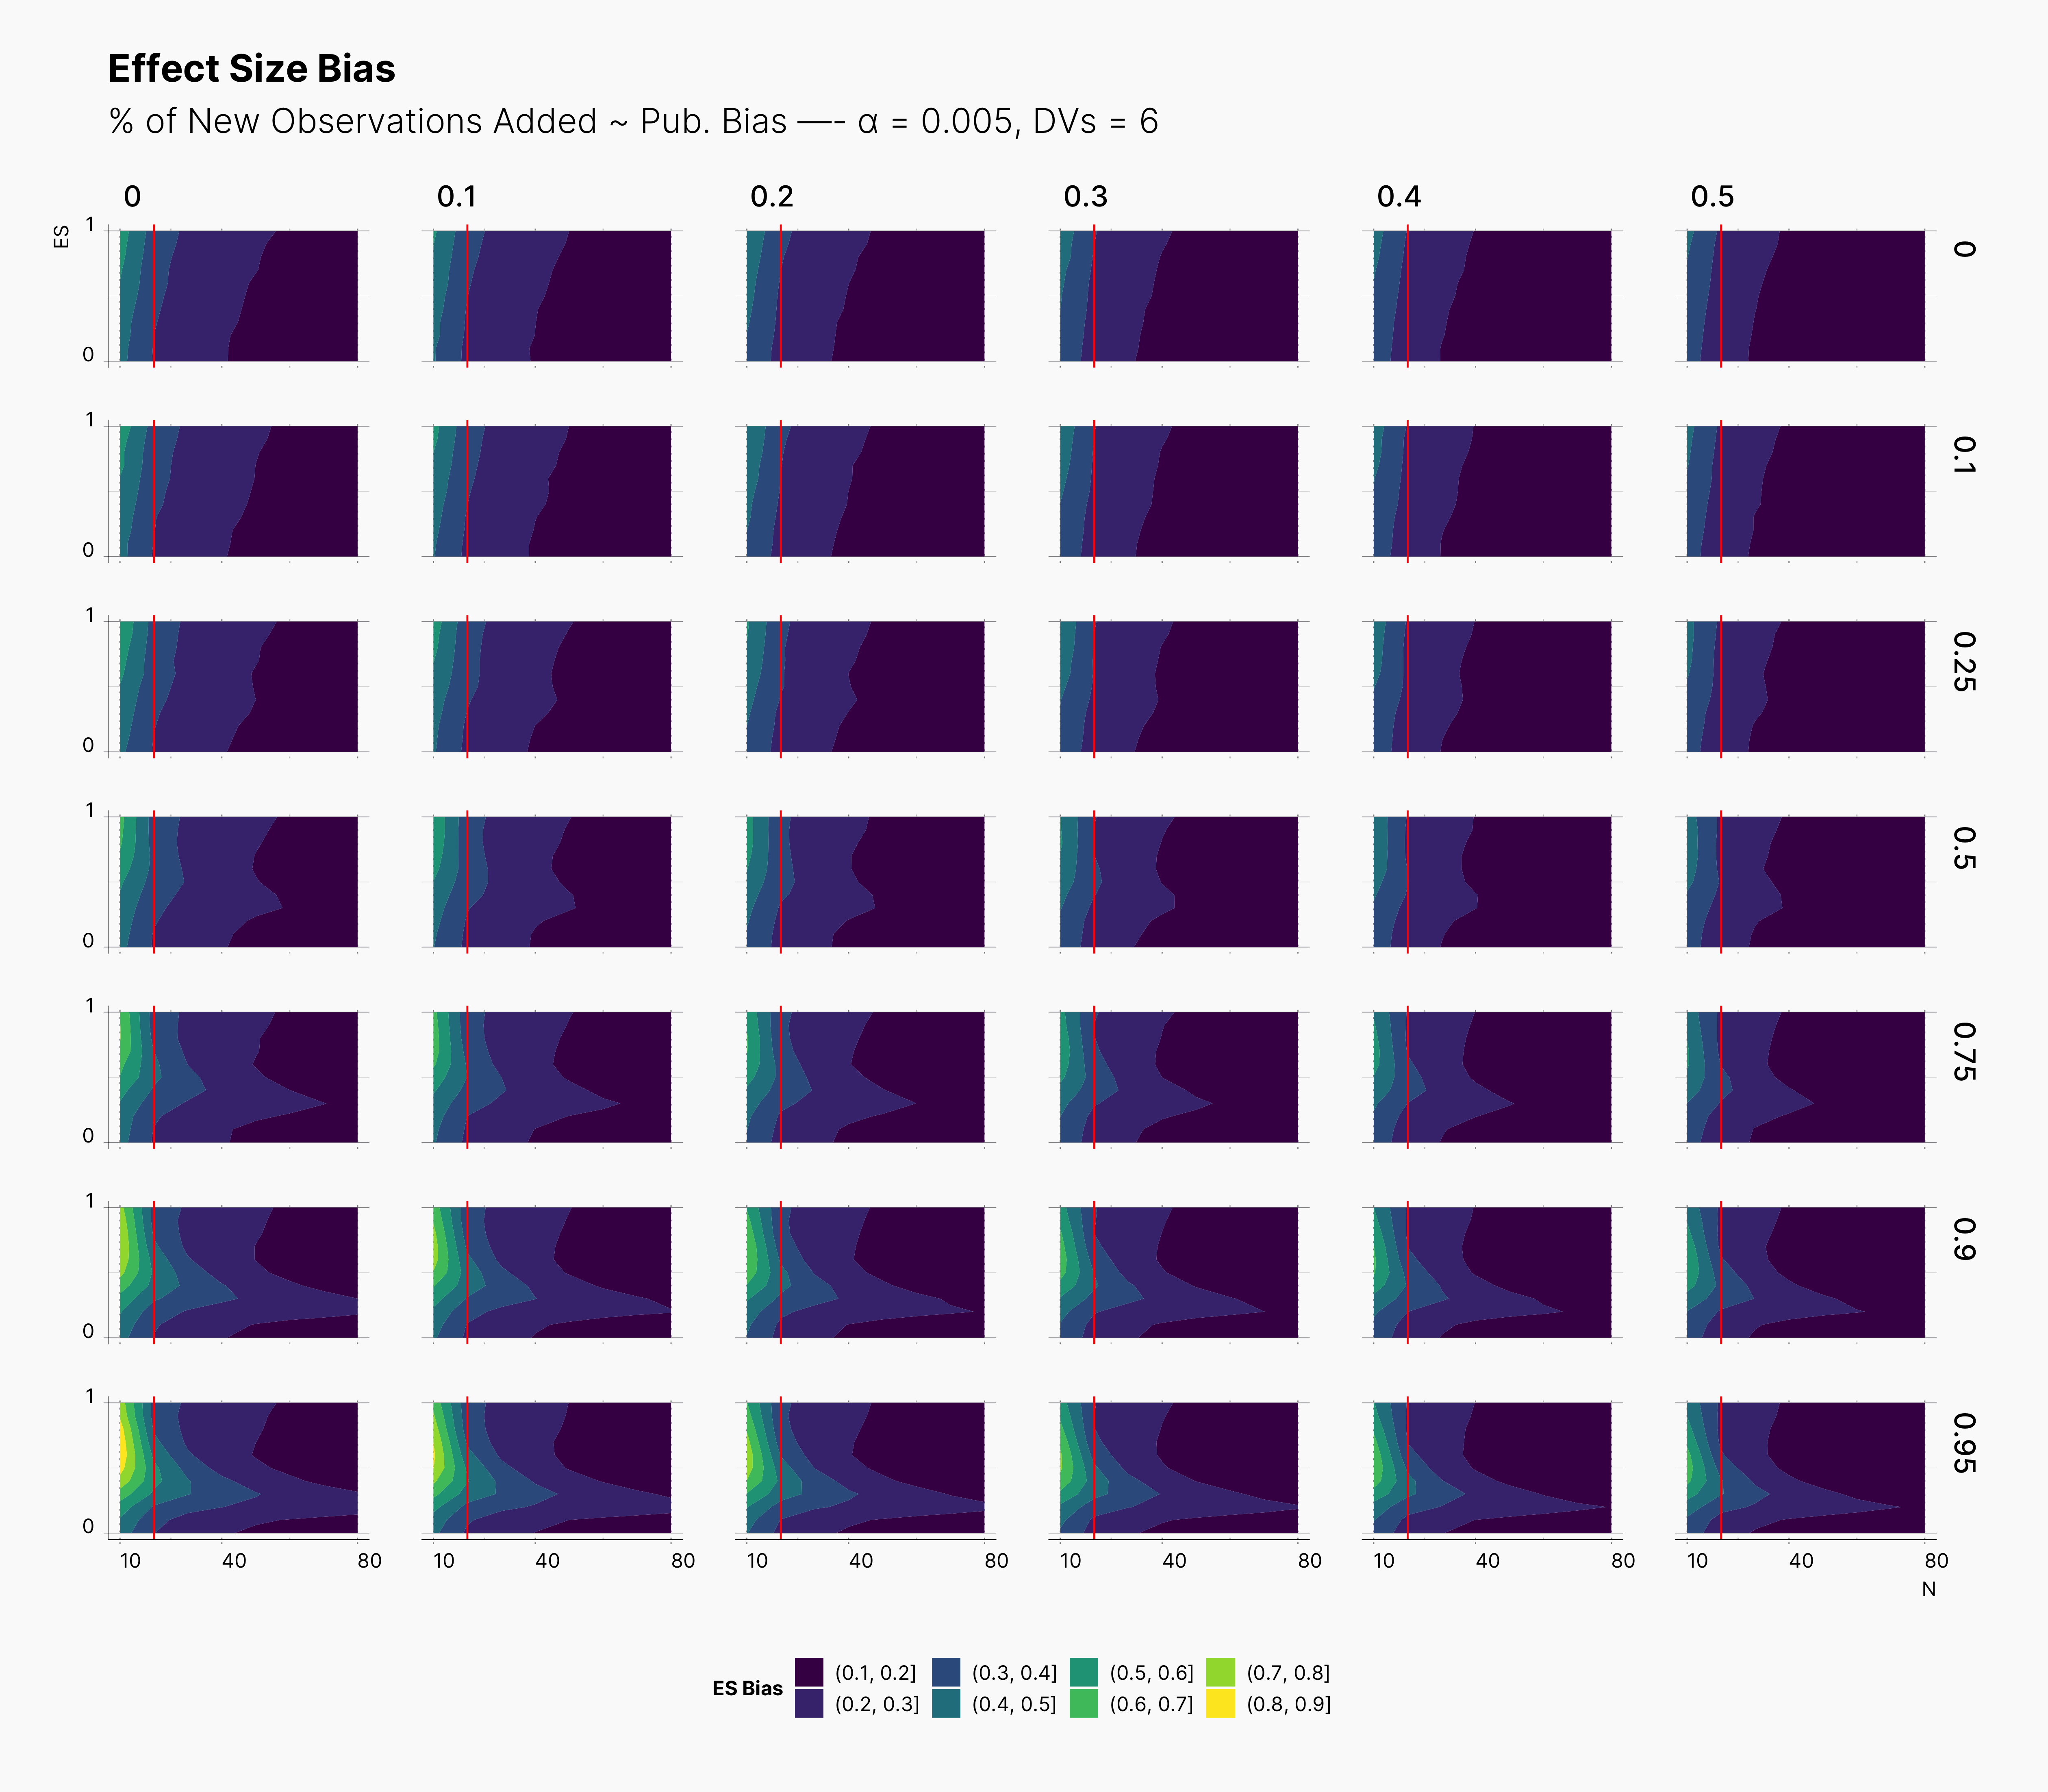
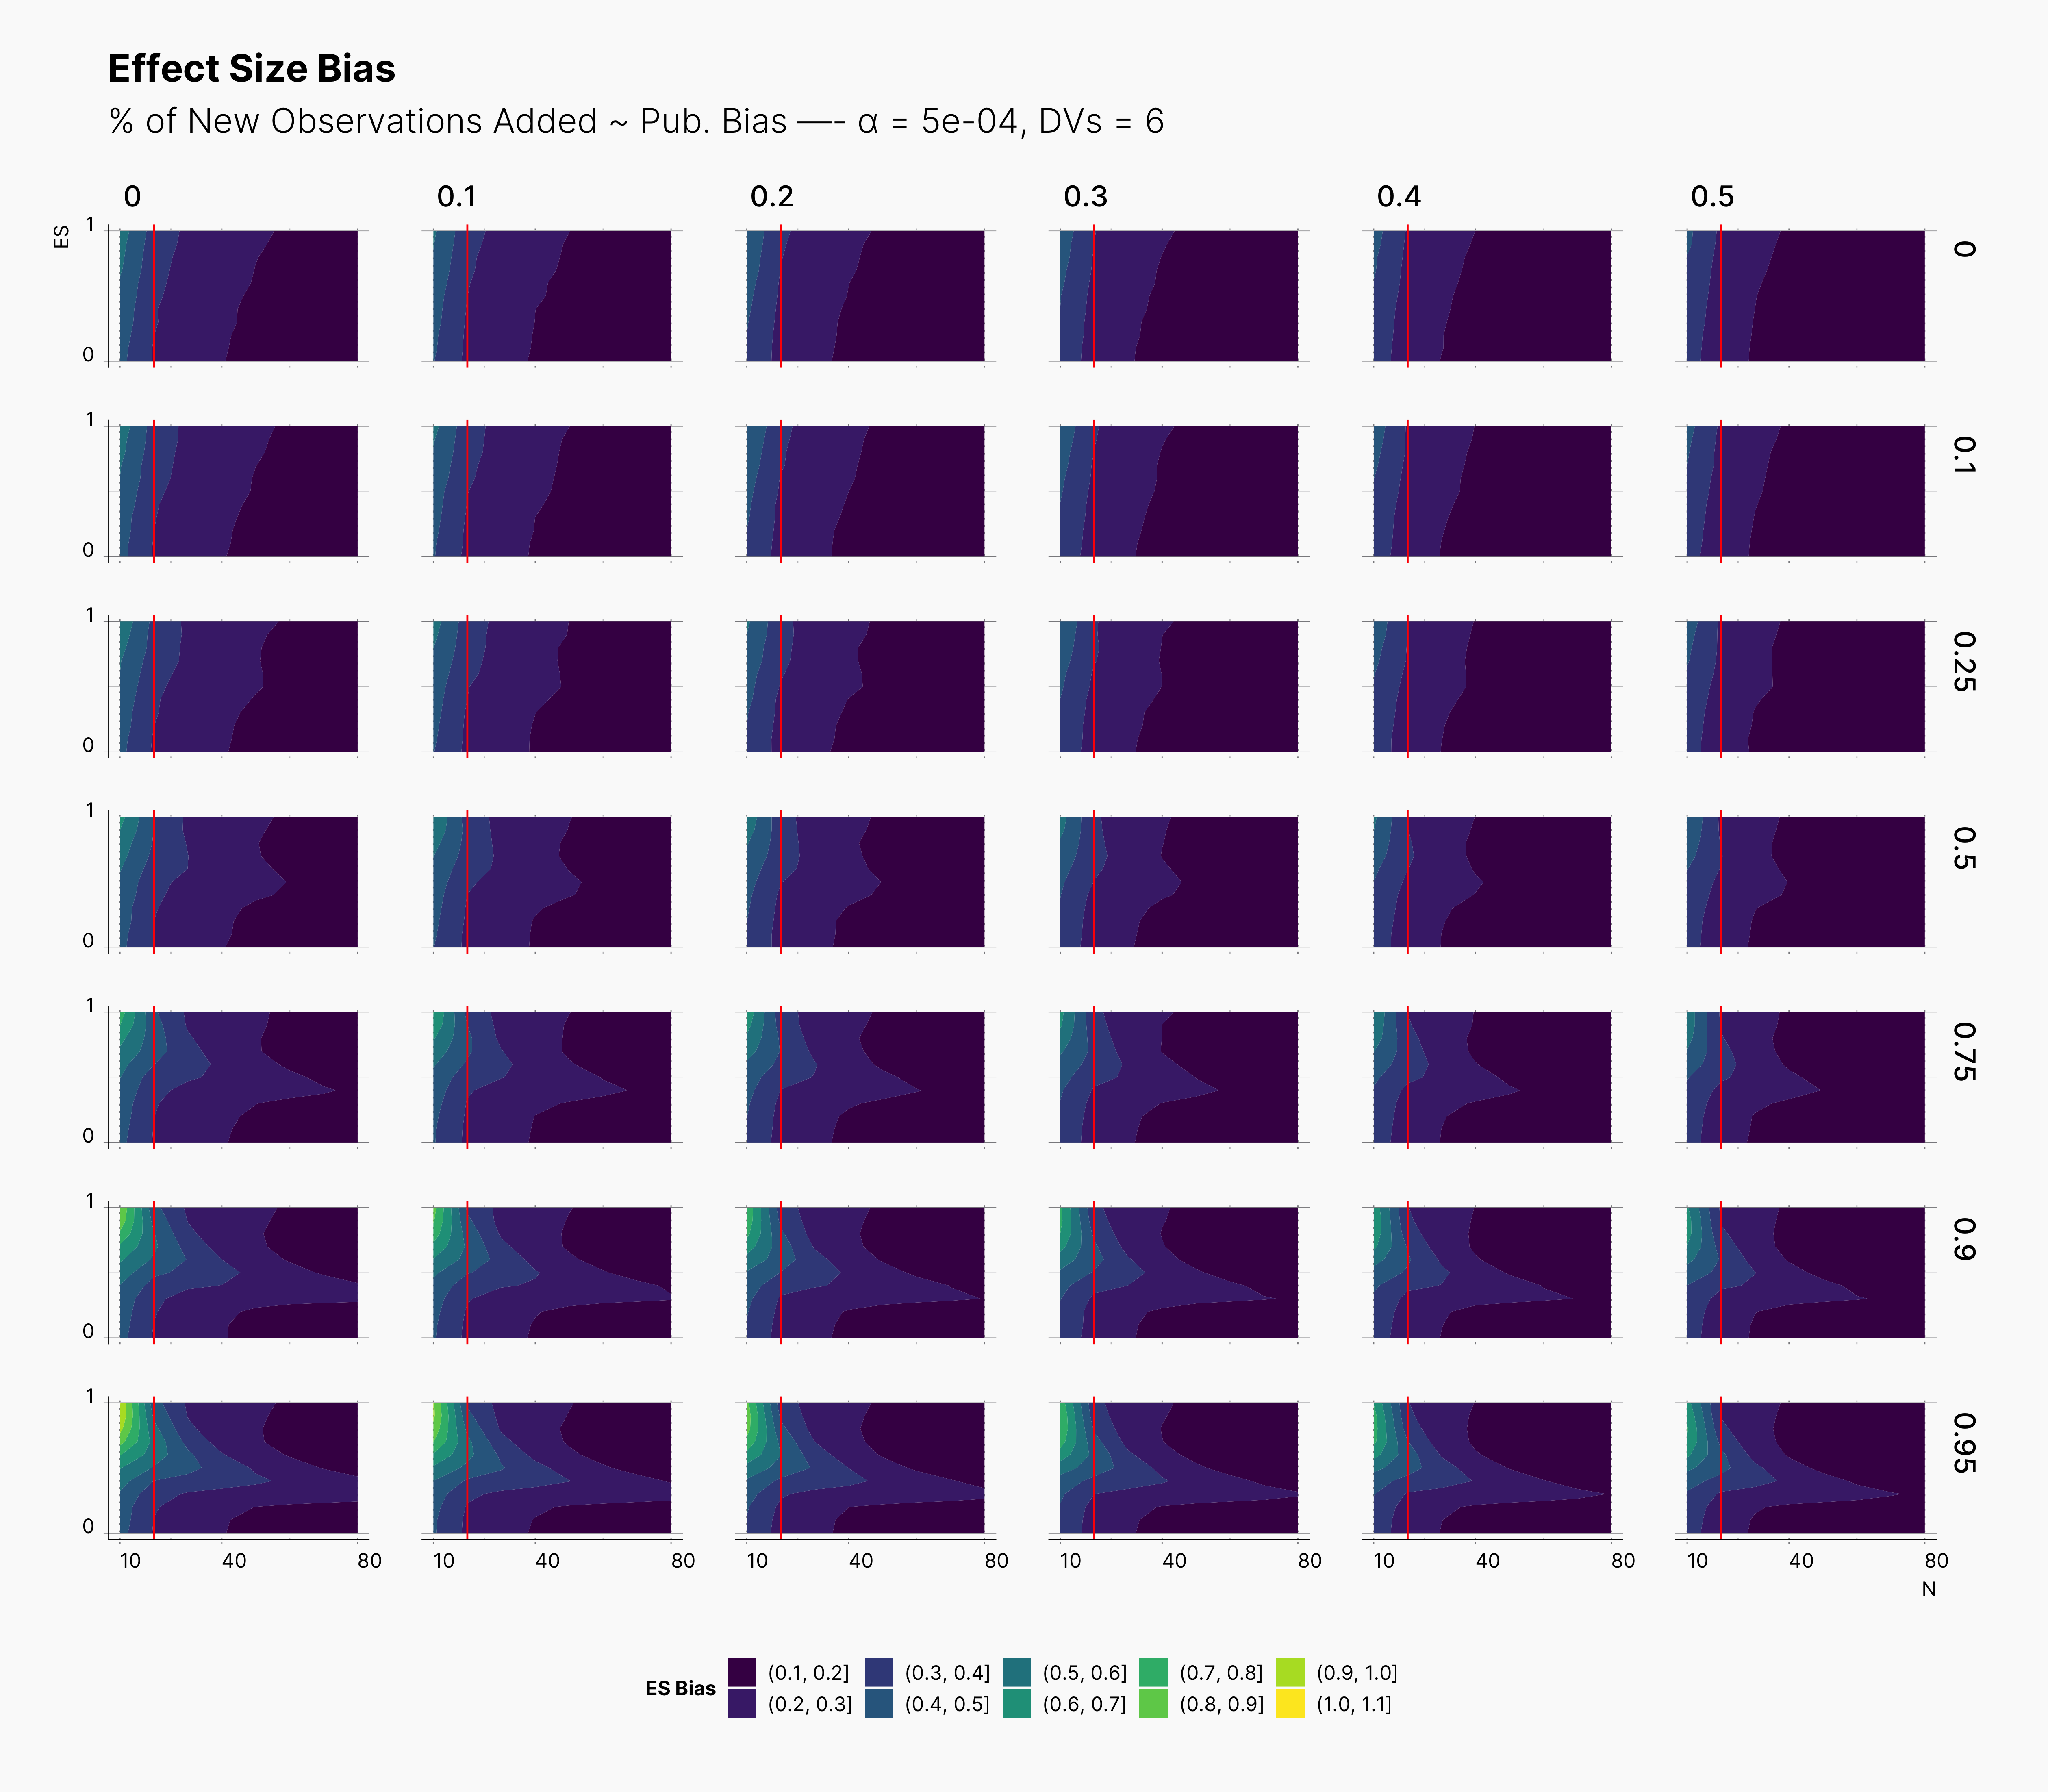
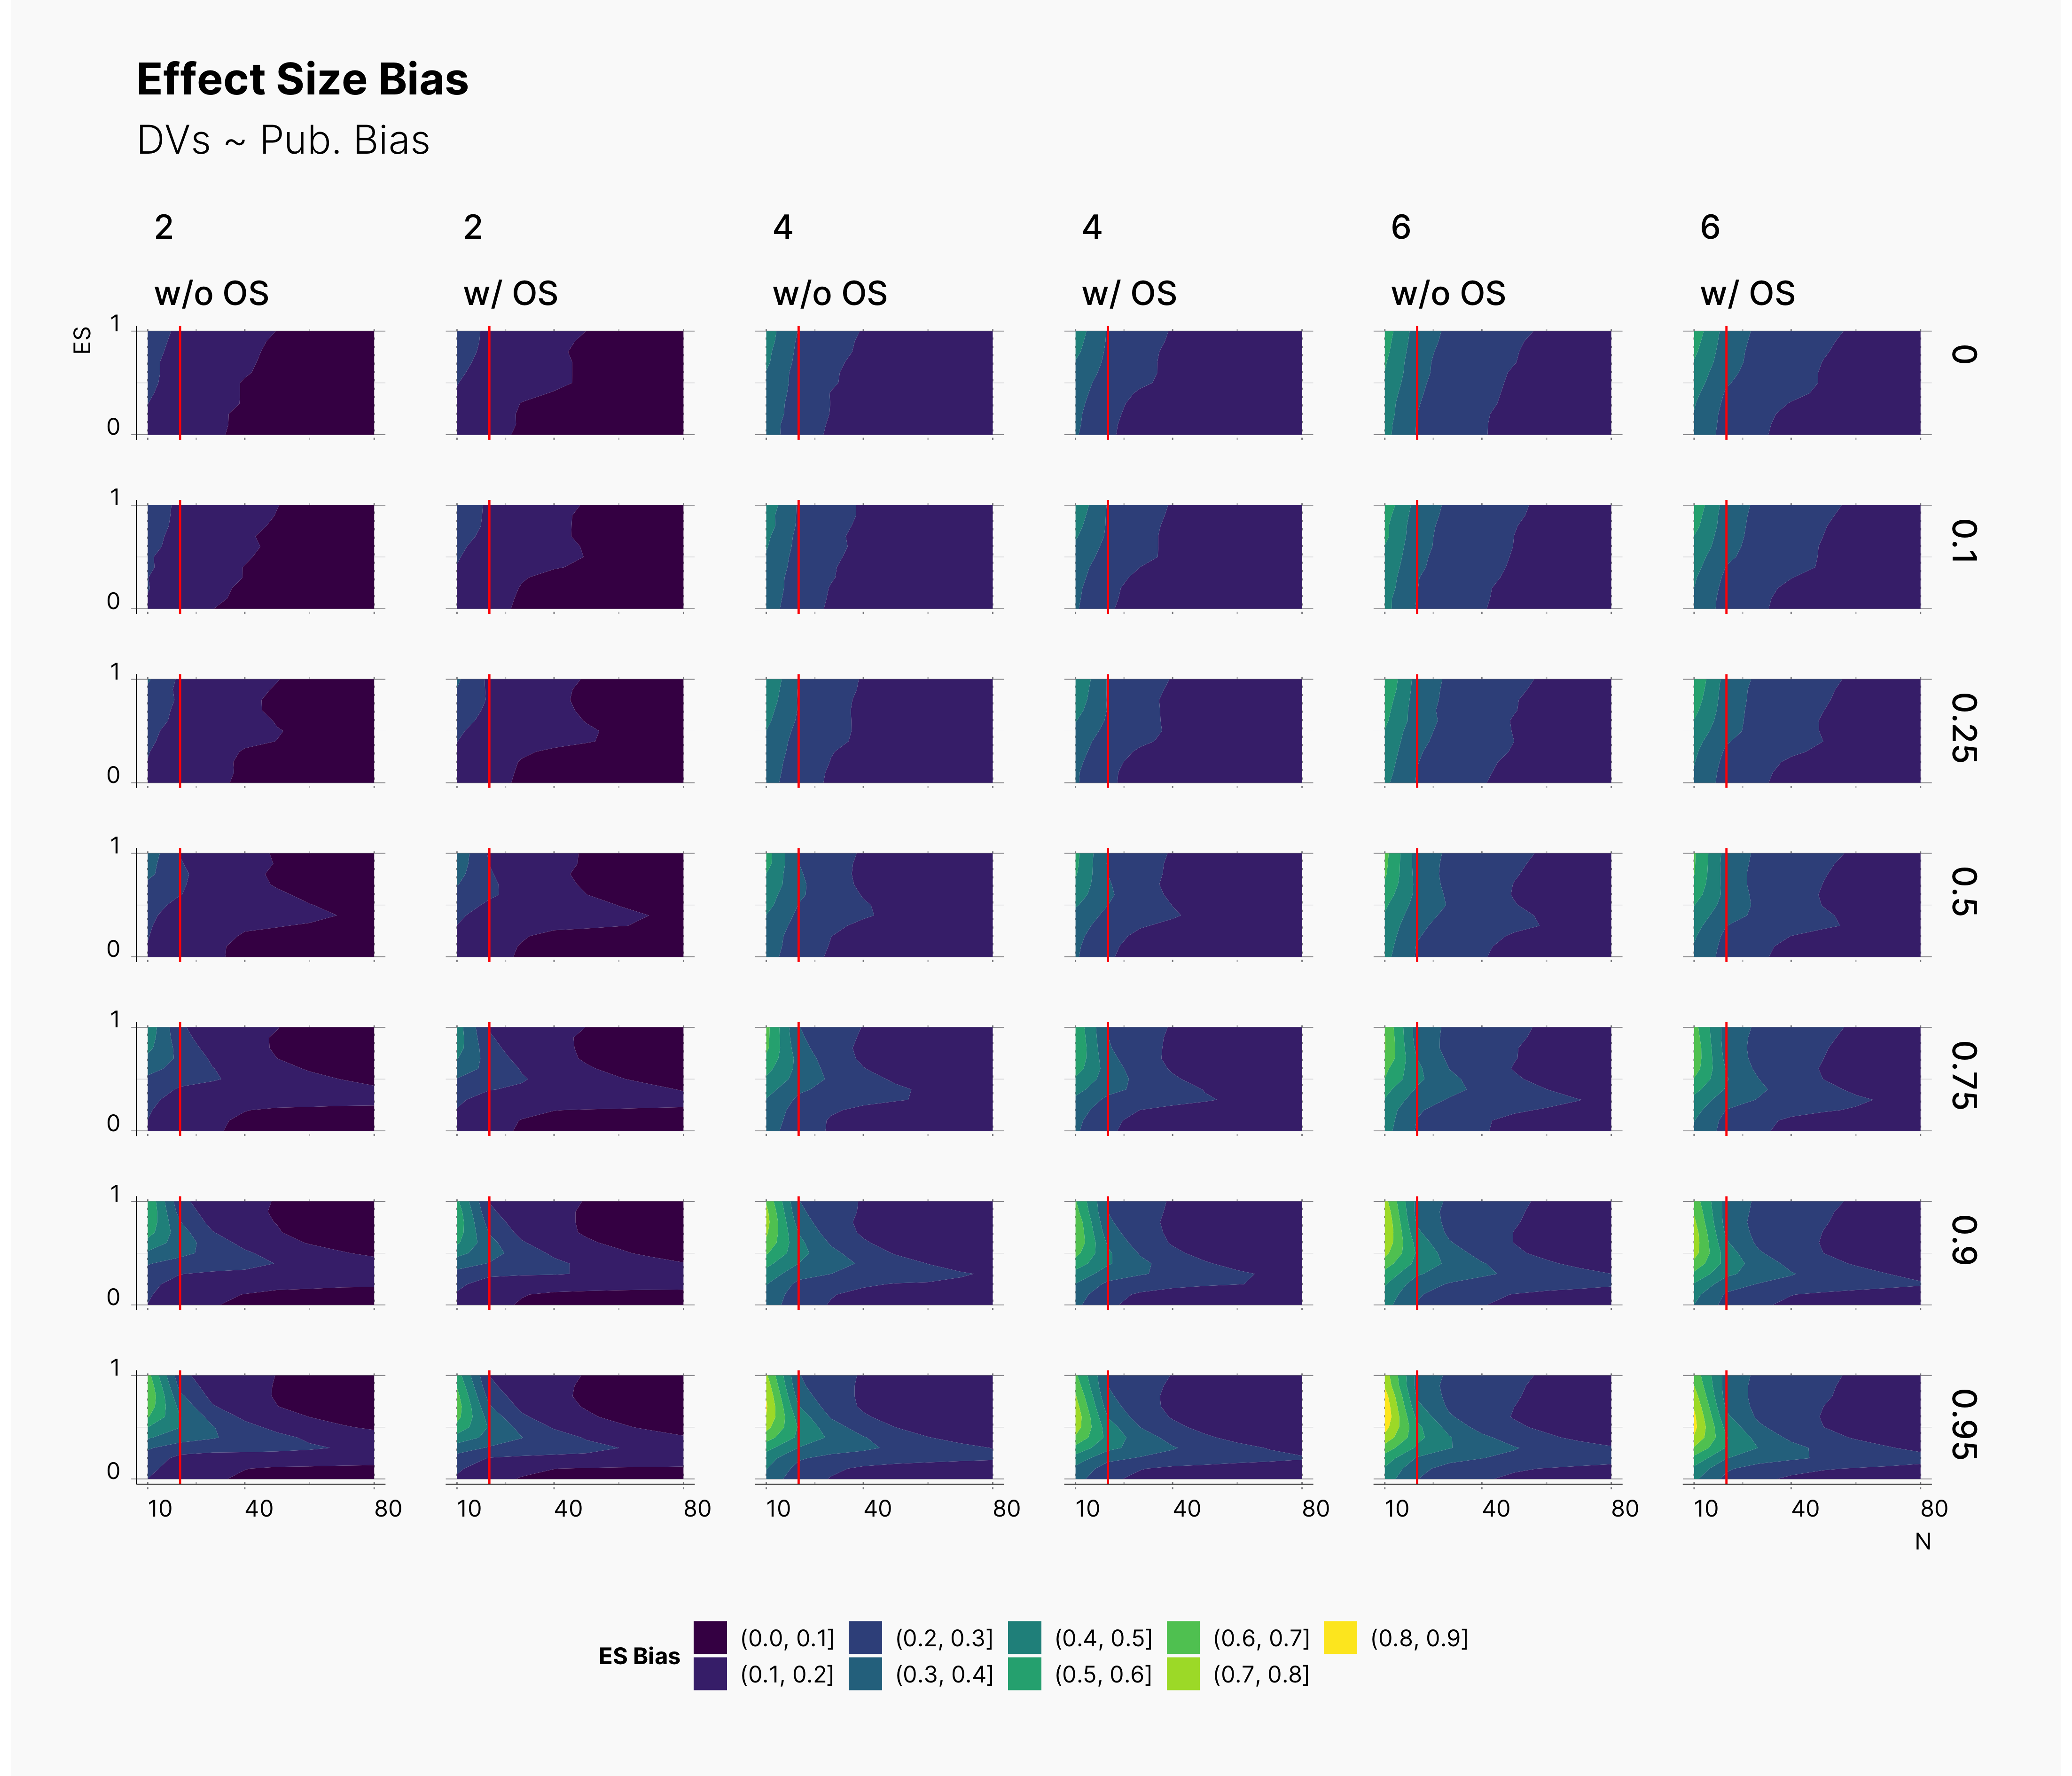
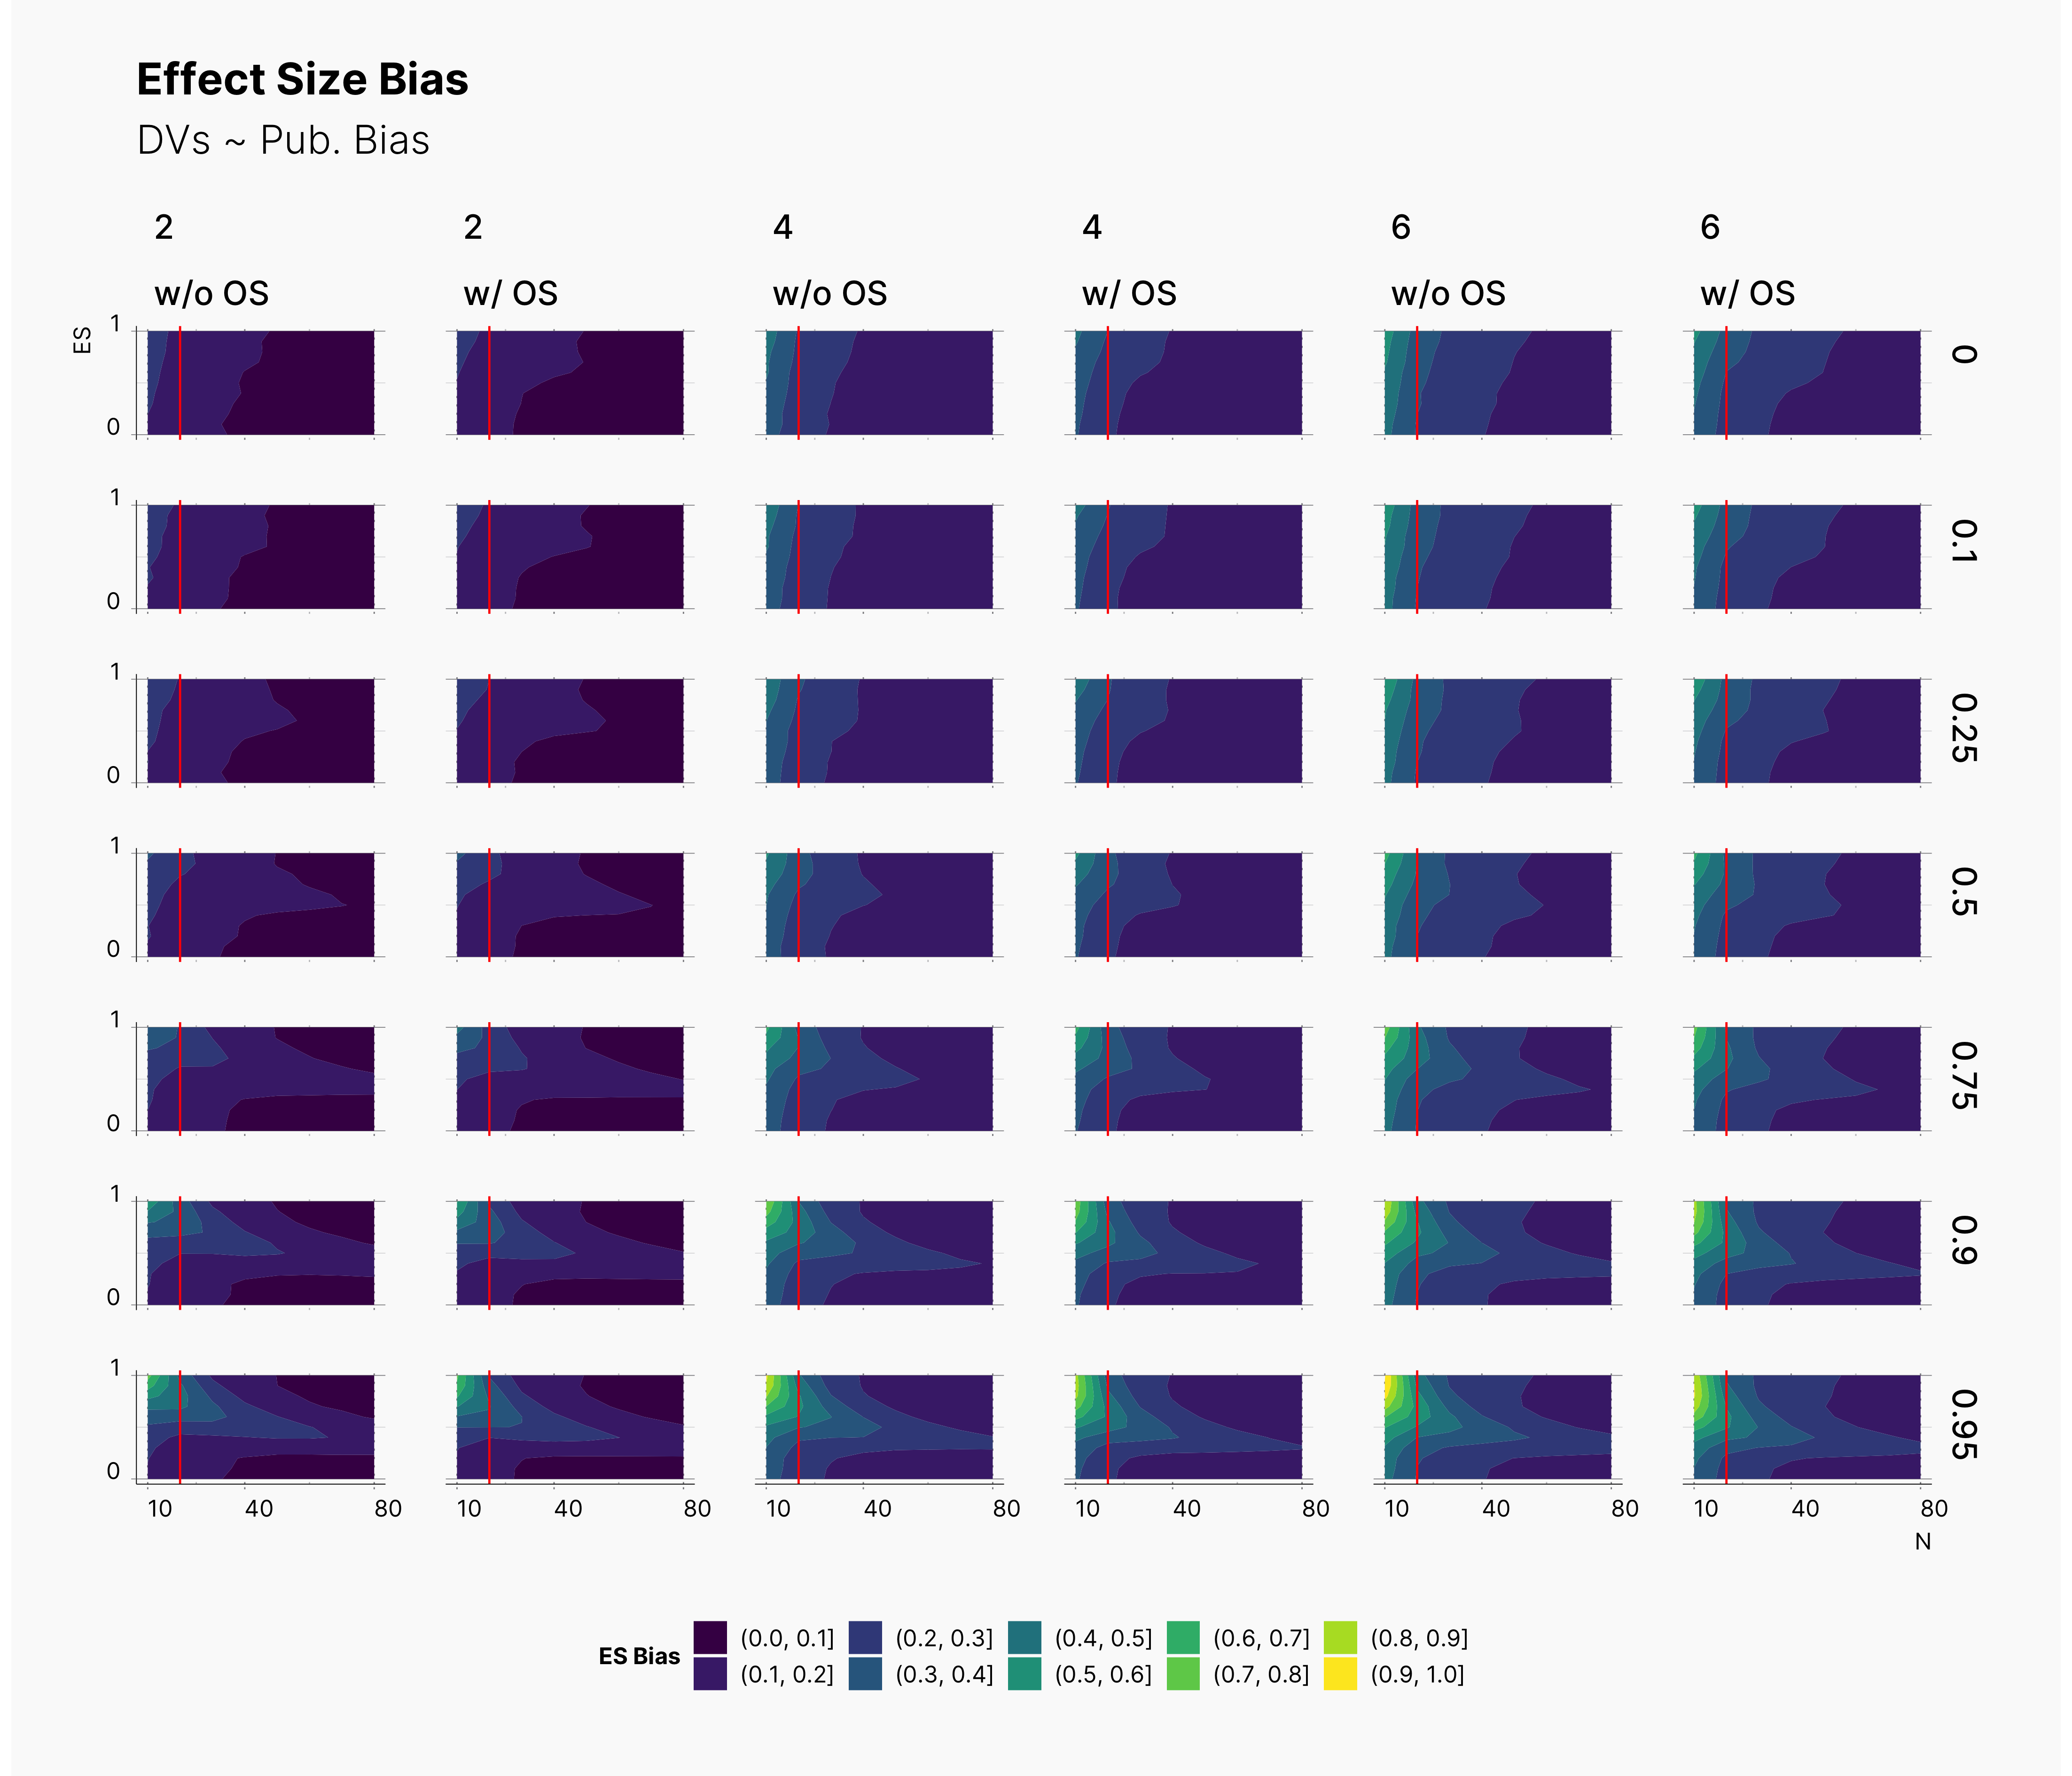
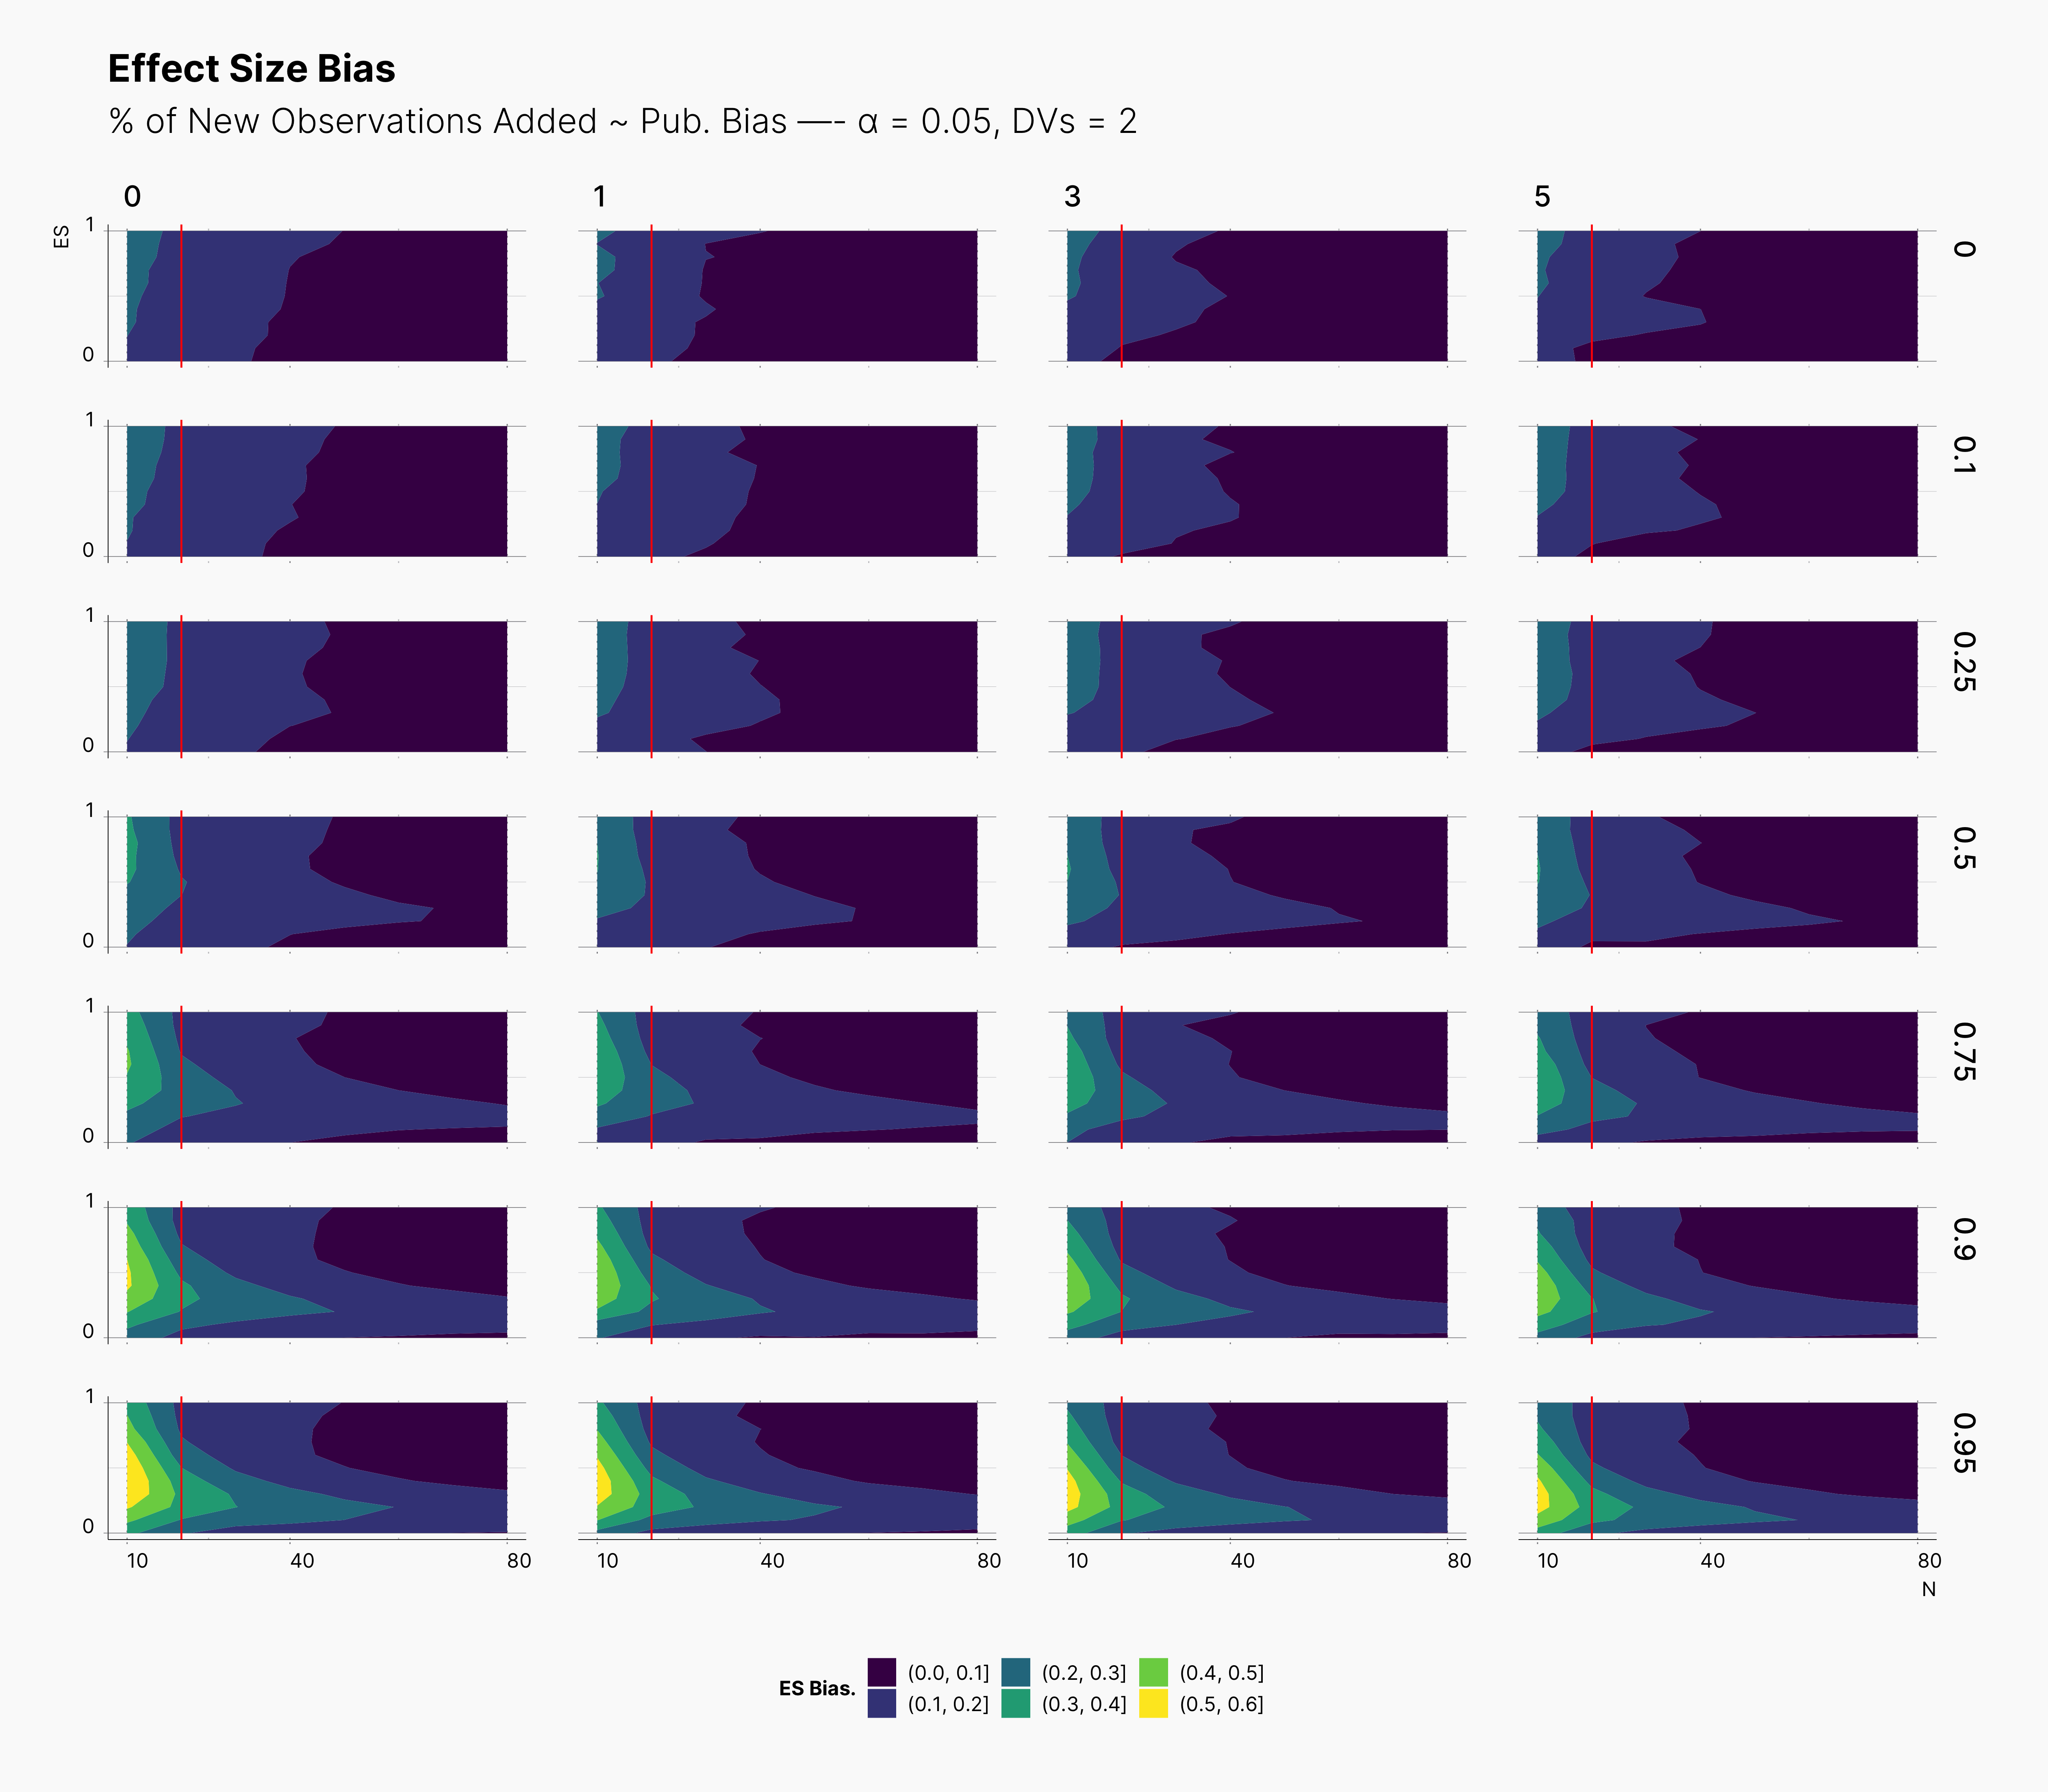
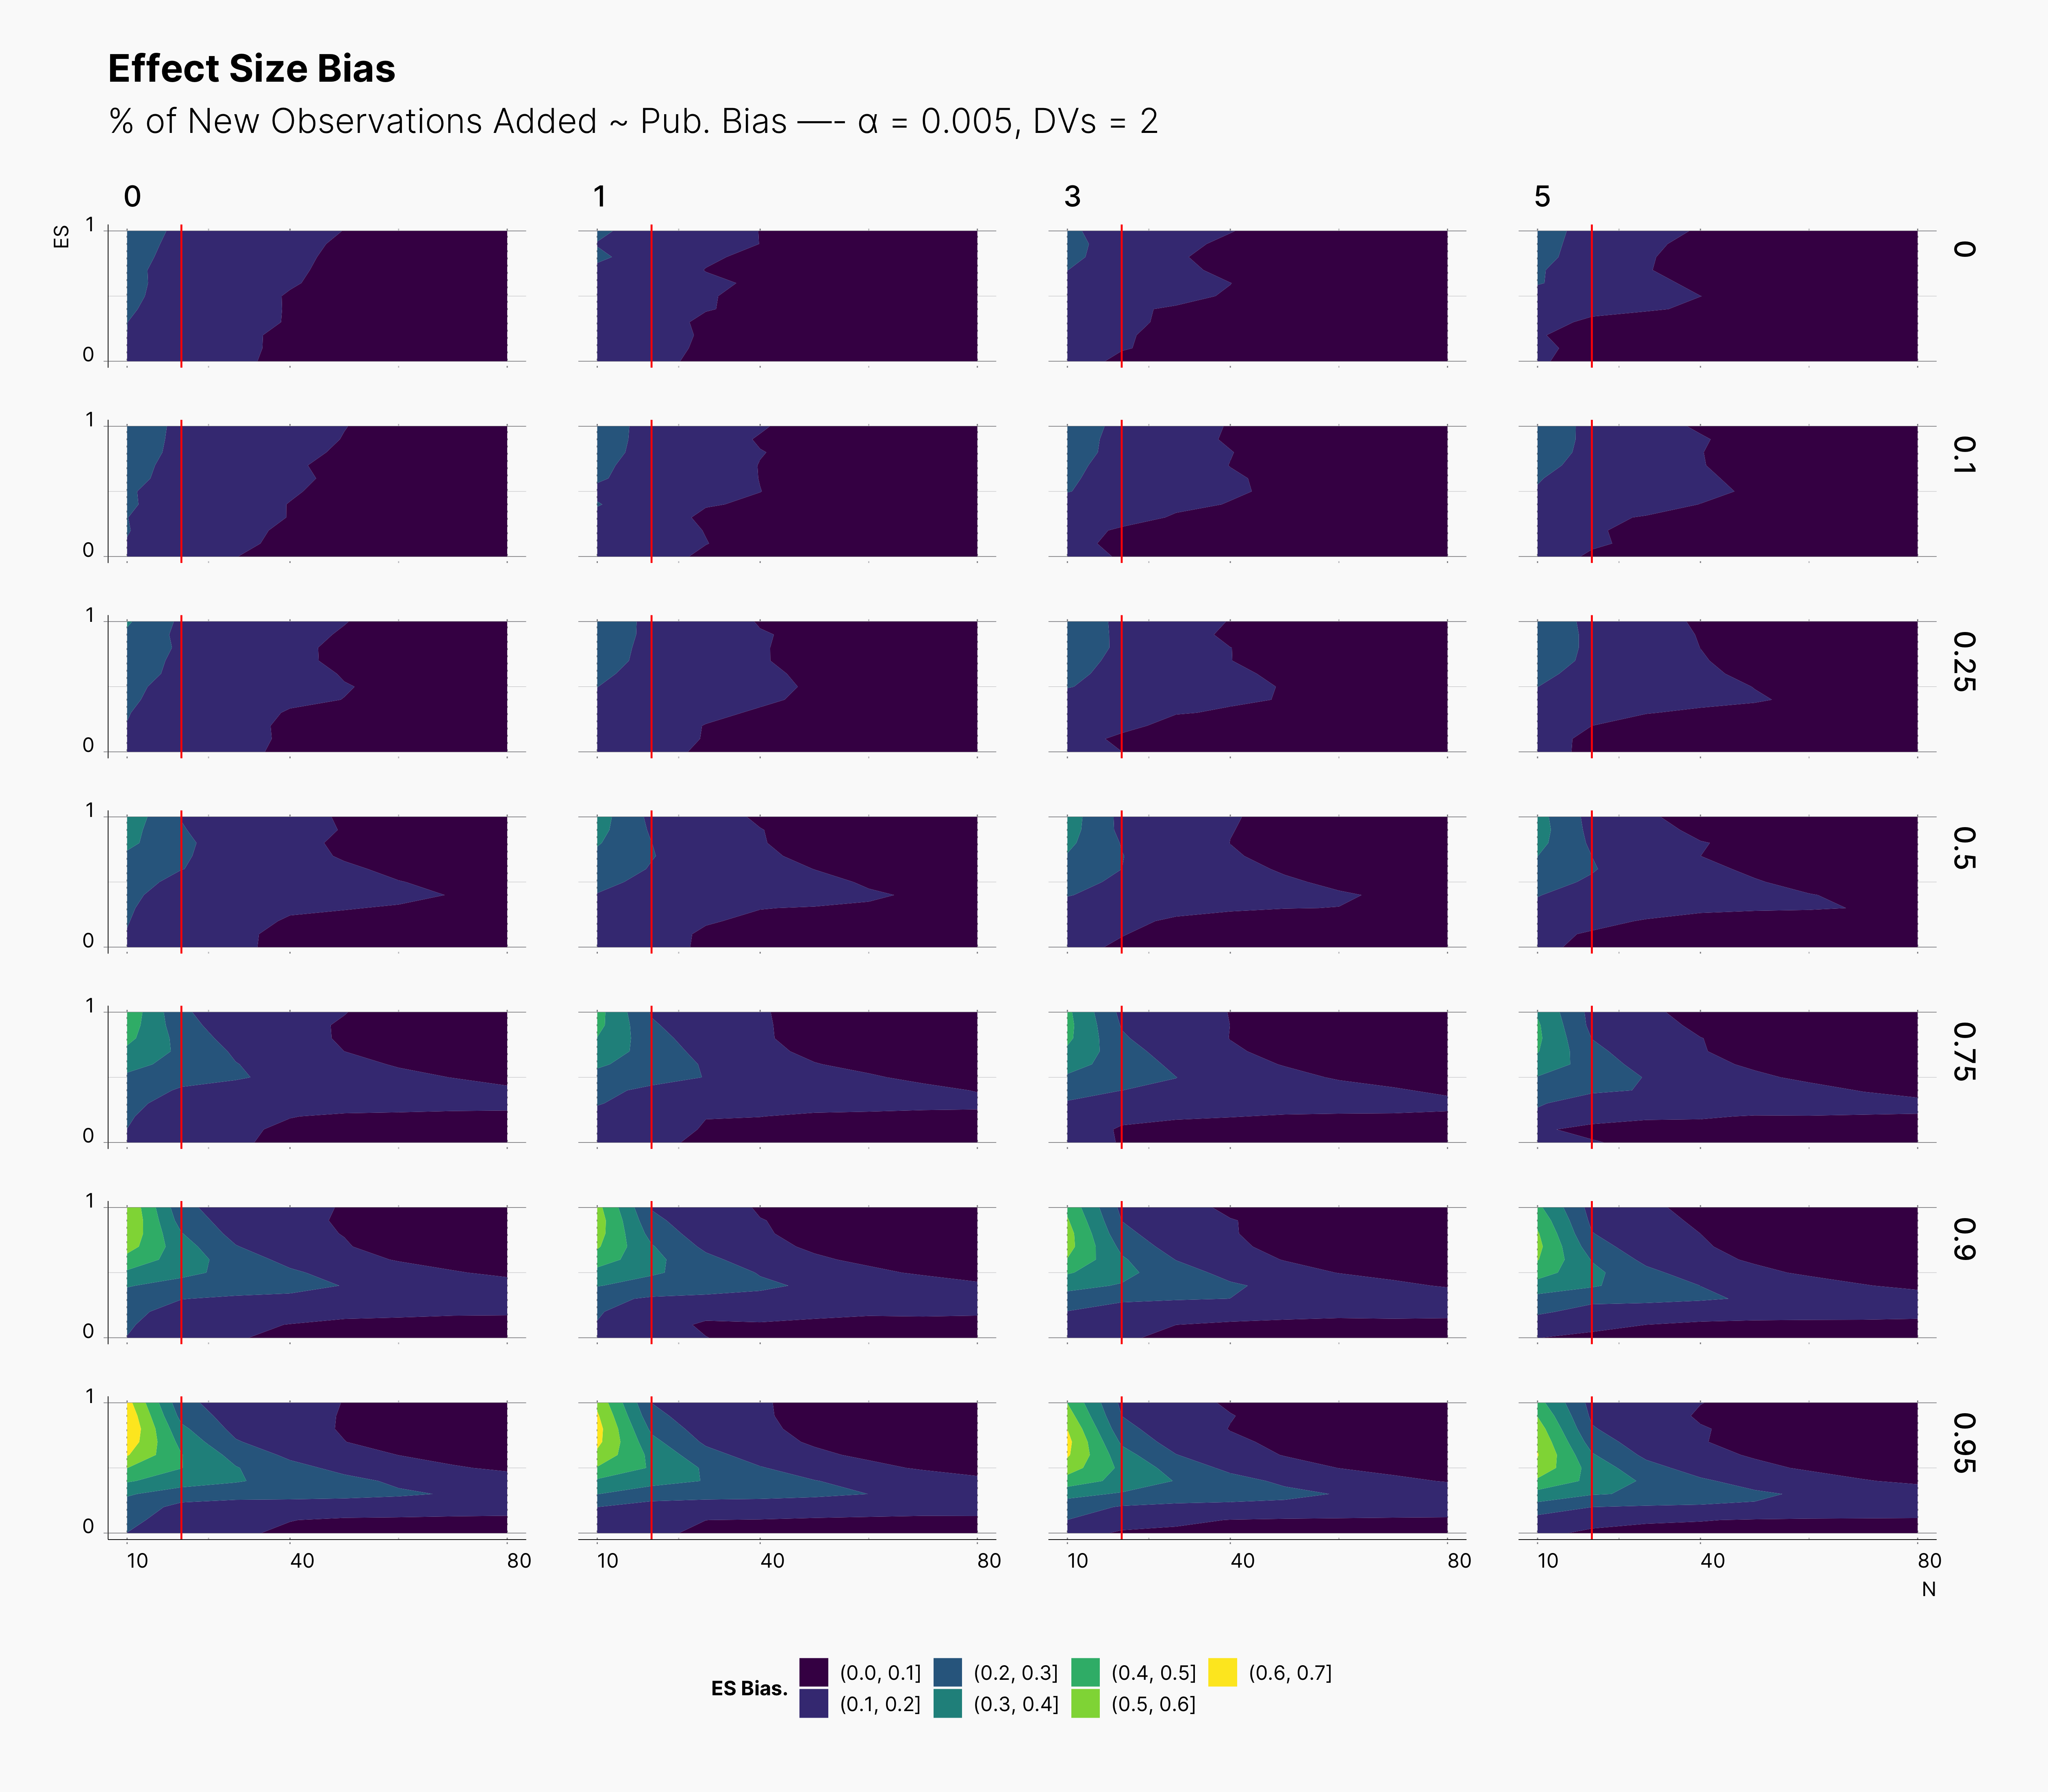
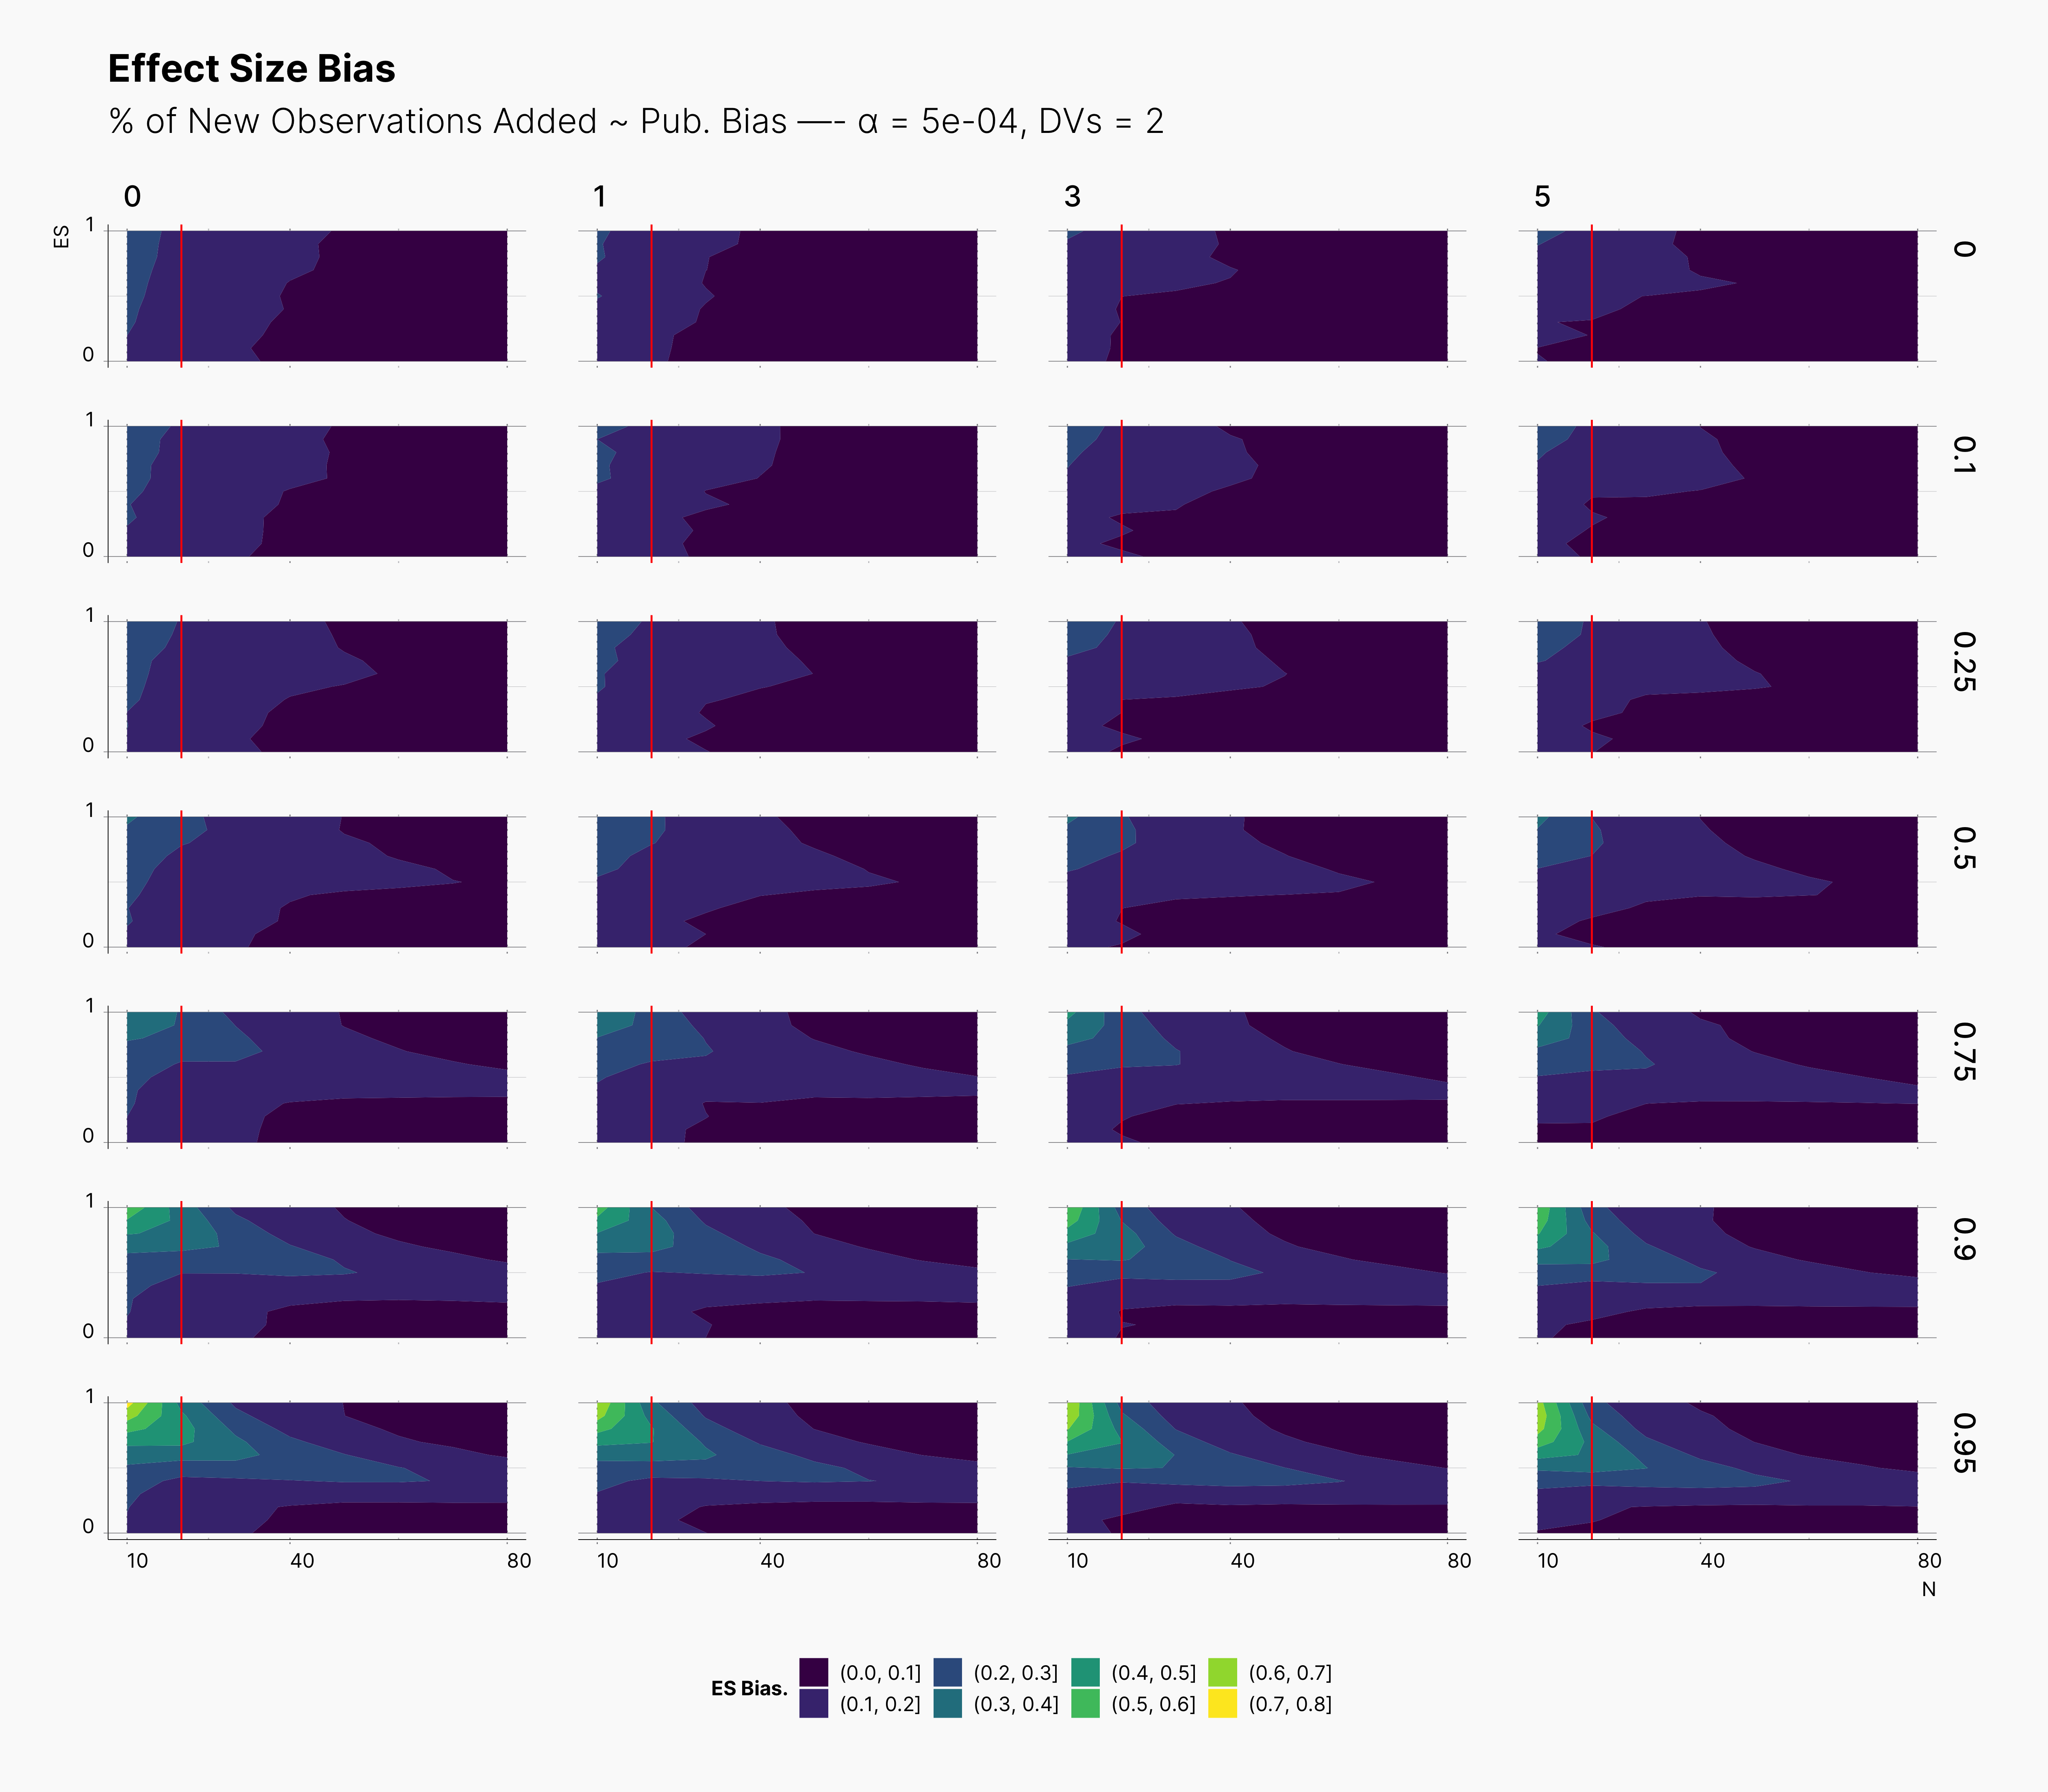
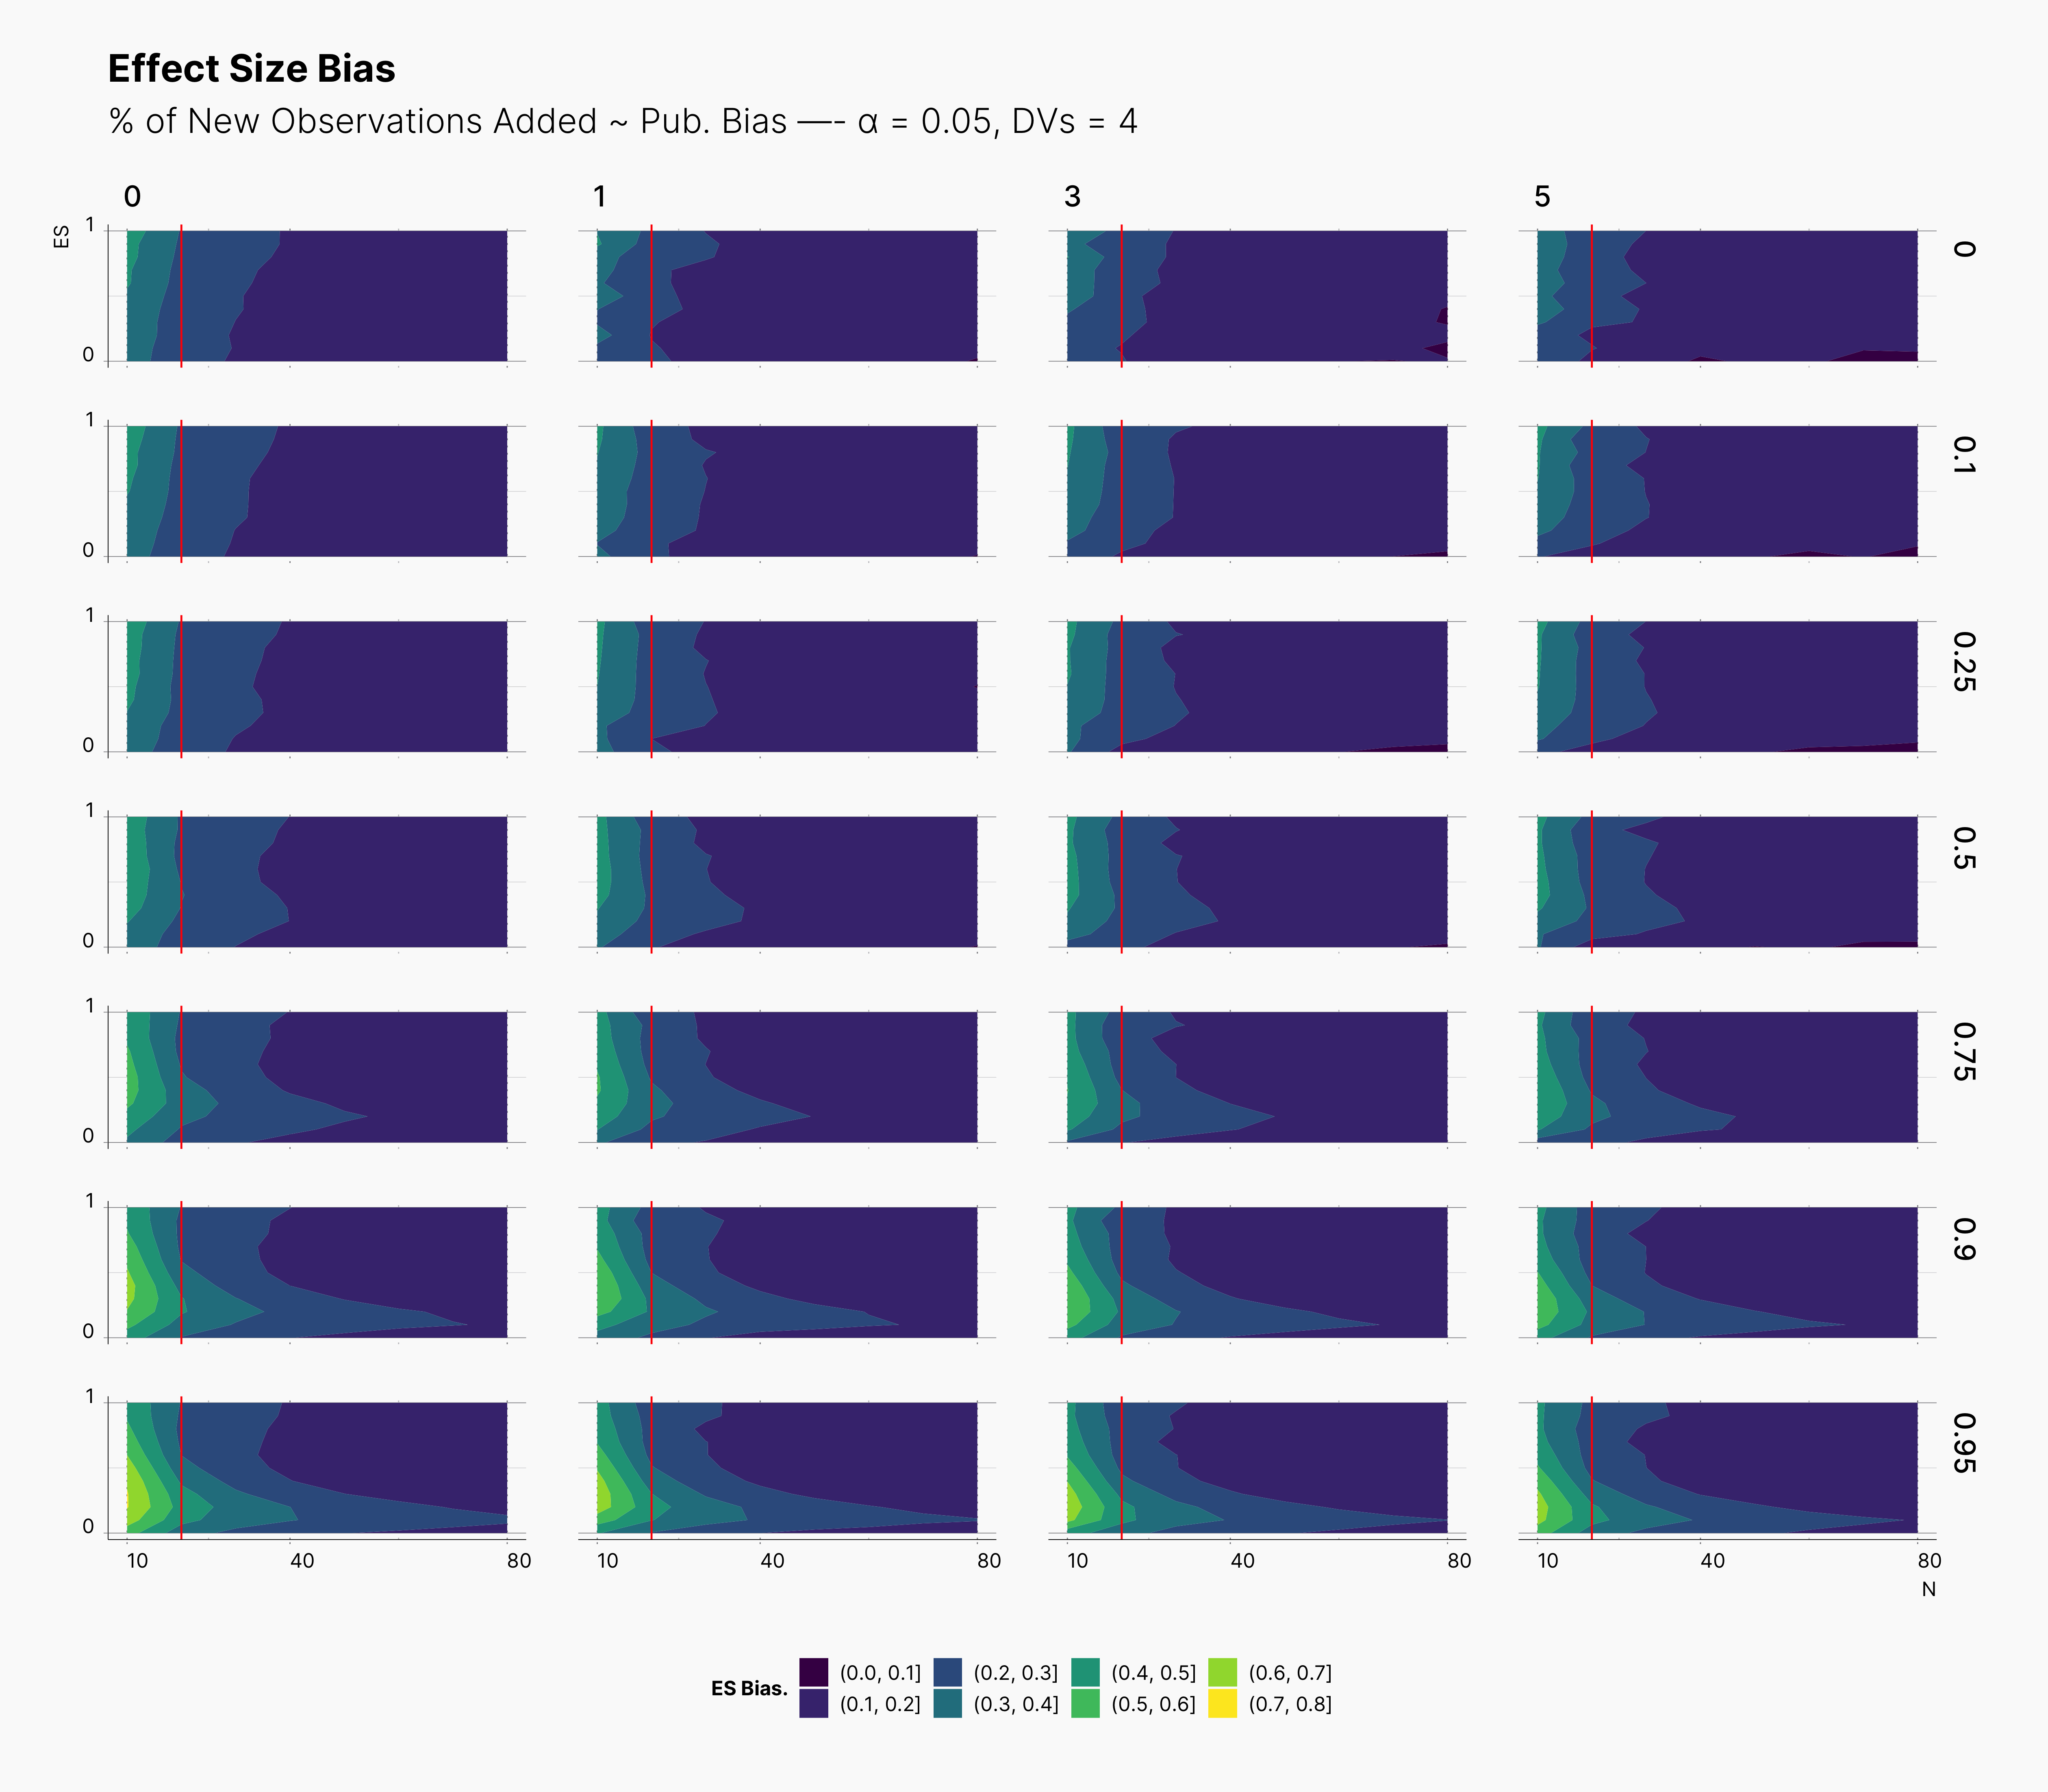
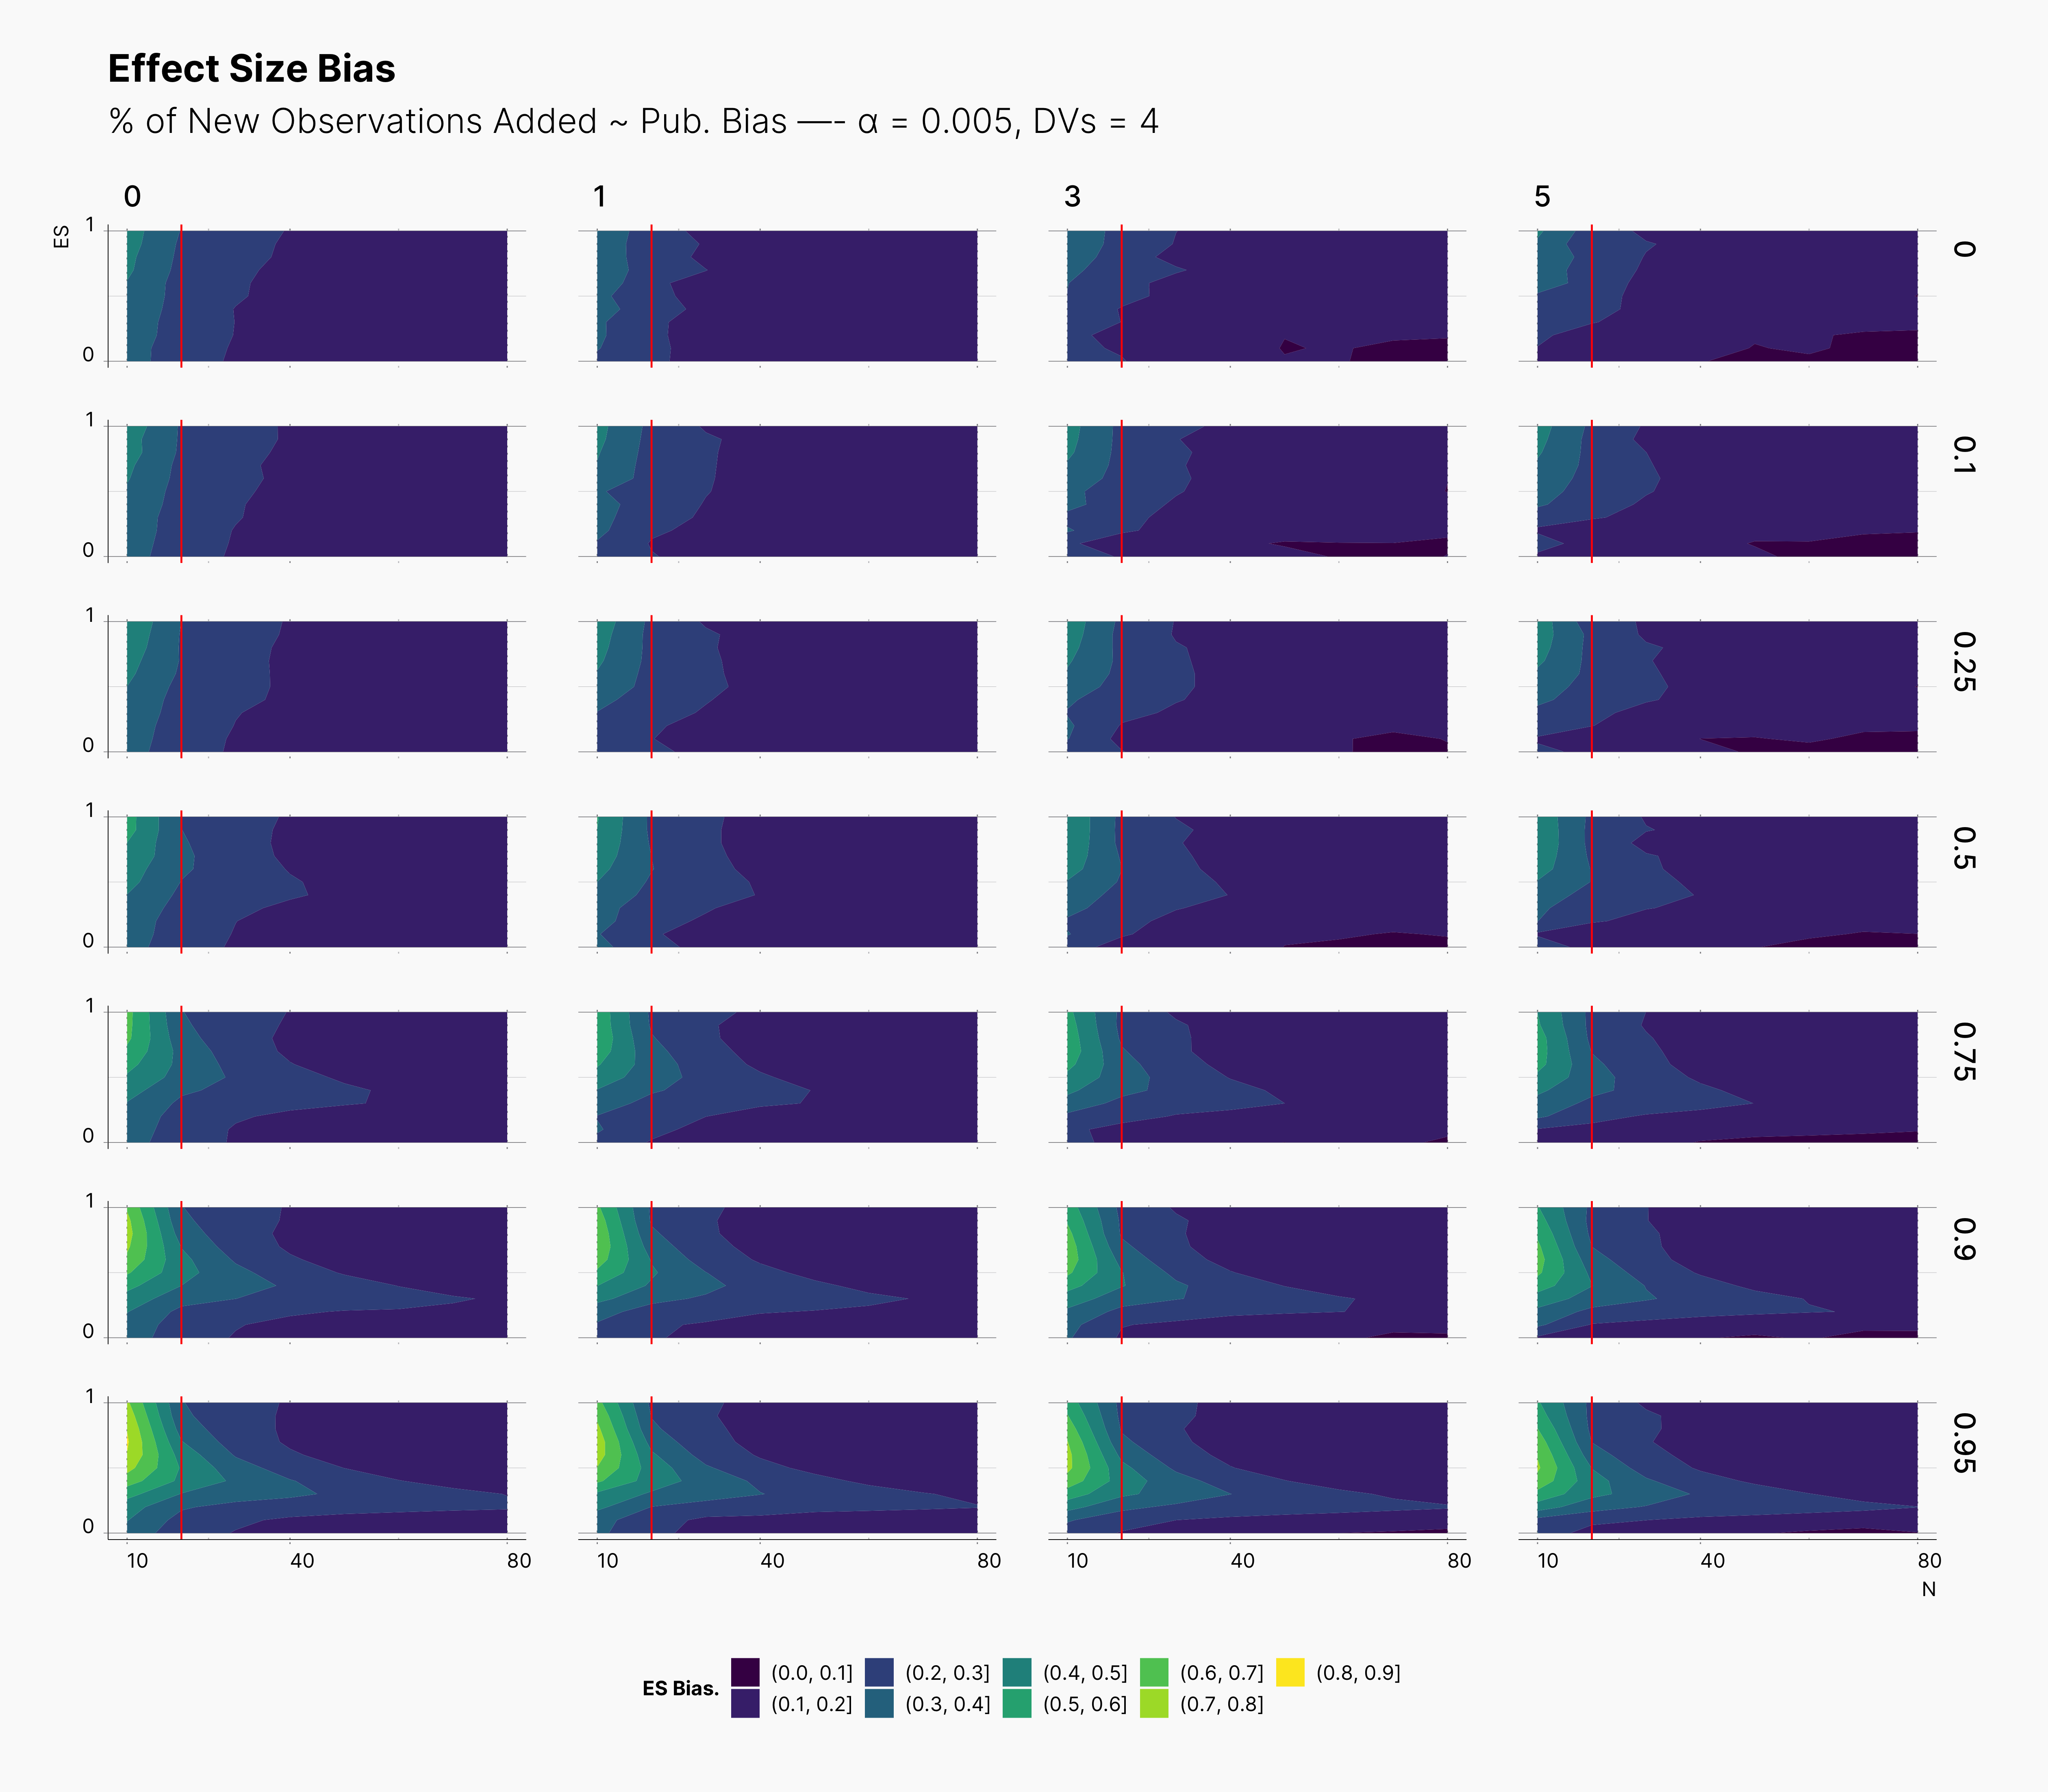
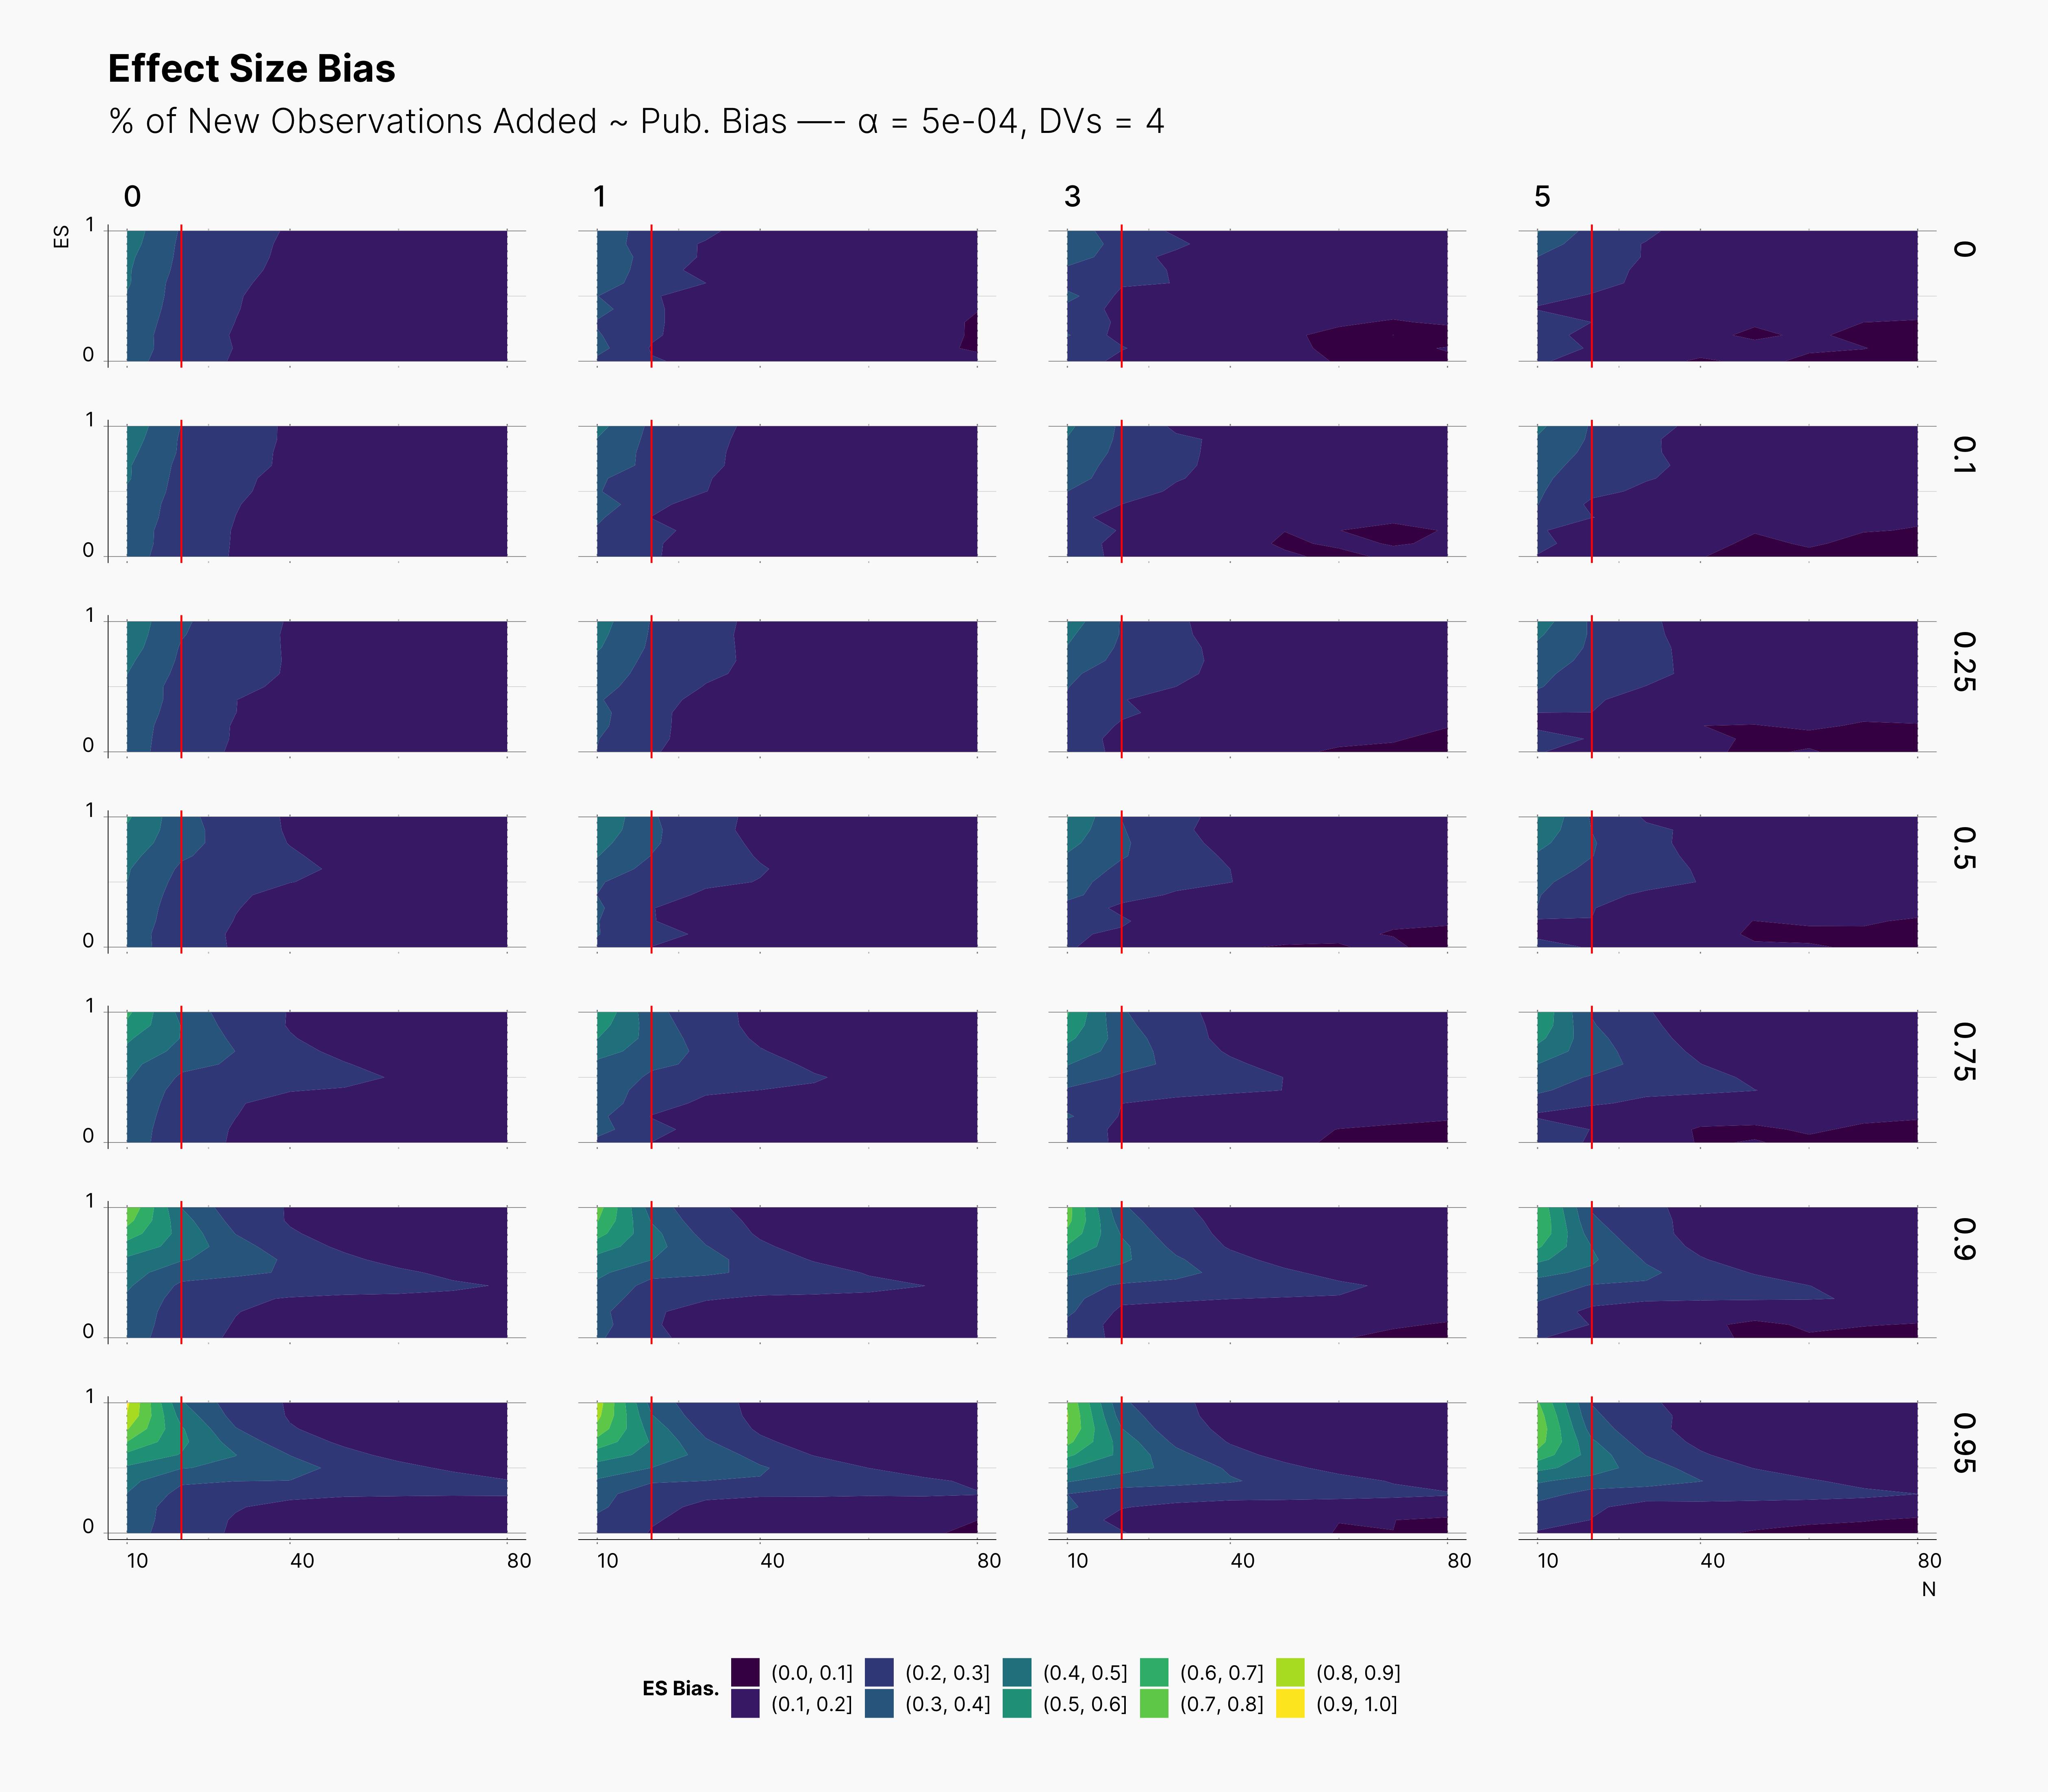
In the case of effect size bias, as we showed in the sample size variation study, we see that the level of bias is higher as we add more dependent variables to our studies. Additionally, while optional stopping does not increase the overall level of bias, it shifts it toward higher sample sizes. This is expected, as a
Moreover, we observe that the level of bias lowers as we increase S; however, the region that bias appears in the contour plot doesn’t move and only shrinks. We can also see that the bias region moves higher in the y-axes (ie., true effect size) as we increase the α level.
Finally, we can see the influence of publication bias on the effect size bias. Expectedly, increasing the publication bias will reduce our overall effect size bias while it still includes highly biased studies within the region of small true effect sizes.
First Extension: Optional Stopping Only on Treatment Group
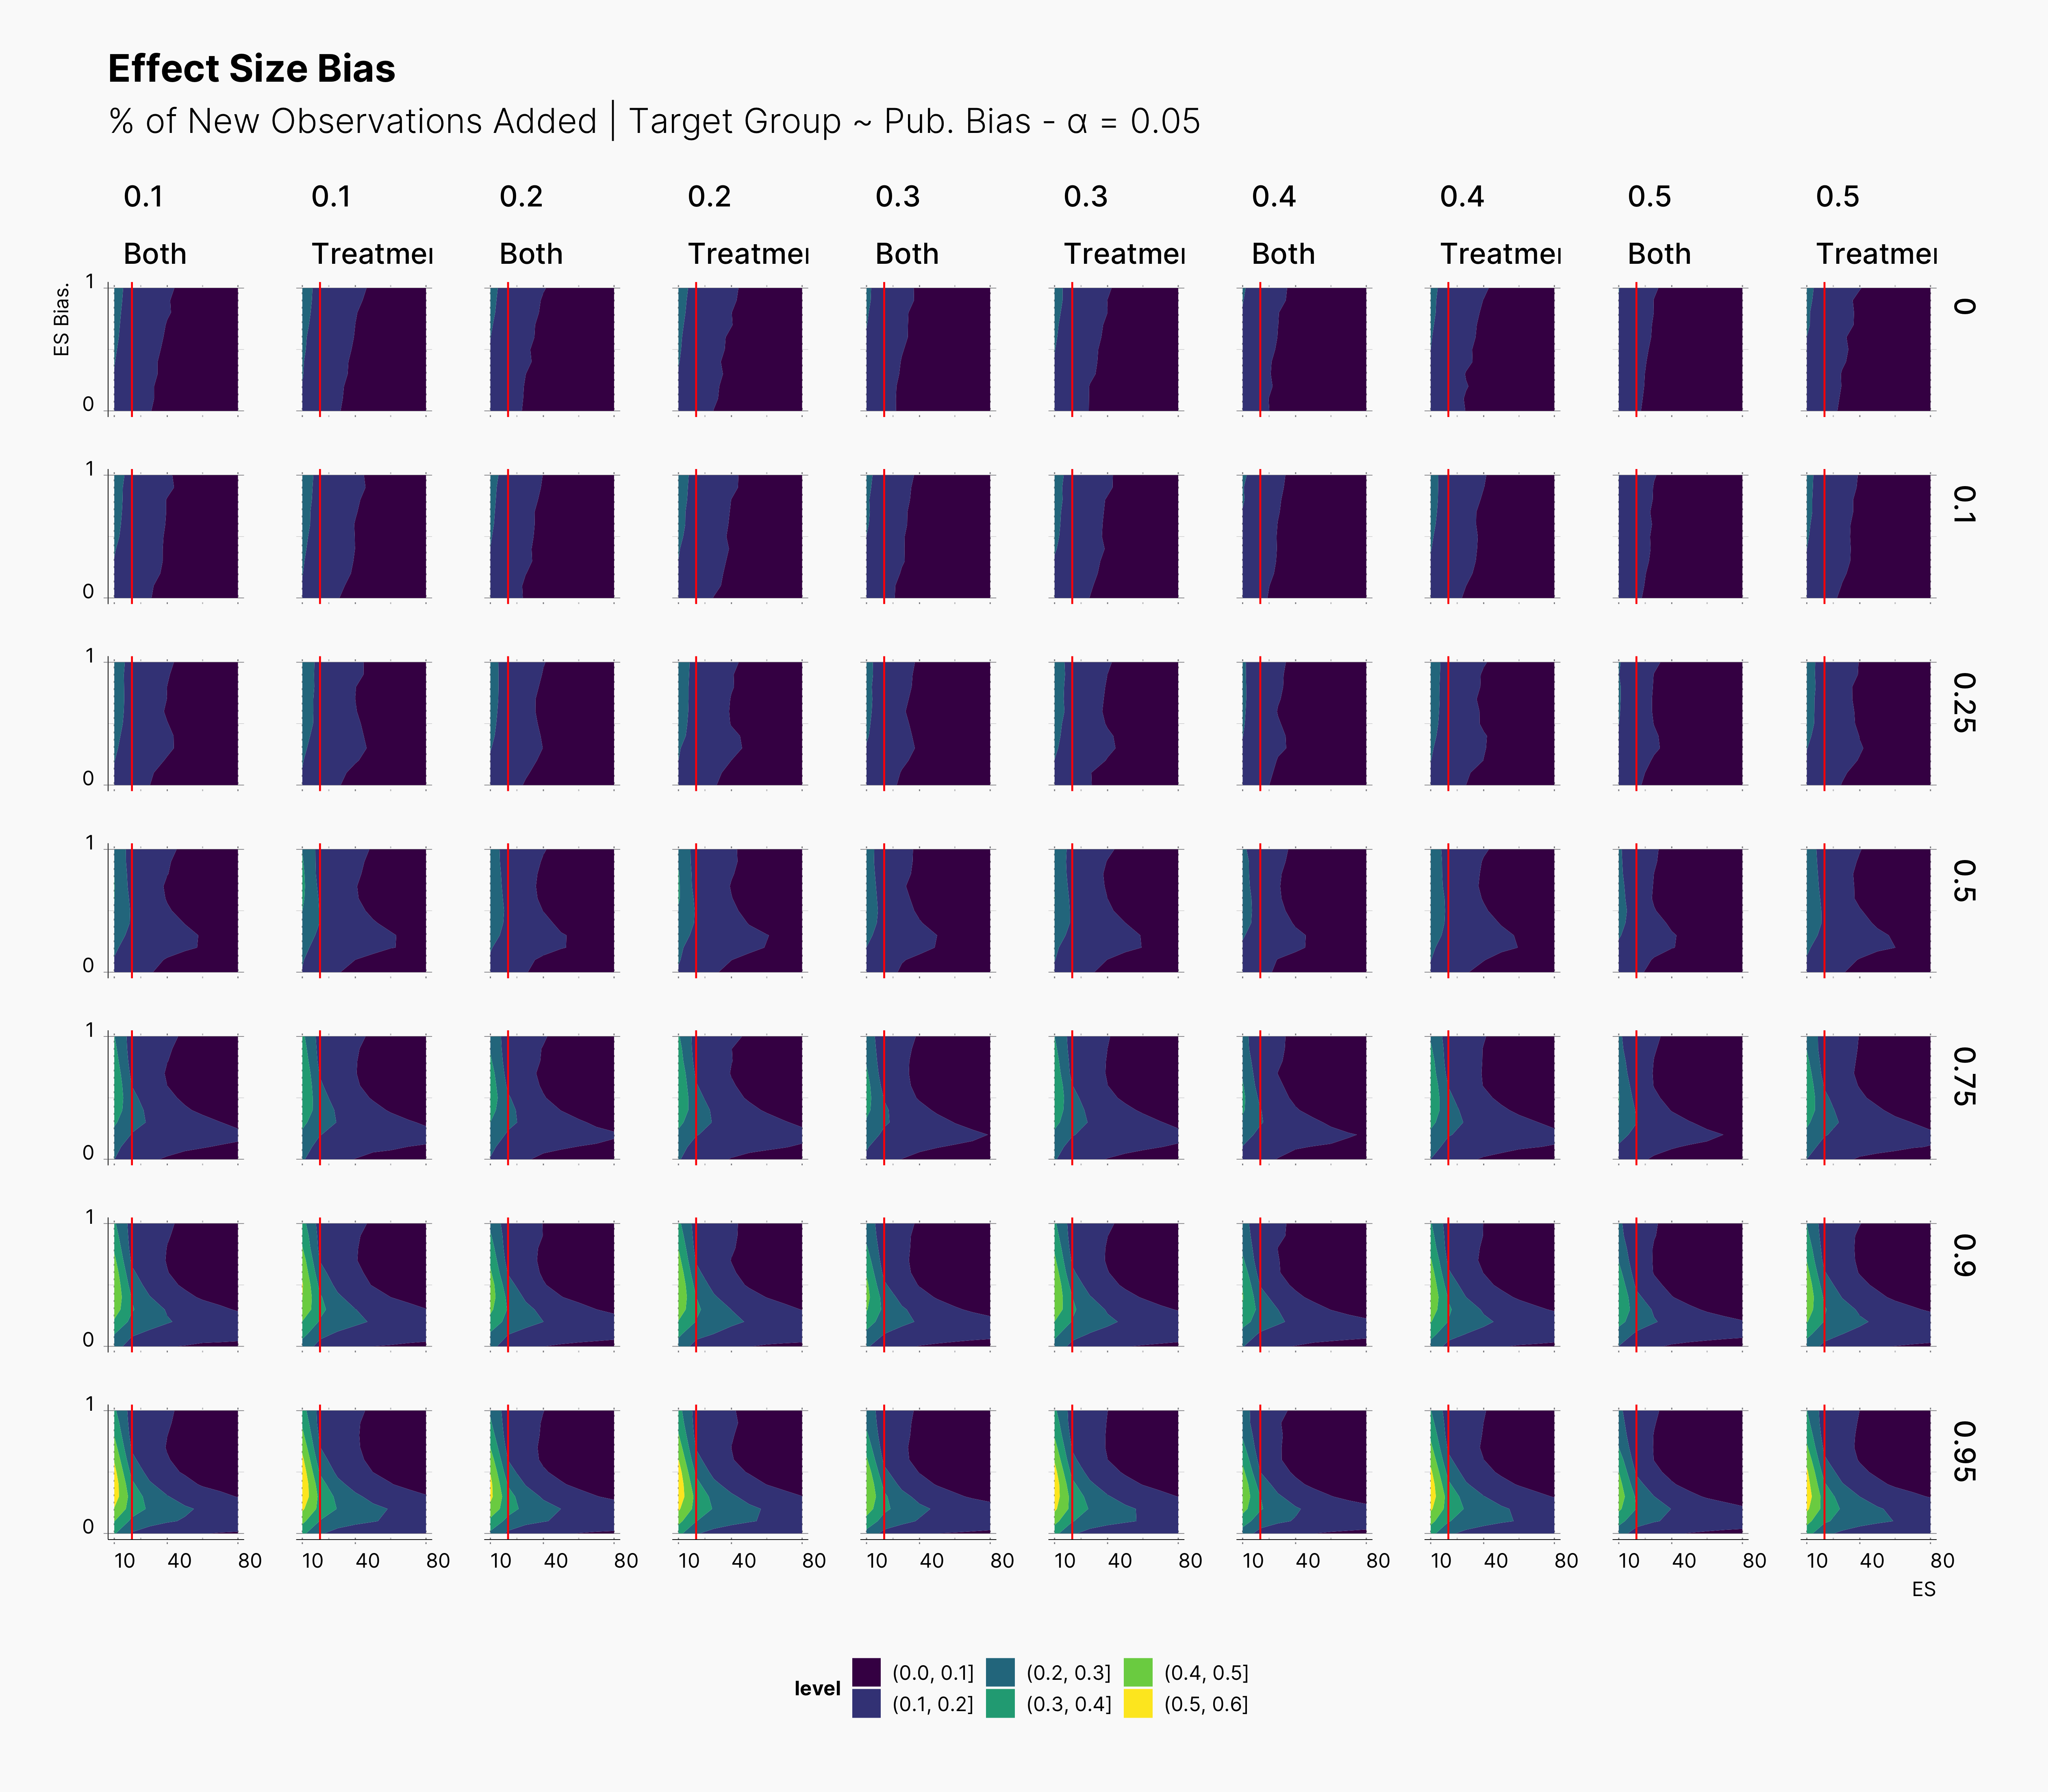
In our first extension, we investigate the effect of only applying the optional stopping on treatment groups, meaning that the Researcher will only add new observations to the treatment group and leave the control group intact.
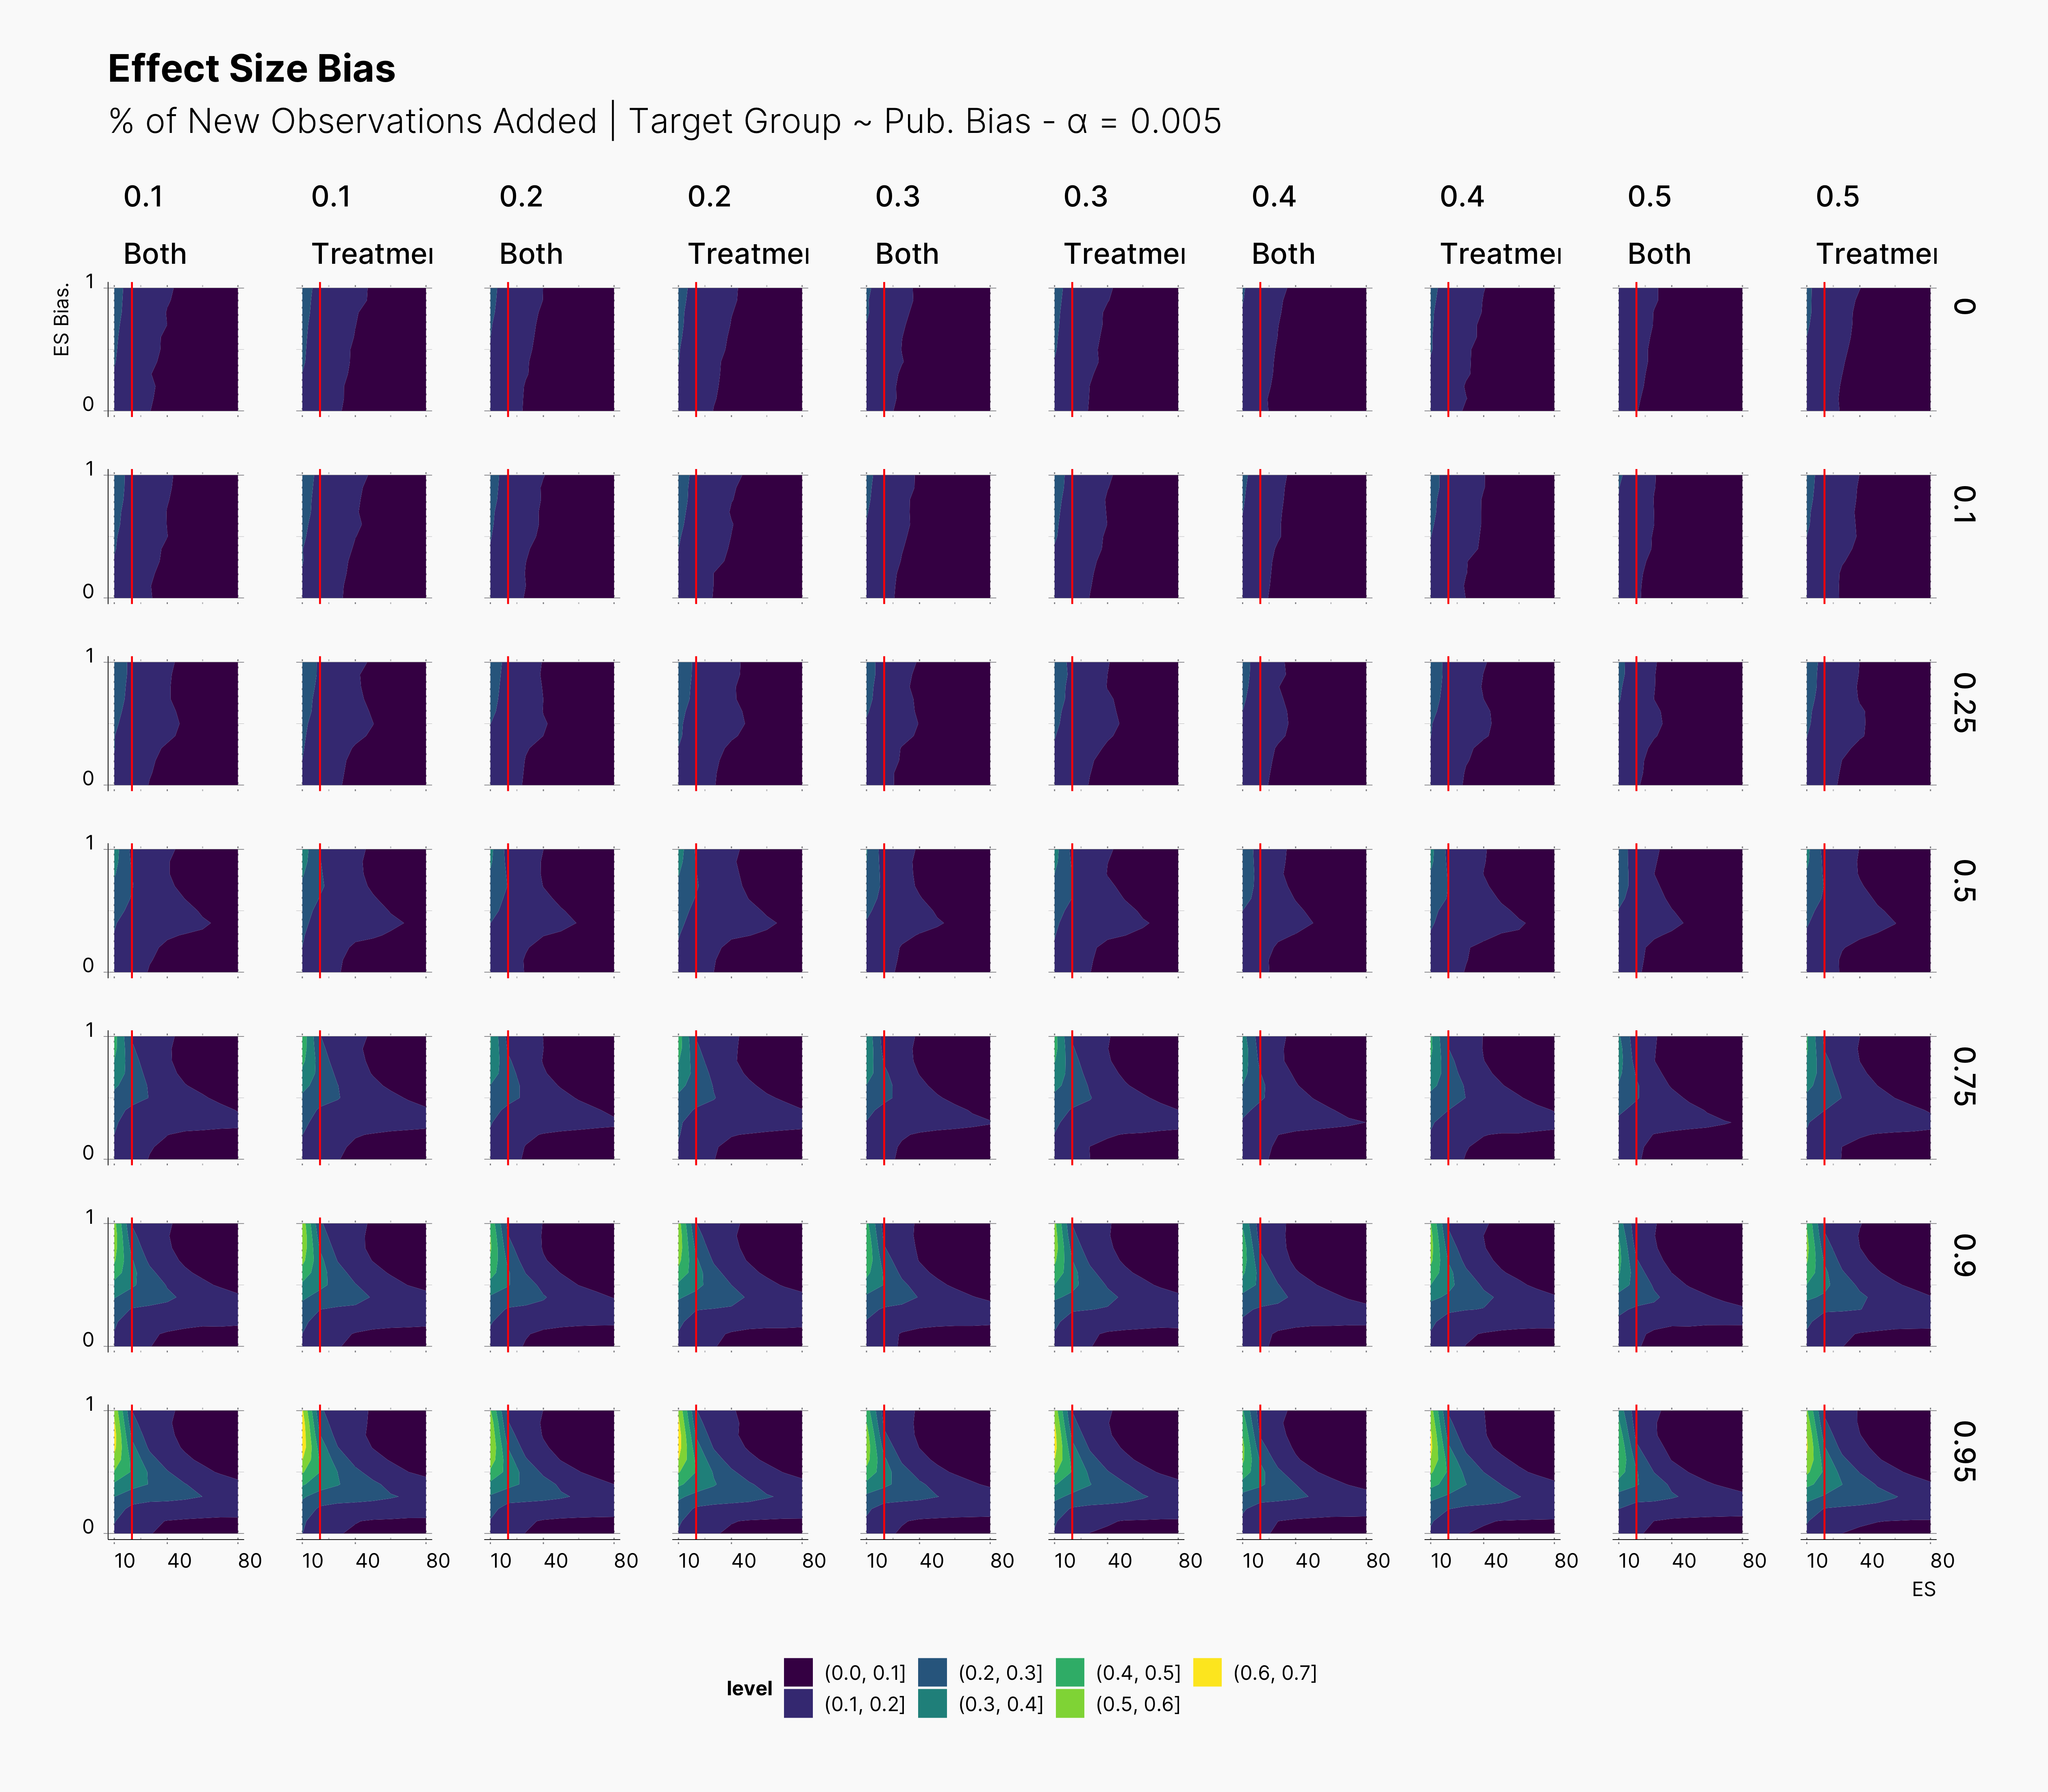
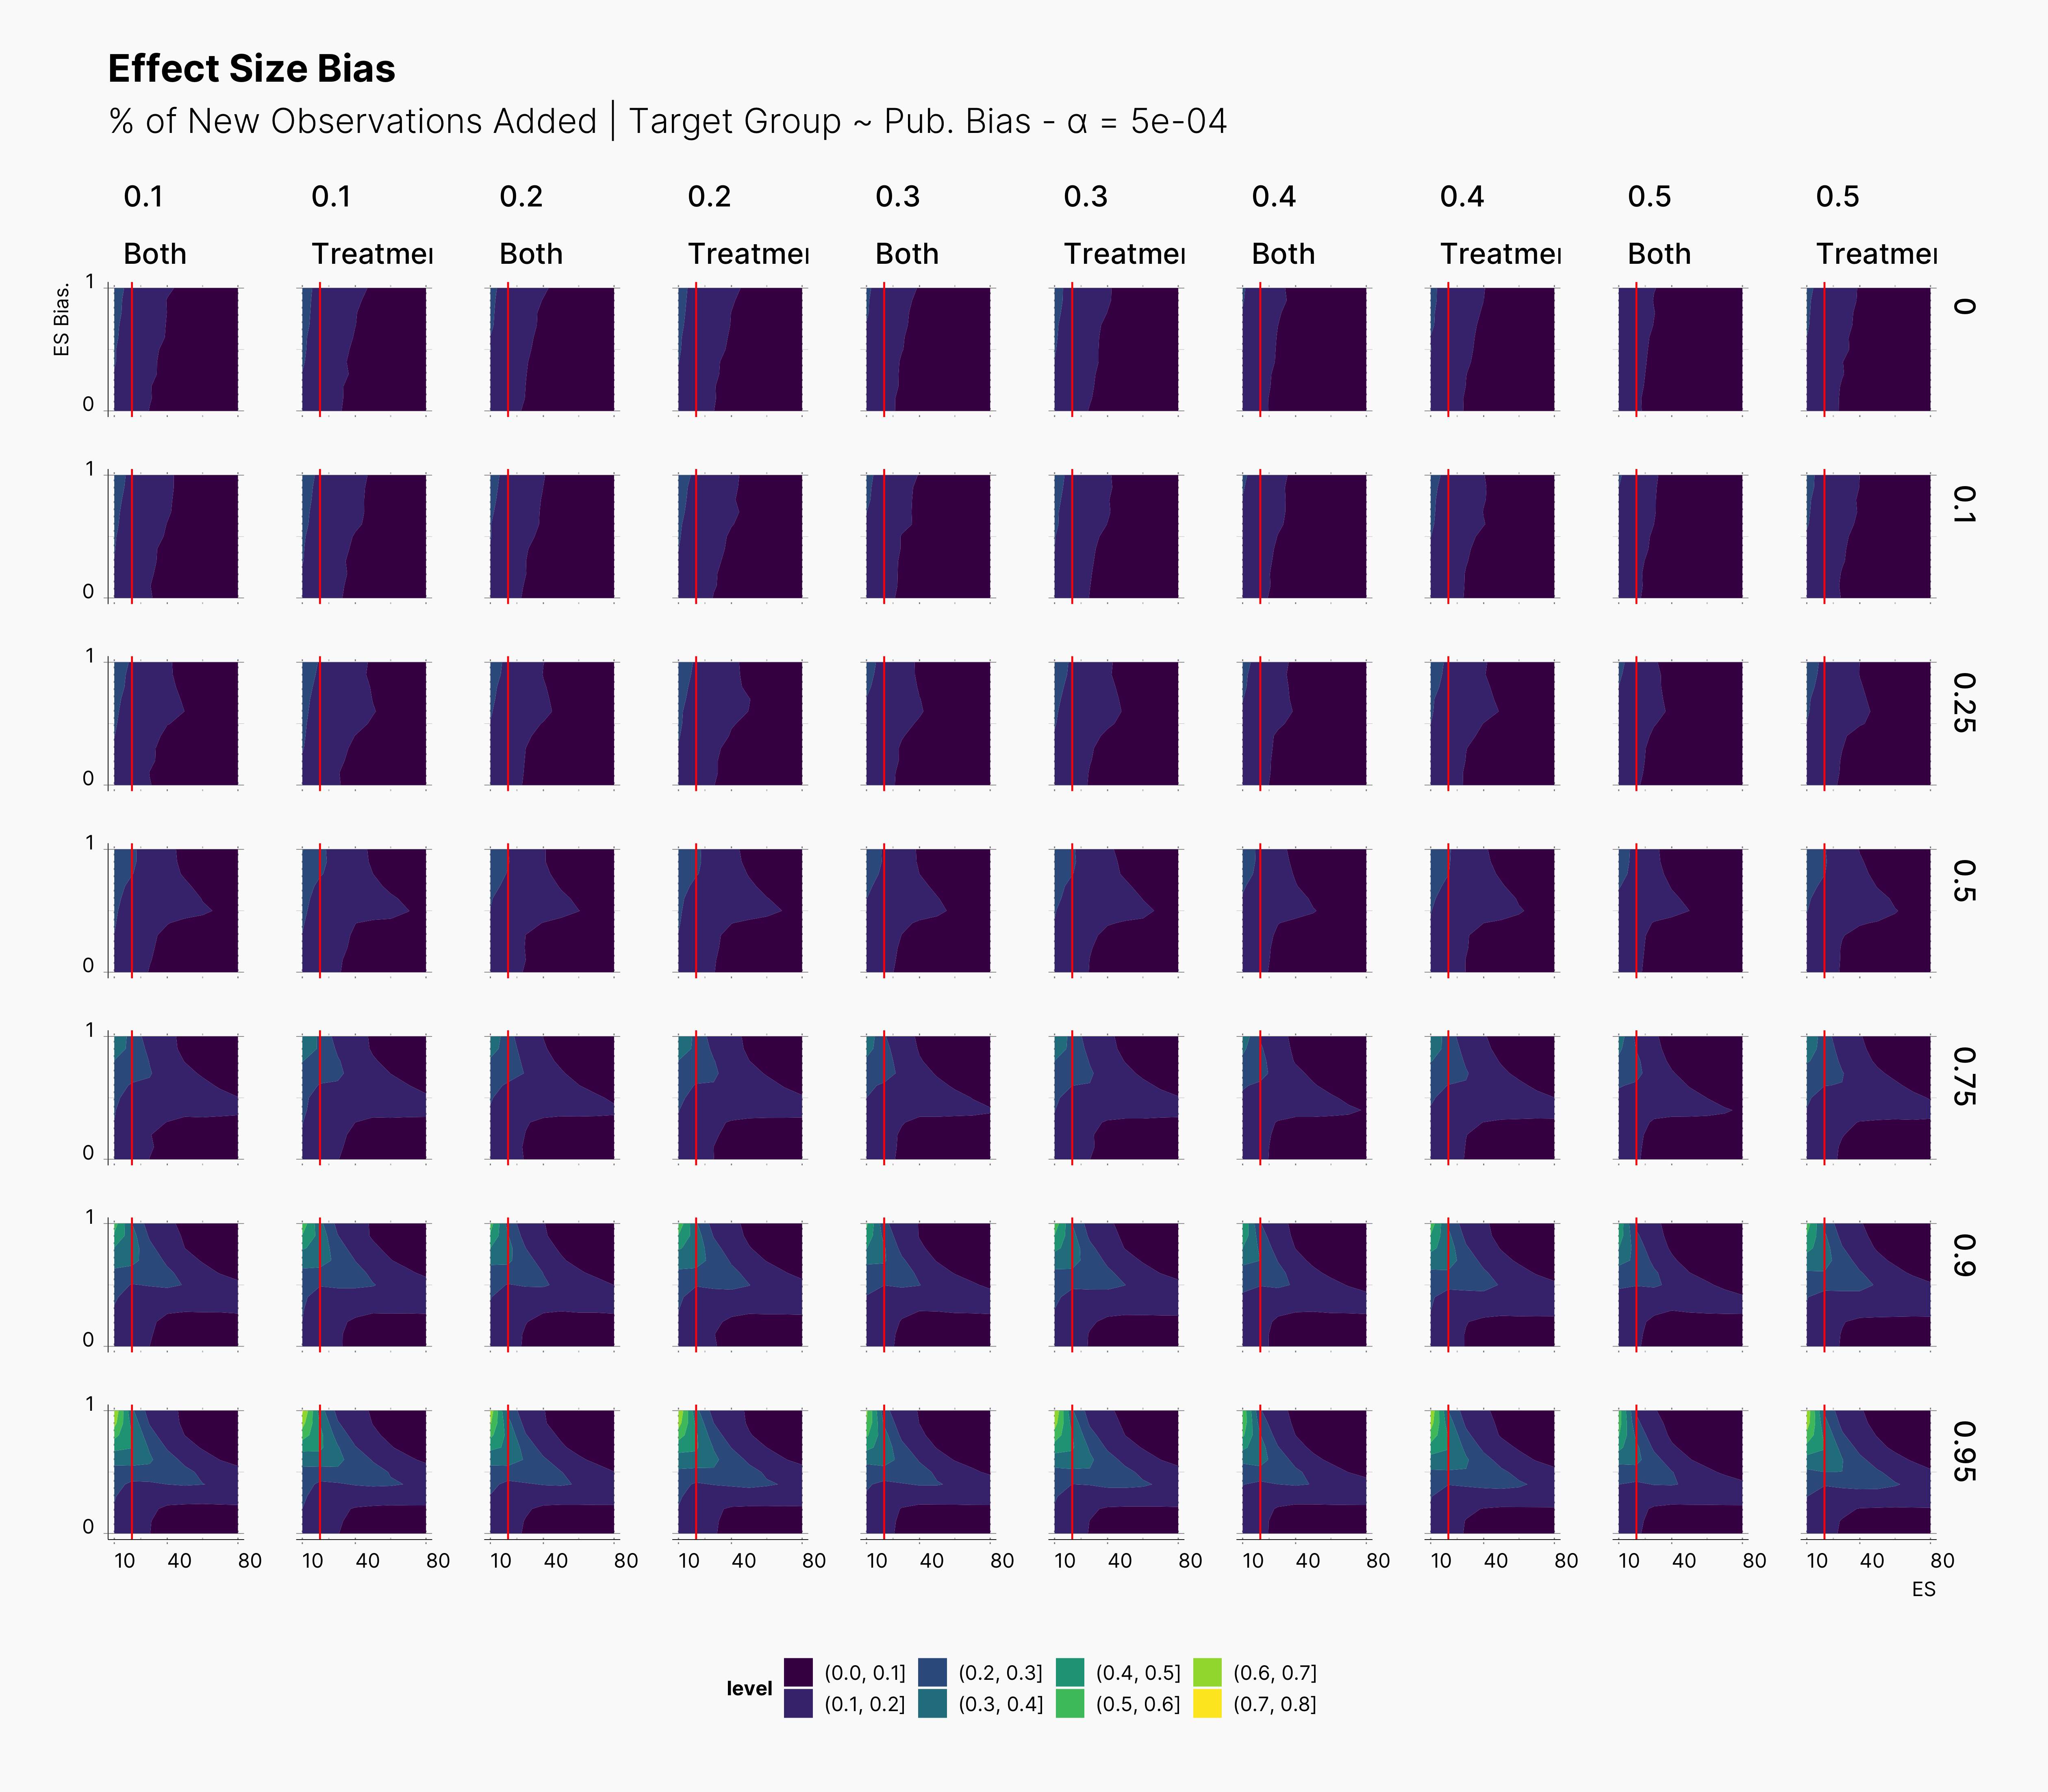
In the figure below, we can see the comparison between this study and the one performed previously, ie., adding new observation to both groups. In contrast to our expectation, adding new observation only to treatment groups does not have a considerable impact on the level of bias. This can be seen in the figure by tracking the slightly wider bias region in “Treatment” columns compared to their “Both” counterparts.
Second Extension: Optional Stopping Field
In our second extension of our study, we investigate the effect of variable optional stopping parameters.
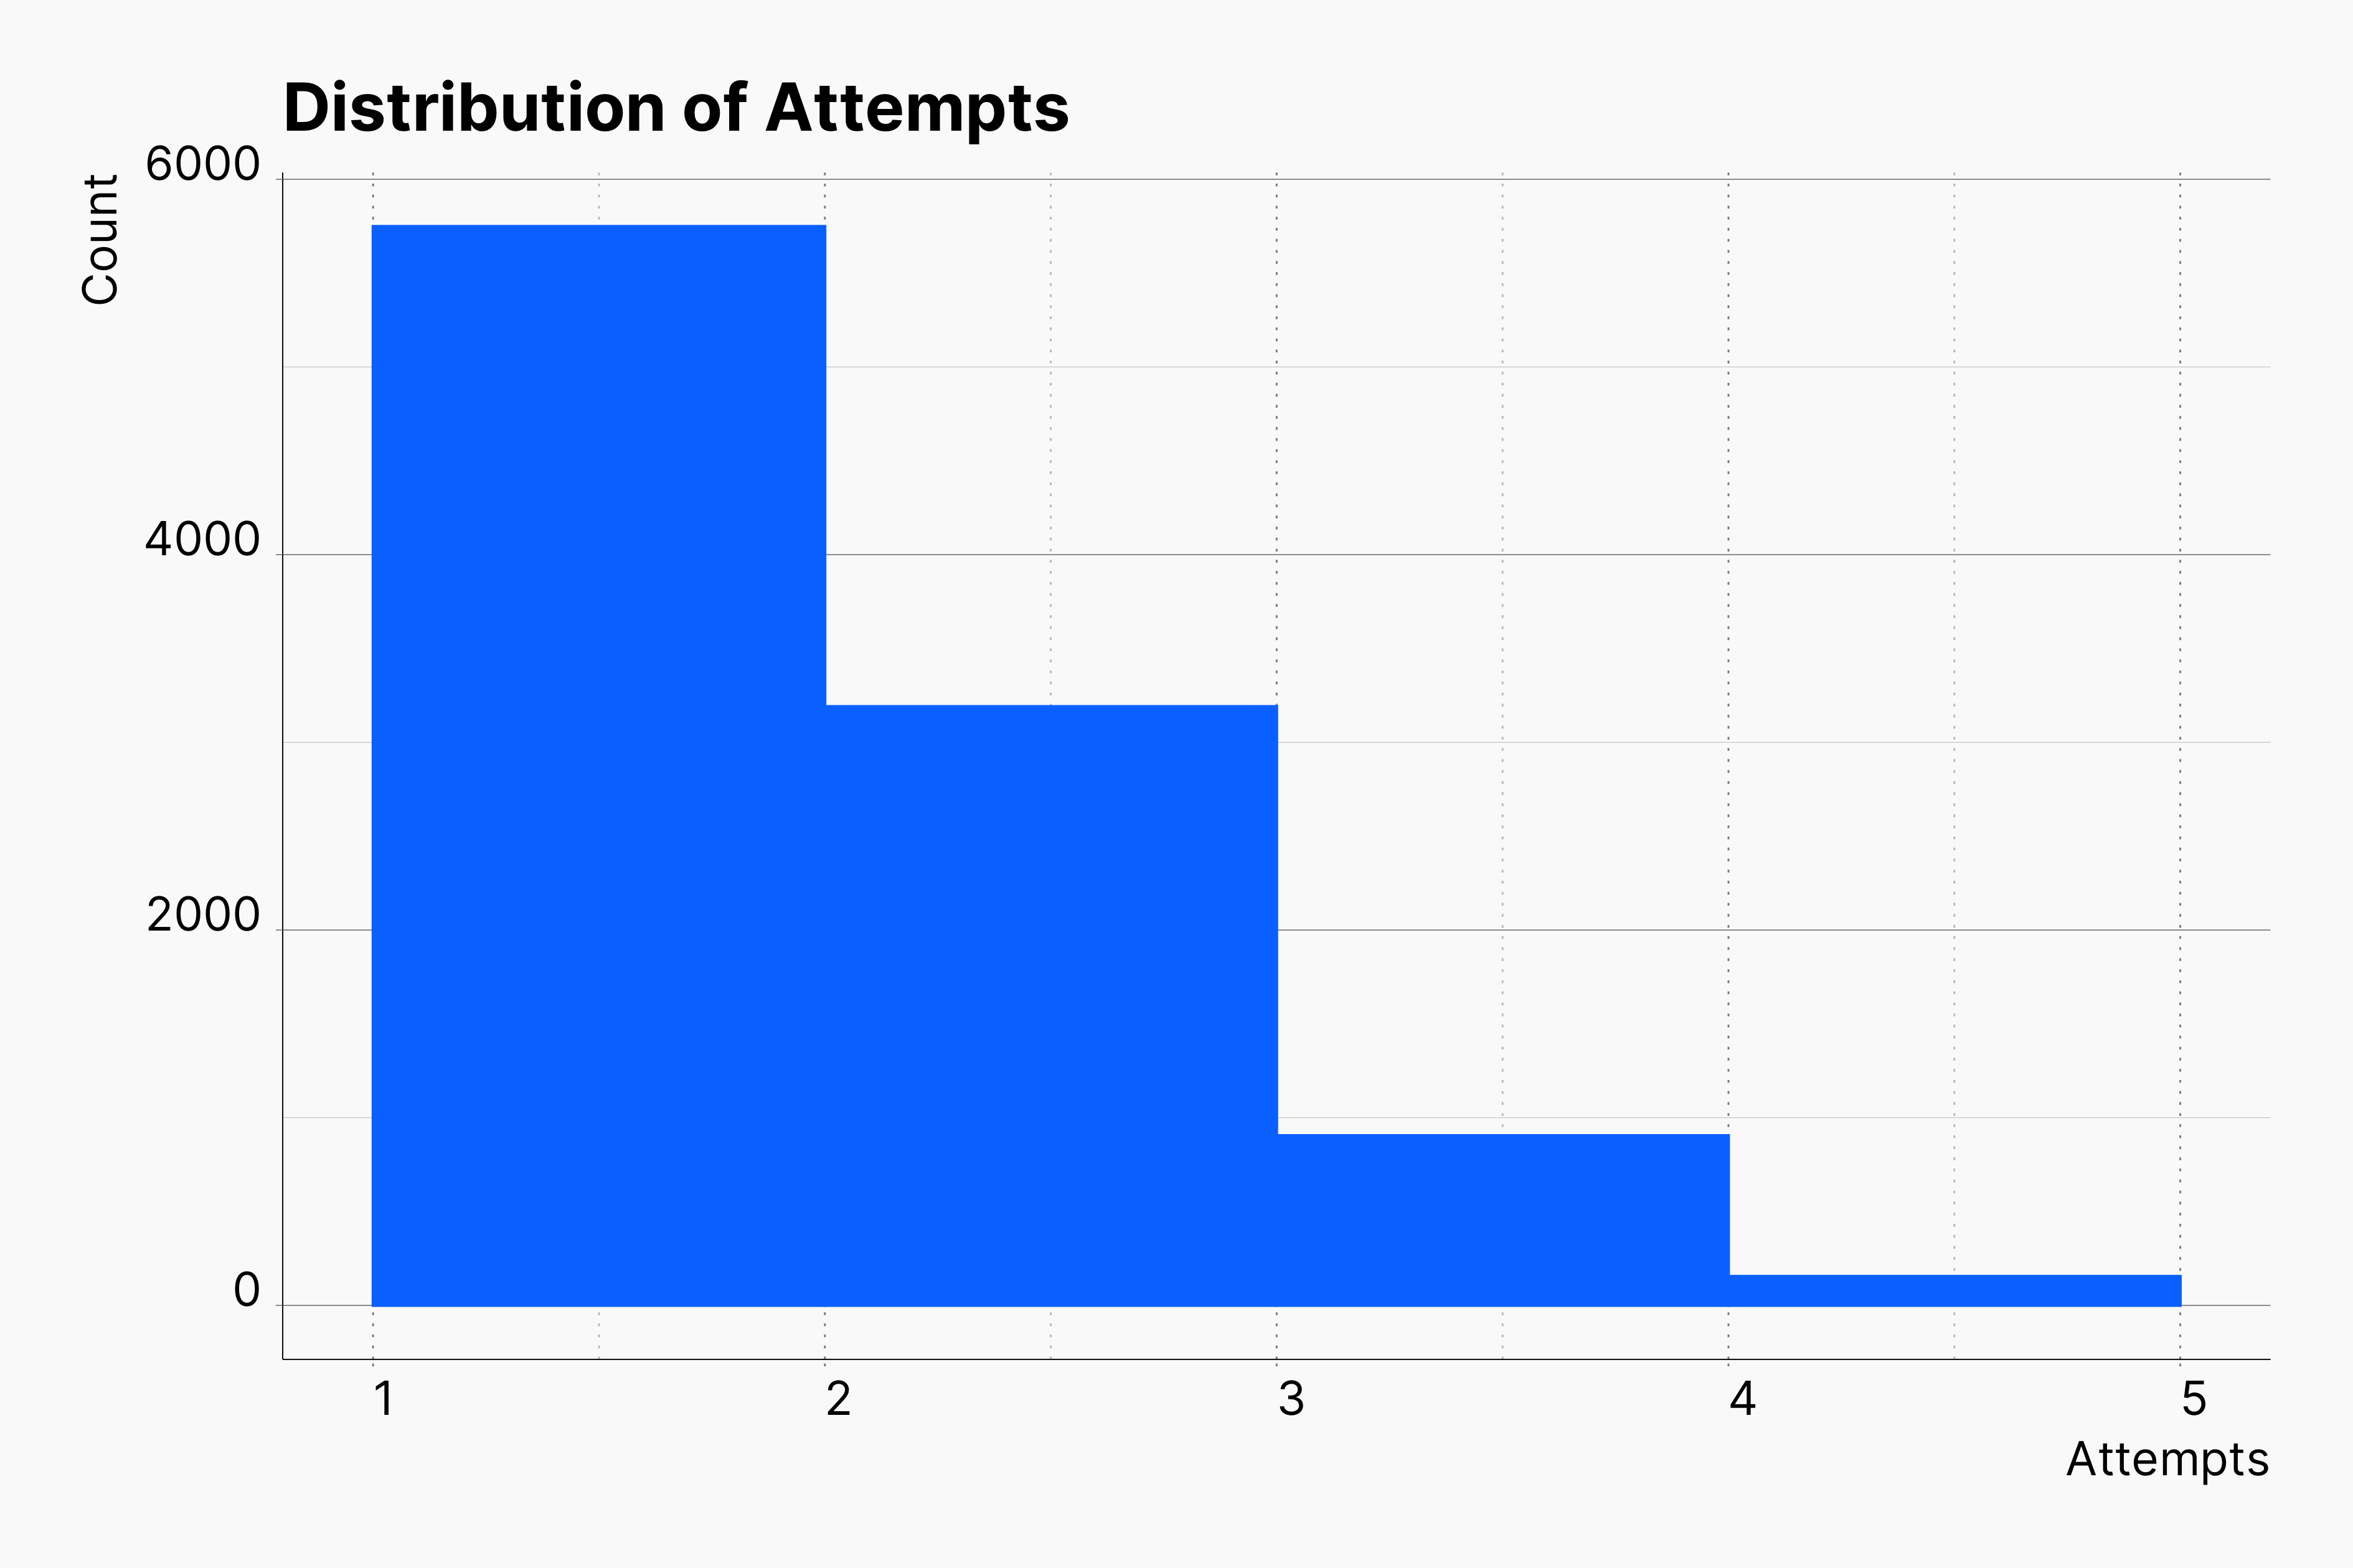
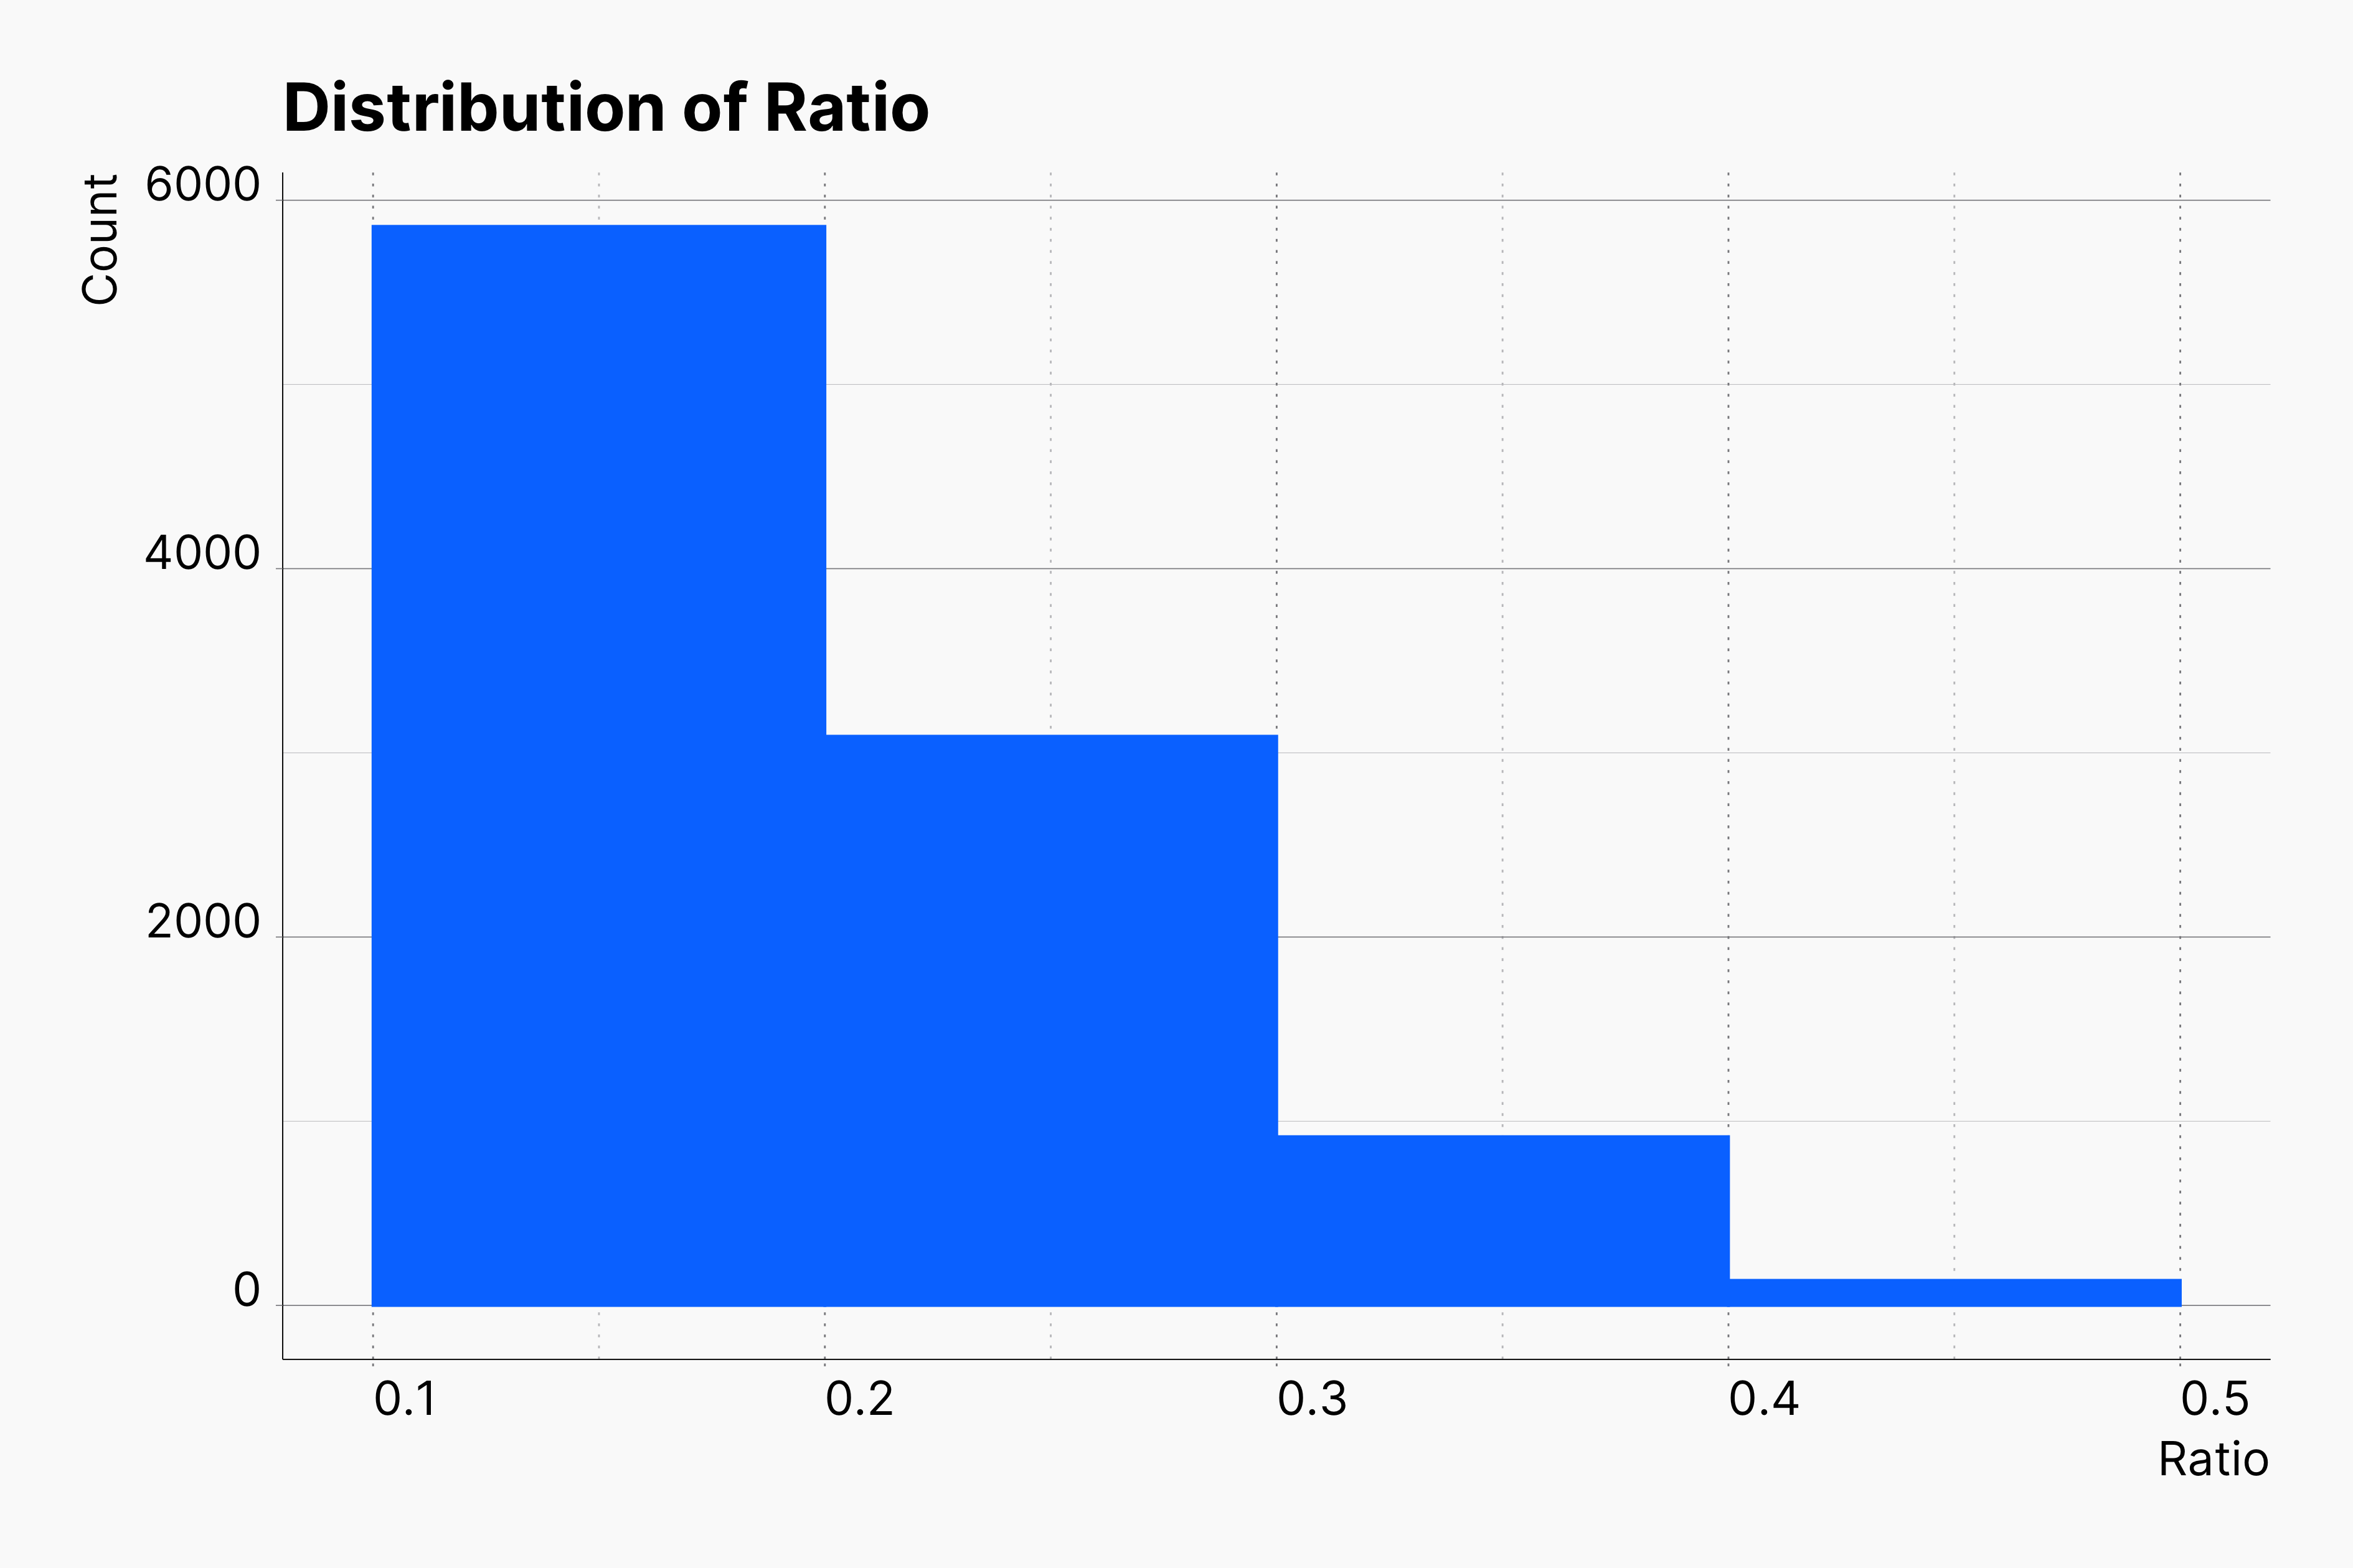
In contrast to our previous simulations where we simulated a range of parameters, in this simulation we draw a random value for two main parameters of the optional stopping, ratio and n_attempts. Our choices for distribution of ratio and n_attempts is based on fine-tuned *truncated normal distribution*s as shown here. These distribution are mimicing a scenario in which Researches prefer to addi/collect fewer new observations, besides they ought to repeat this process as seldemly as possible.
Hackingstrategy
{
    ...
    "hacking_strategies": [
        [
            {
                "name": "OptionalStopping",
                "target": "Both",
                "prevalence": 1,
                "defensibility": 1,
                "max_attempts": 1,
                "ratio": {
                    "dist": "truncated_normal_distribution",
                    "mean": 0.1,
                    "stddev": 0.125,
                    "lower": 0.1,
                    "upper": 0.5,
                },
                "n_attempts": {
                    "dist": "truncated_normal_distribution",
                    "mean": 1,
                    "stddev": 1.25,
                    "lower": 1,
                    "upper": 5
                },
                "stopping_condition": [
                    "sig"
                ]
            },
            [
                [
                    "sig",
                    "effect > 0",
                    "random"
                ],
                [
                    "effect > 0",
                    "min(pvalue)"
                ],
                [
                    "effect < 0",
                    "max(pvalue)"
                ]
            ],
            [
                "id < 0"
            ]
        ]
    ],
    ...
}
As before, it is difficult to observe any meaningful changes in the landscape of PFS; however, we are able to spot more minor changes.
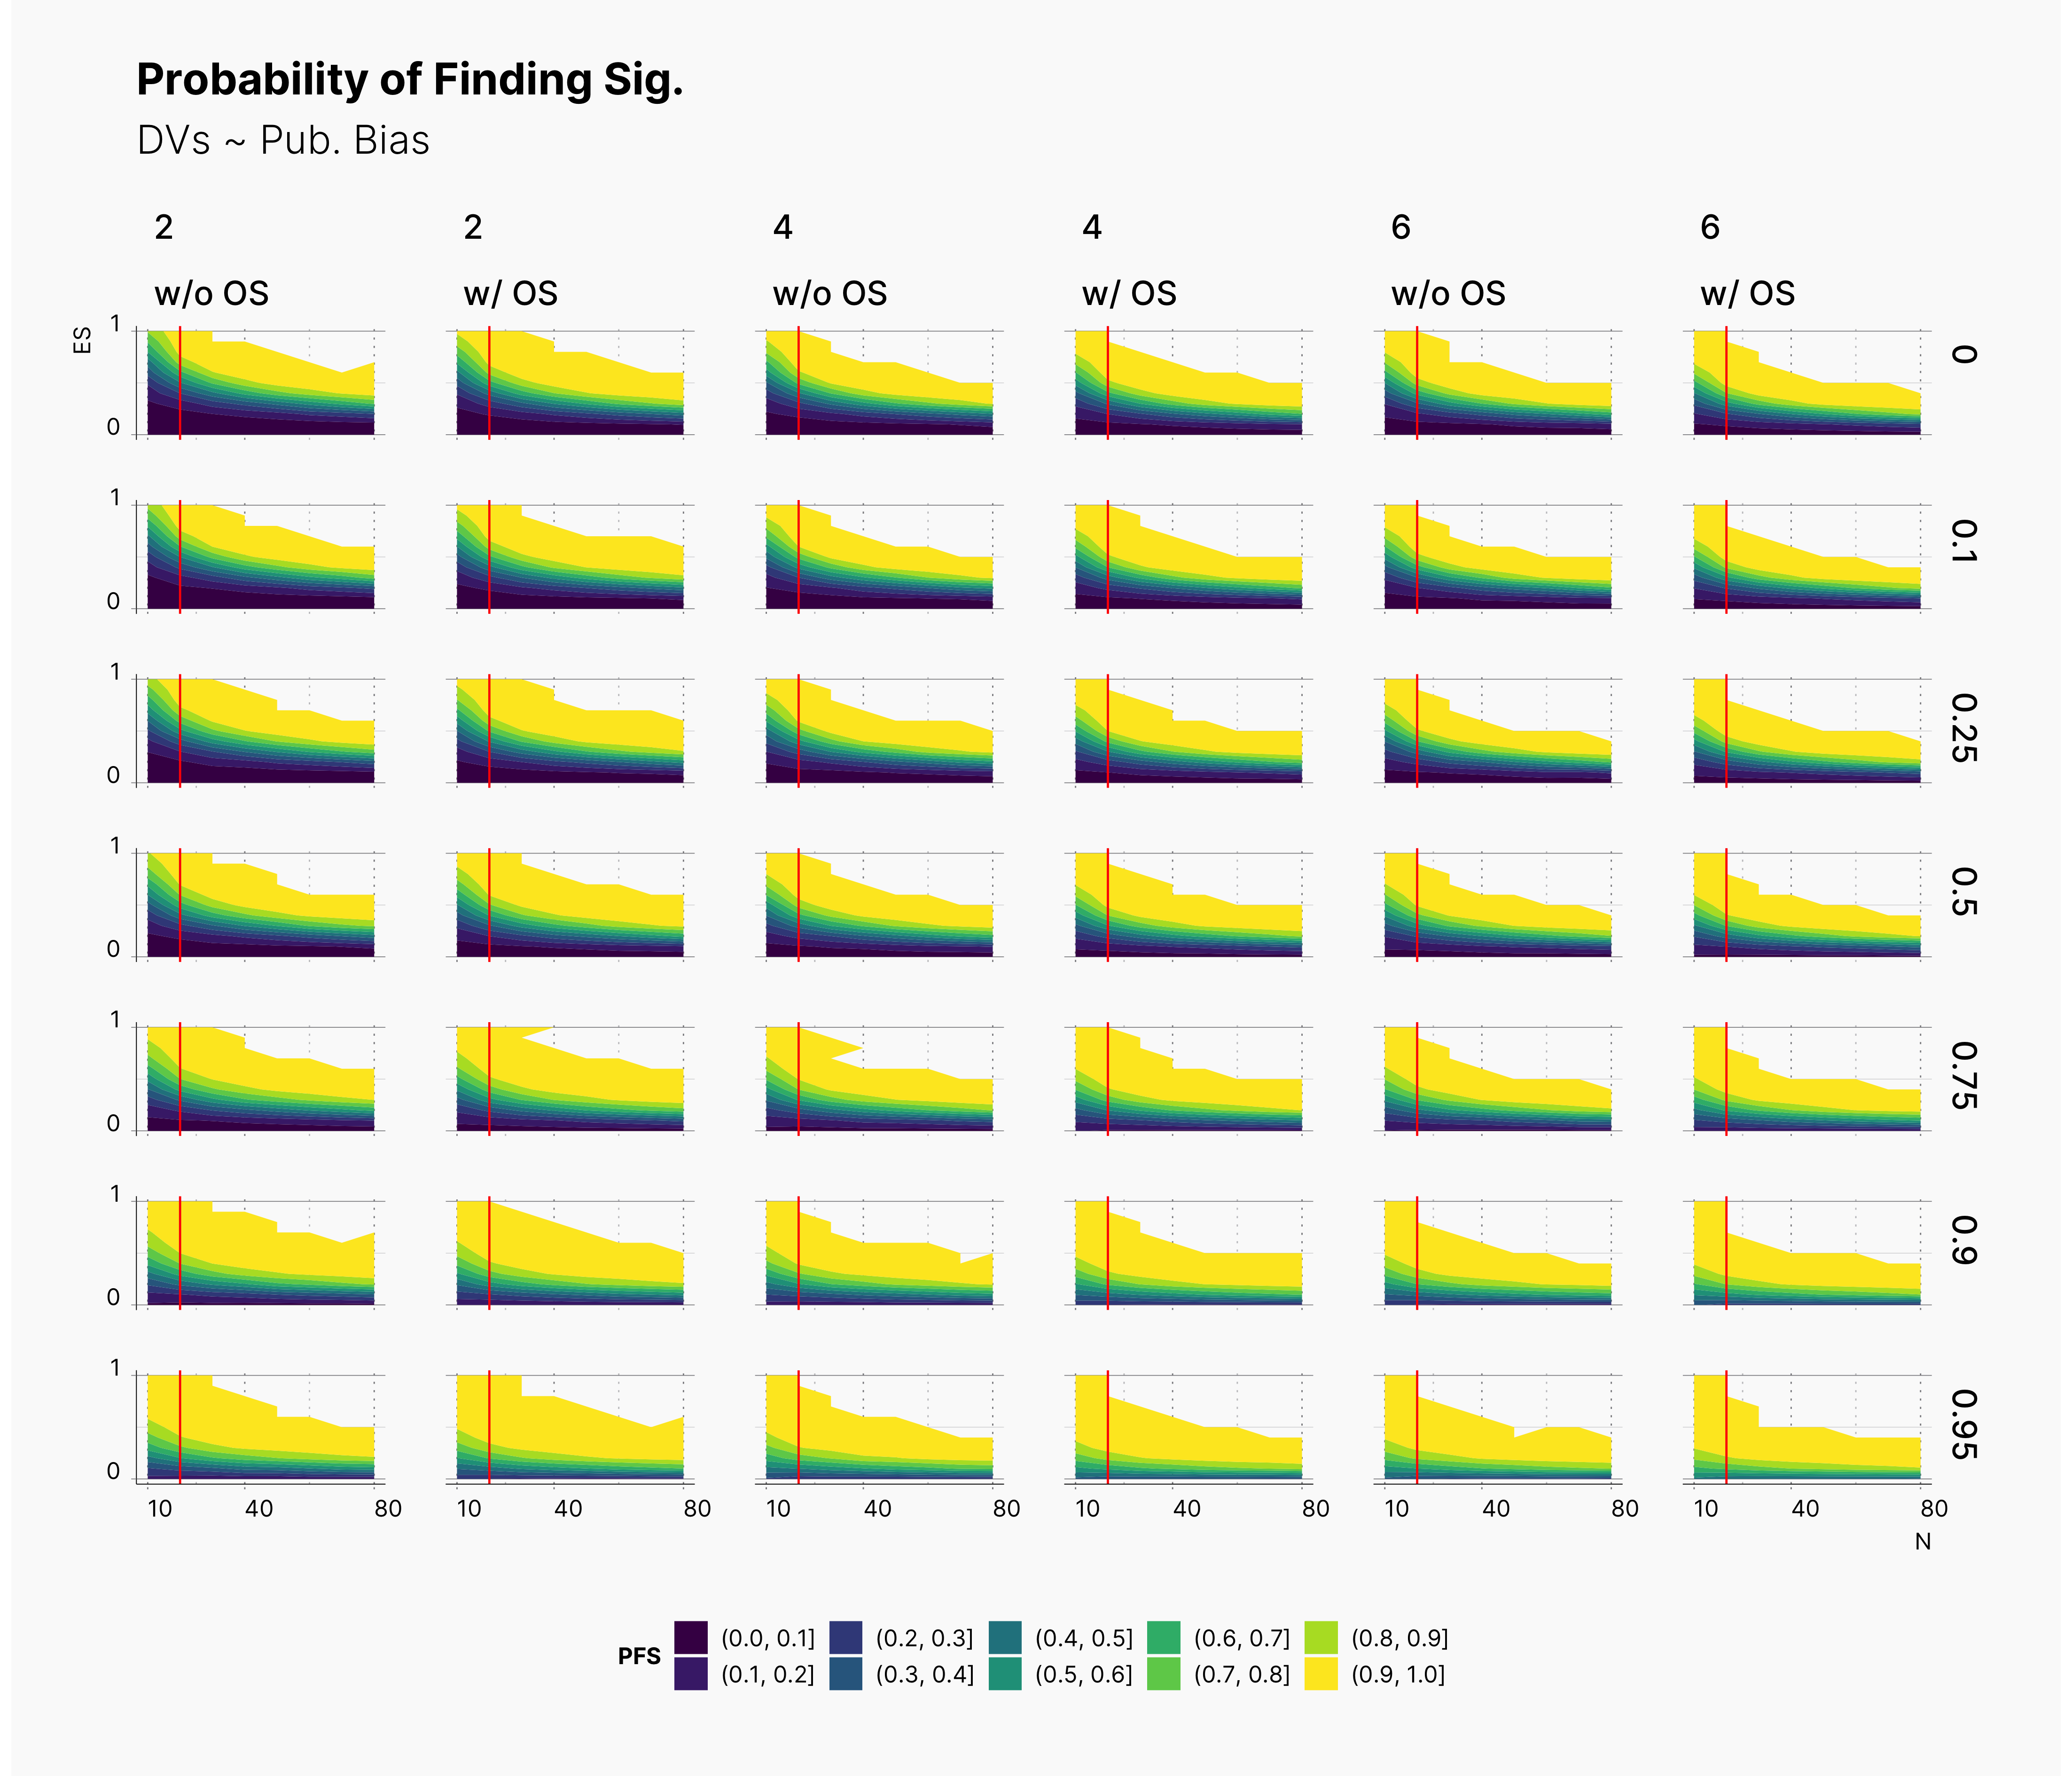
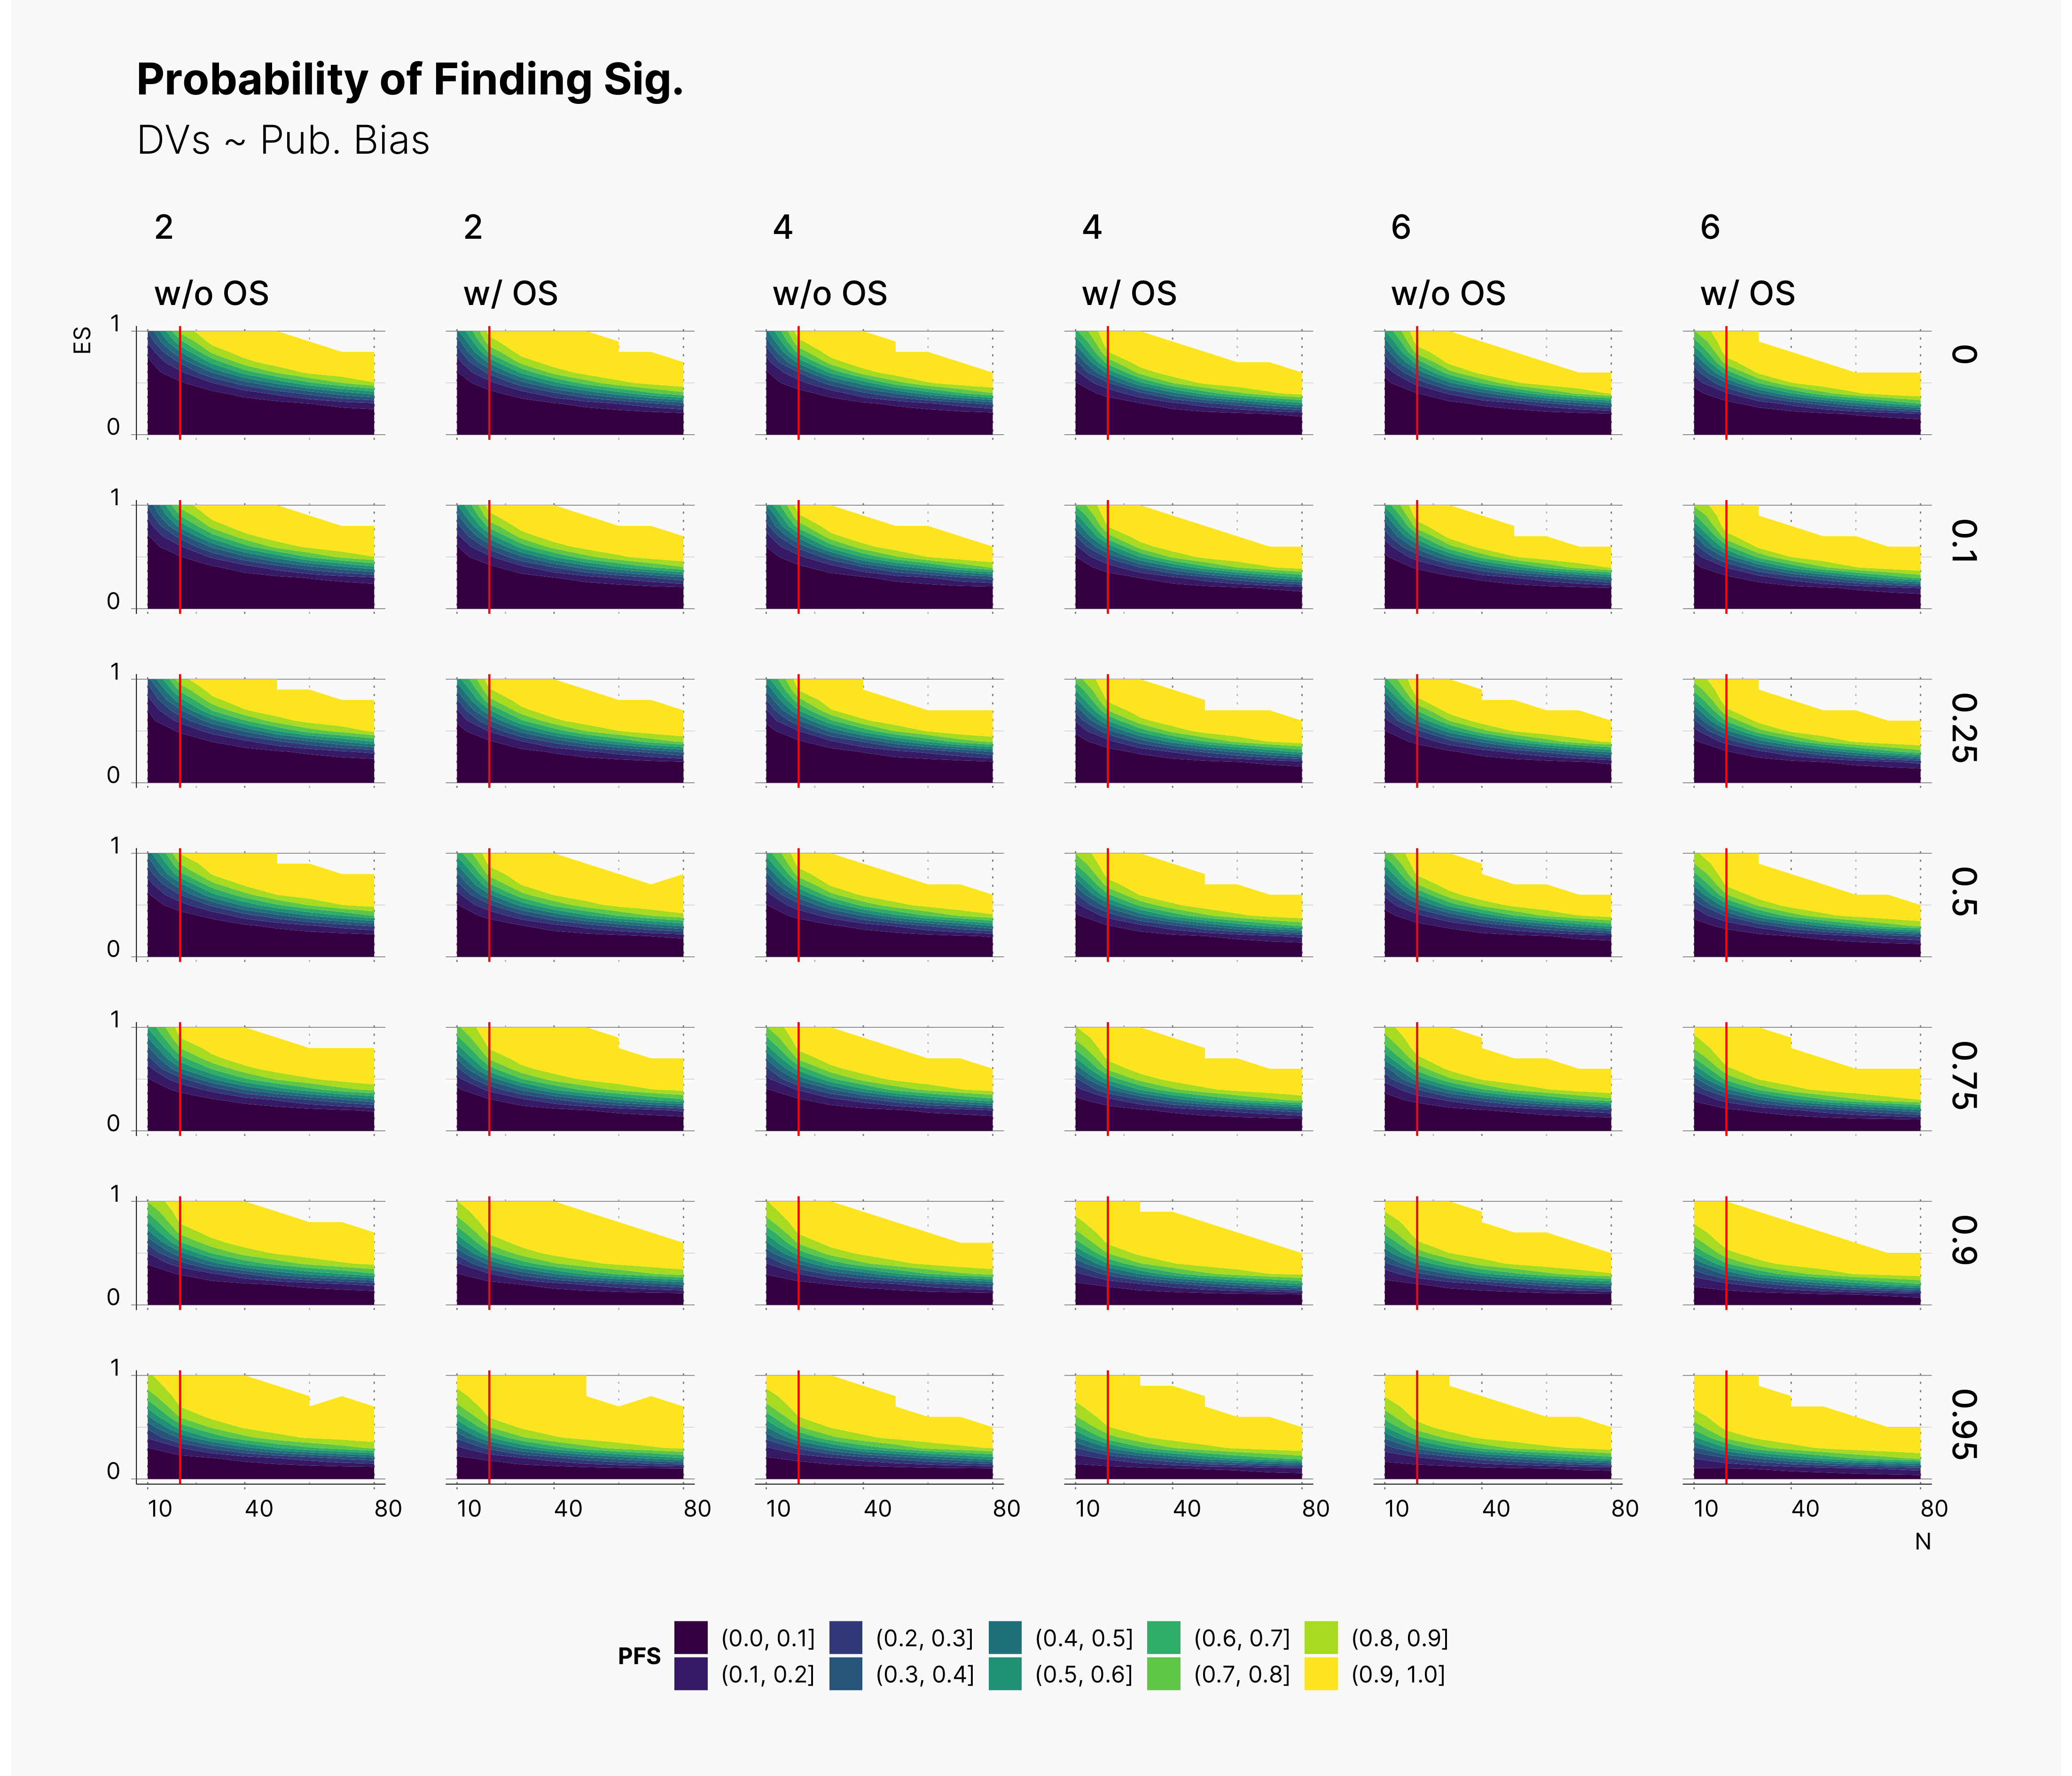
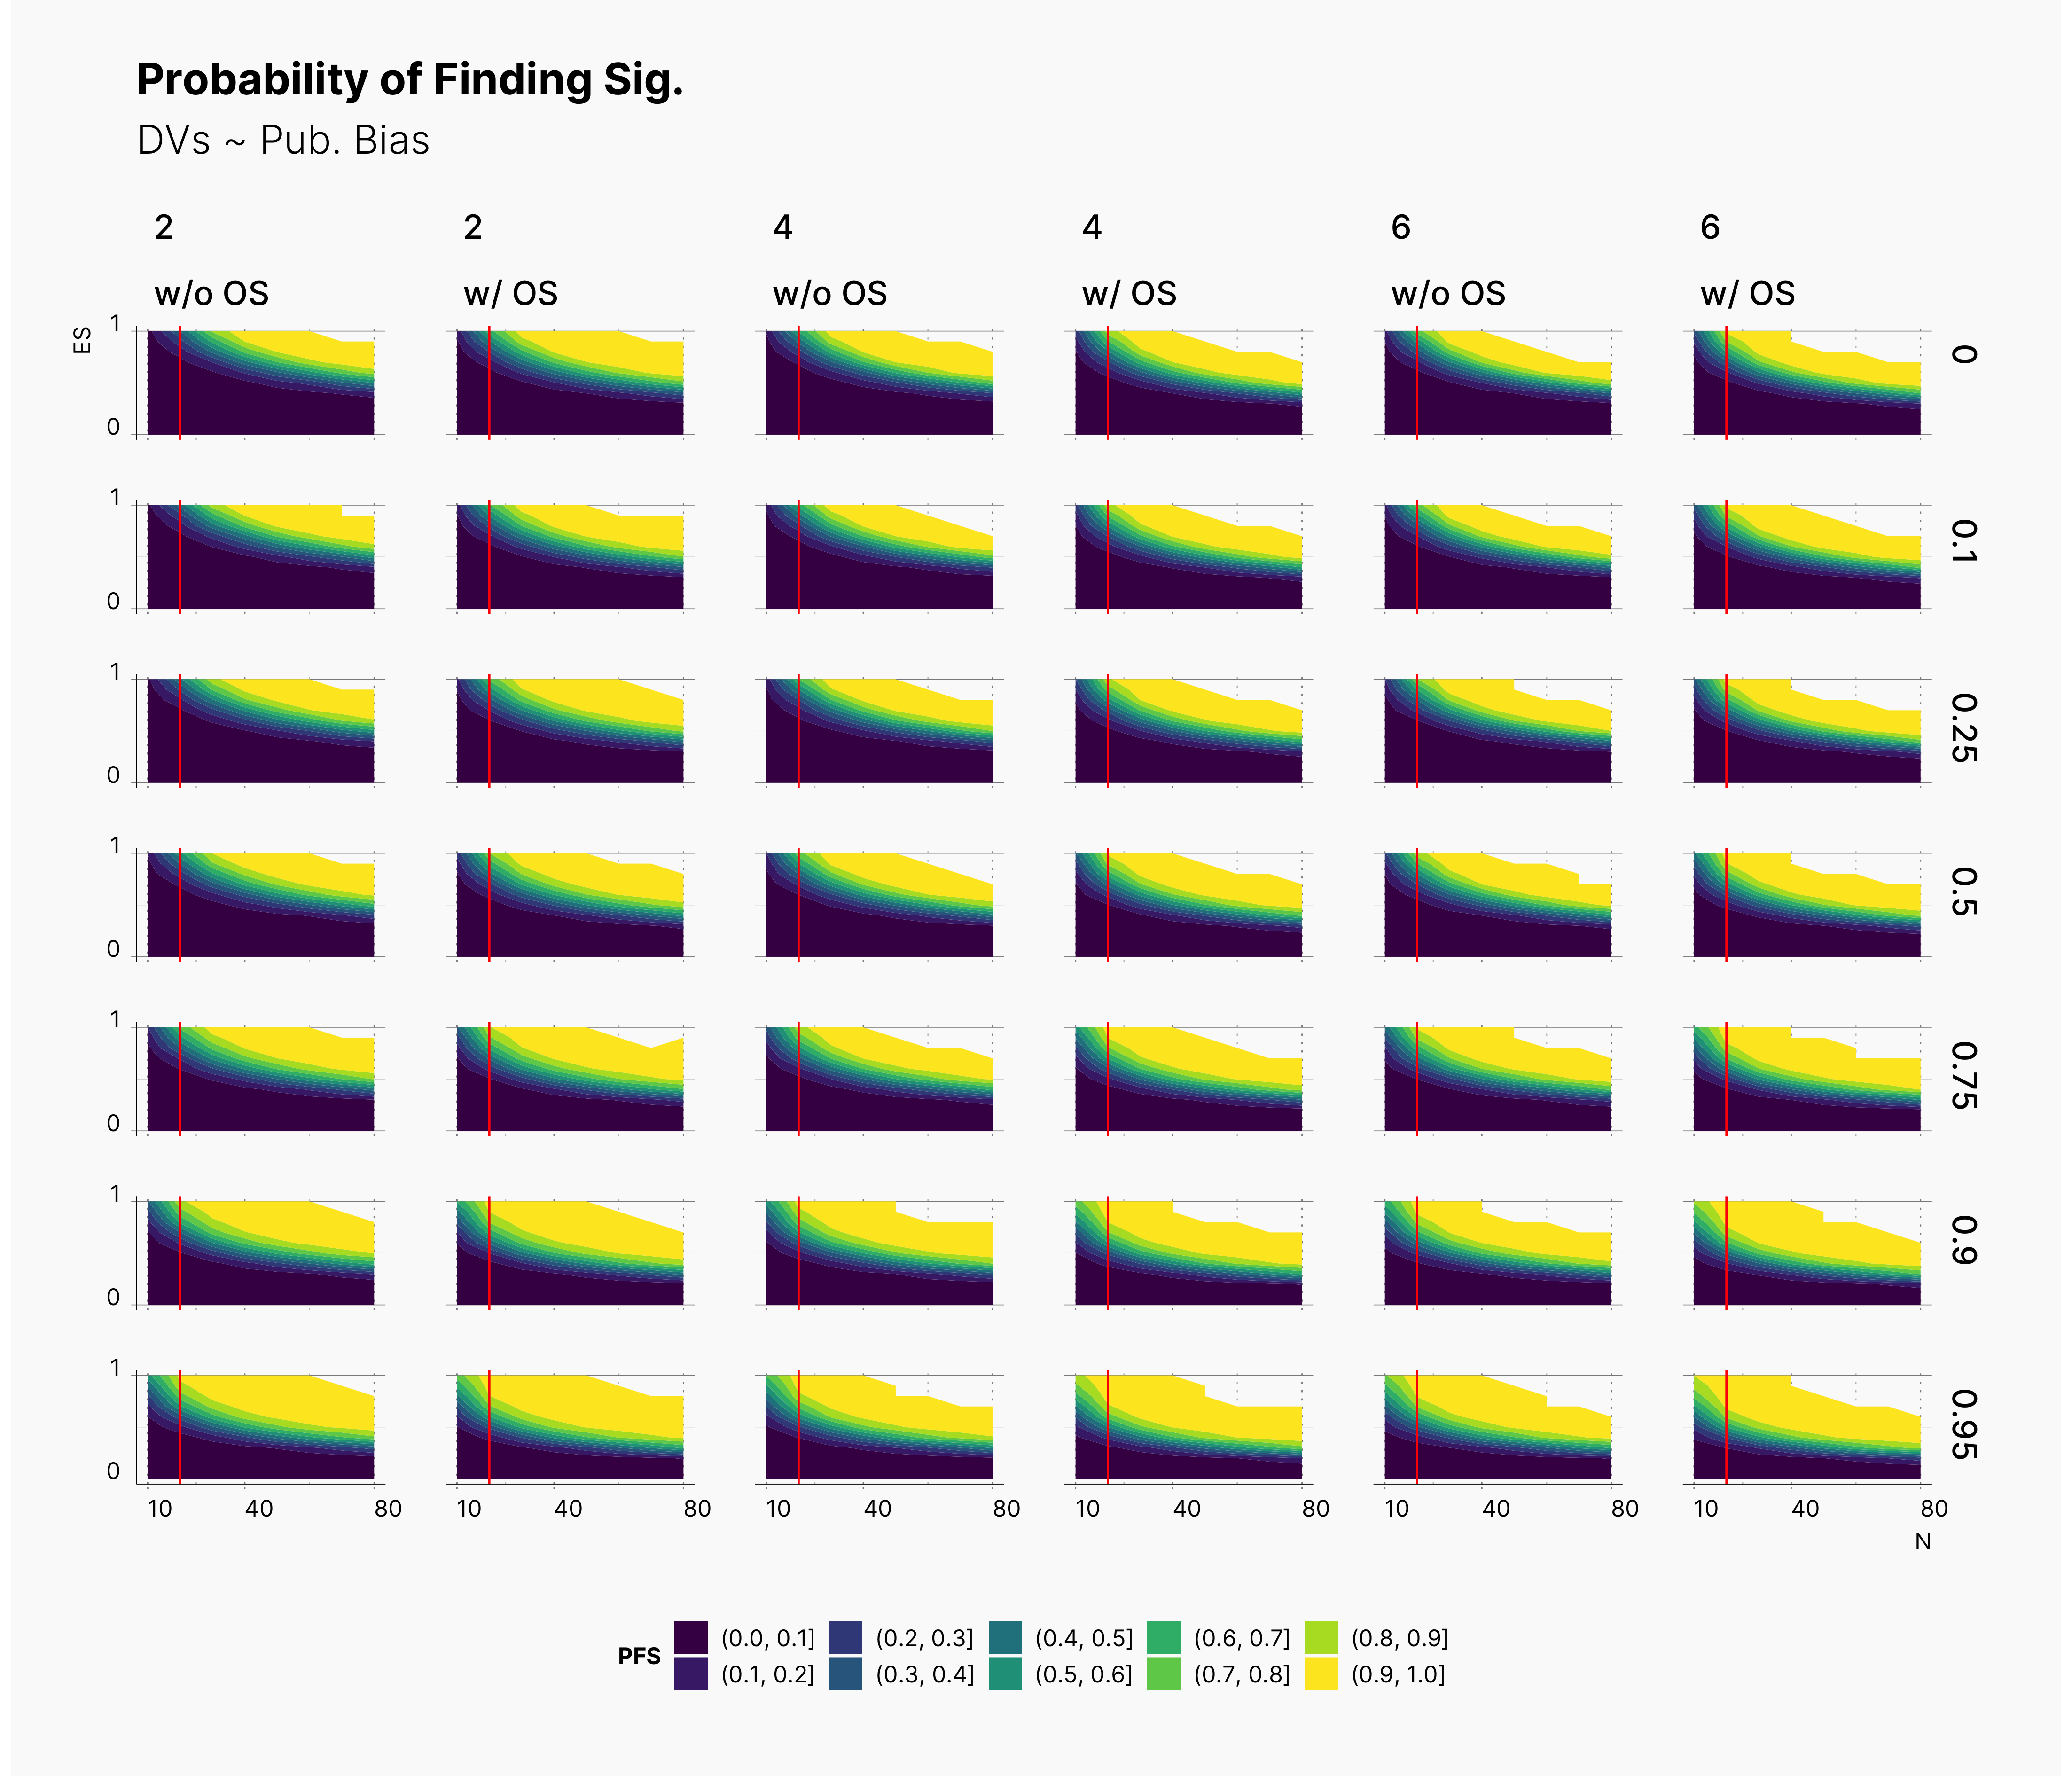
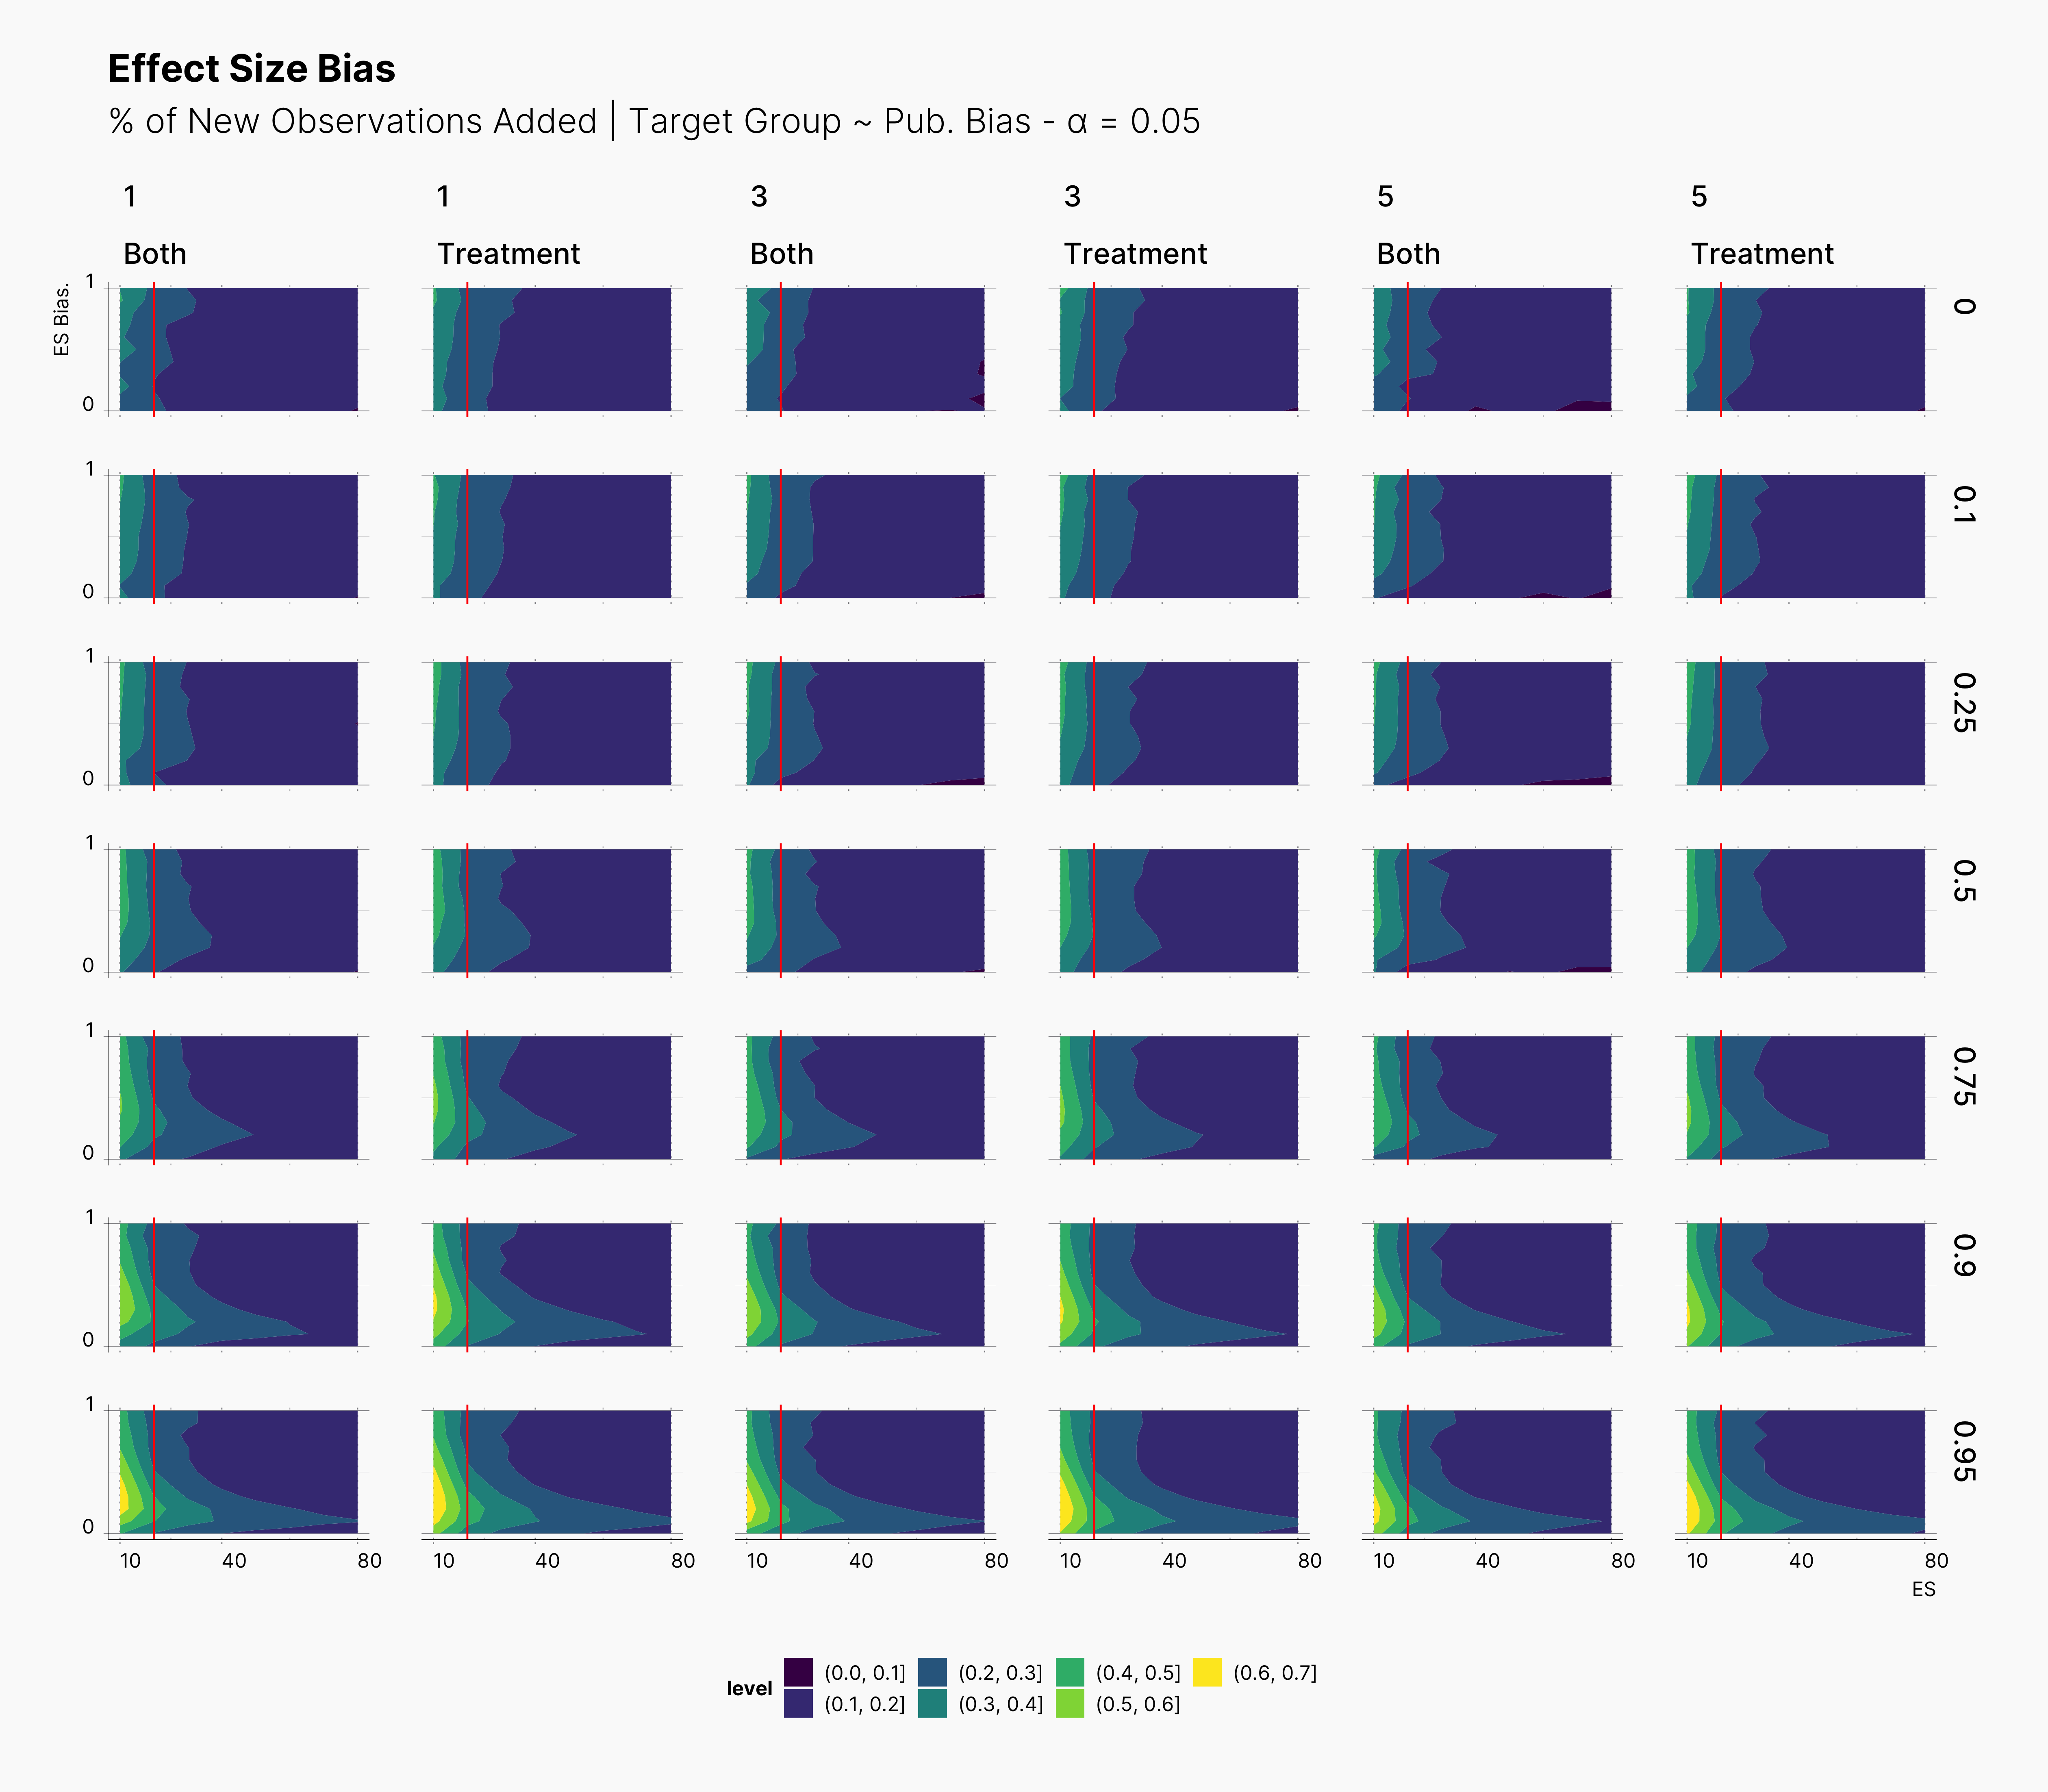
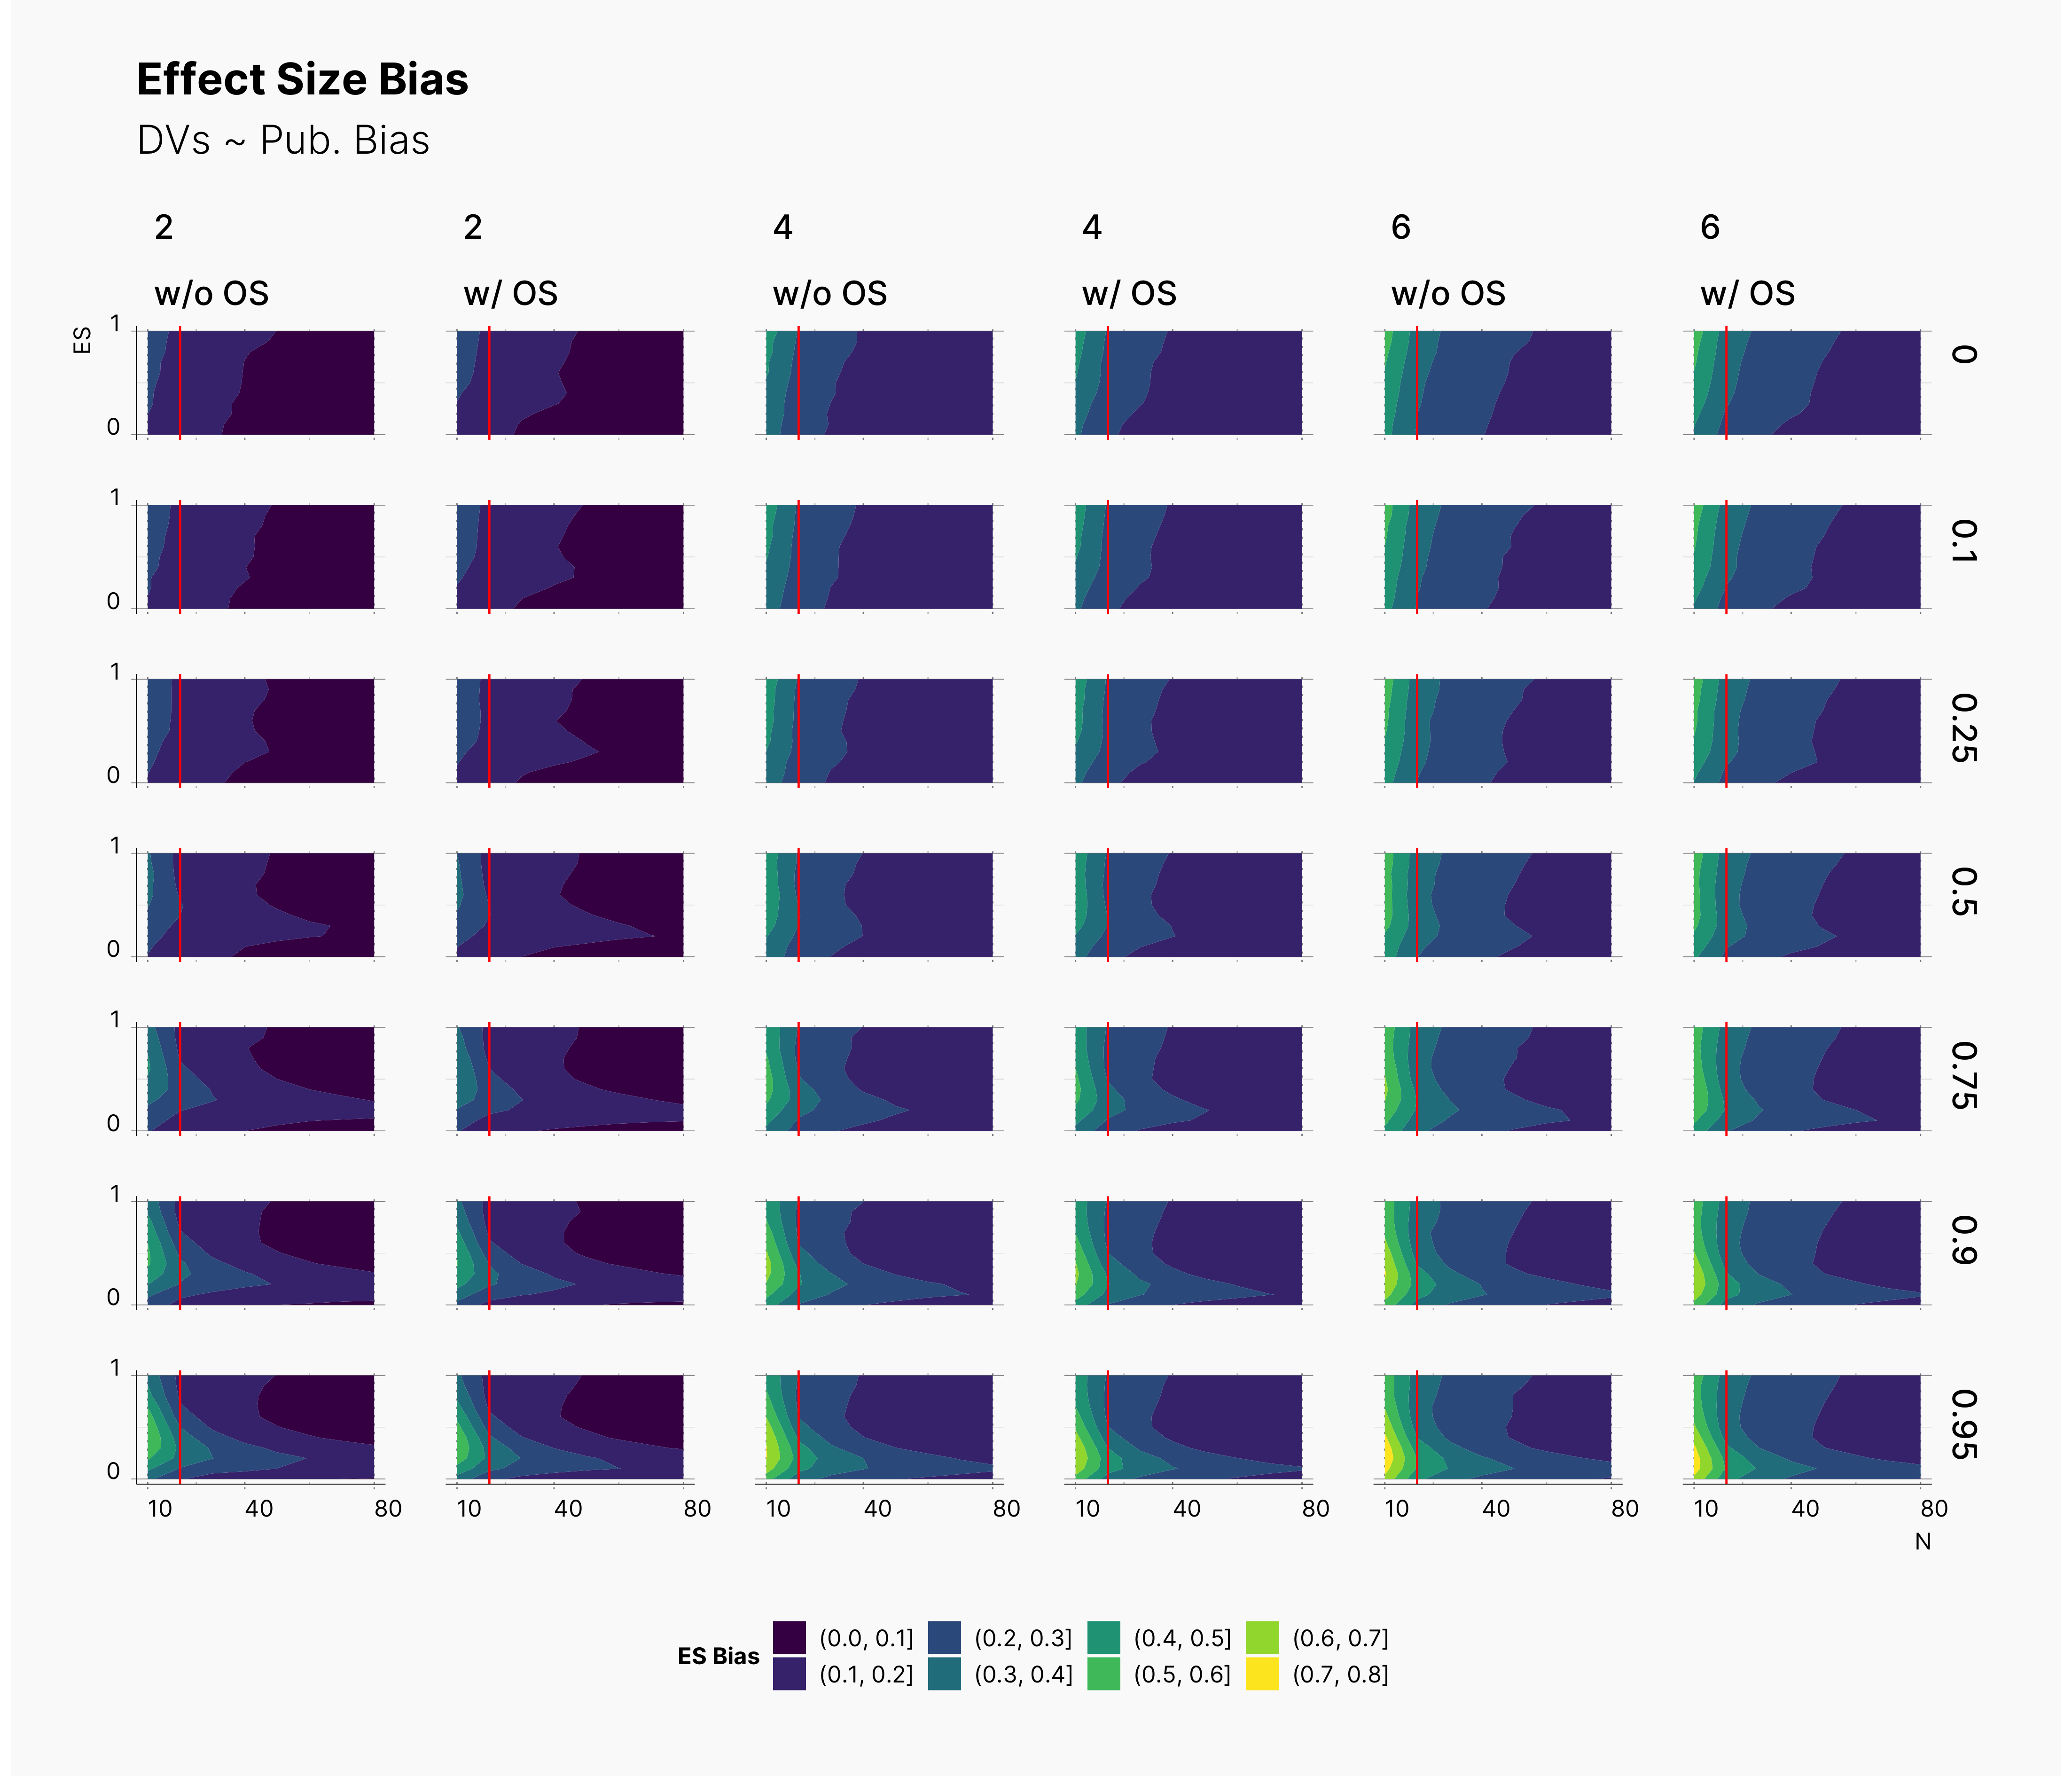
While the changes to the landscape of PFS is almost invisible, we are surely able to observe some changes in the level of bias. As before, althought these changes are not drastic, they tend to confirm that optional stopping tends to reduce the level of bias. However, this is only more prevalent in lower effect sizes within lower sample sizes, lower left region of figures. In contrast, within the range of higher effect sizes, optional stopping tend to increase the bias ever so slightly.
It is important to point out that while we see minimal improvment on the level of bias in studies with optional stopping, this does not mean that those studies are now better. In contrast, our results indicates the detrimental effect of optional stopping on published studies.
If a study is already biased, optional stopping does not reduce the bias enough that makes it a good study; in fact, it burries its bias under higher sample size, and gives Journals a wrong incentive to publish the study.
Publication Bias and Meta-Analysis
Another difference of our last extension is the fact that we changed our Journal’s configuration in order to be able to collect batches of results. Here we competed two batch sizes, K = {8, 24}.
Configuration: Journal
{
  ...
  "journal_parameters": {
    "max_pubs": k,
    "selection_strategy": {
        "name": "SignificantSelection",
        "pub_bias": p,
        "alpha": ɑ,
        "side": 0,
    },
    "meta_analysis_metrics": [
        {
            "name": "RandomEffectEstimator",
            "estimator": "DL"
        },
        {
            "name": "EggersTestEstimator",
            "alpha": 0.1
        },
        {
            "name": "RankCorrelation",
            "alpha": 0.1
        }
    ]
  }
  ...
}
As discussed in Meta Analysis, we can use these batches as our meta analysis pool, and consequently apply different meta analyses methods on them. Later these results can be exported and analyzed as shown in Maassen’s Simulation.
Publication Bias
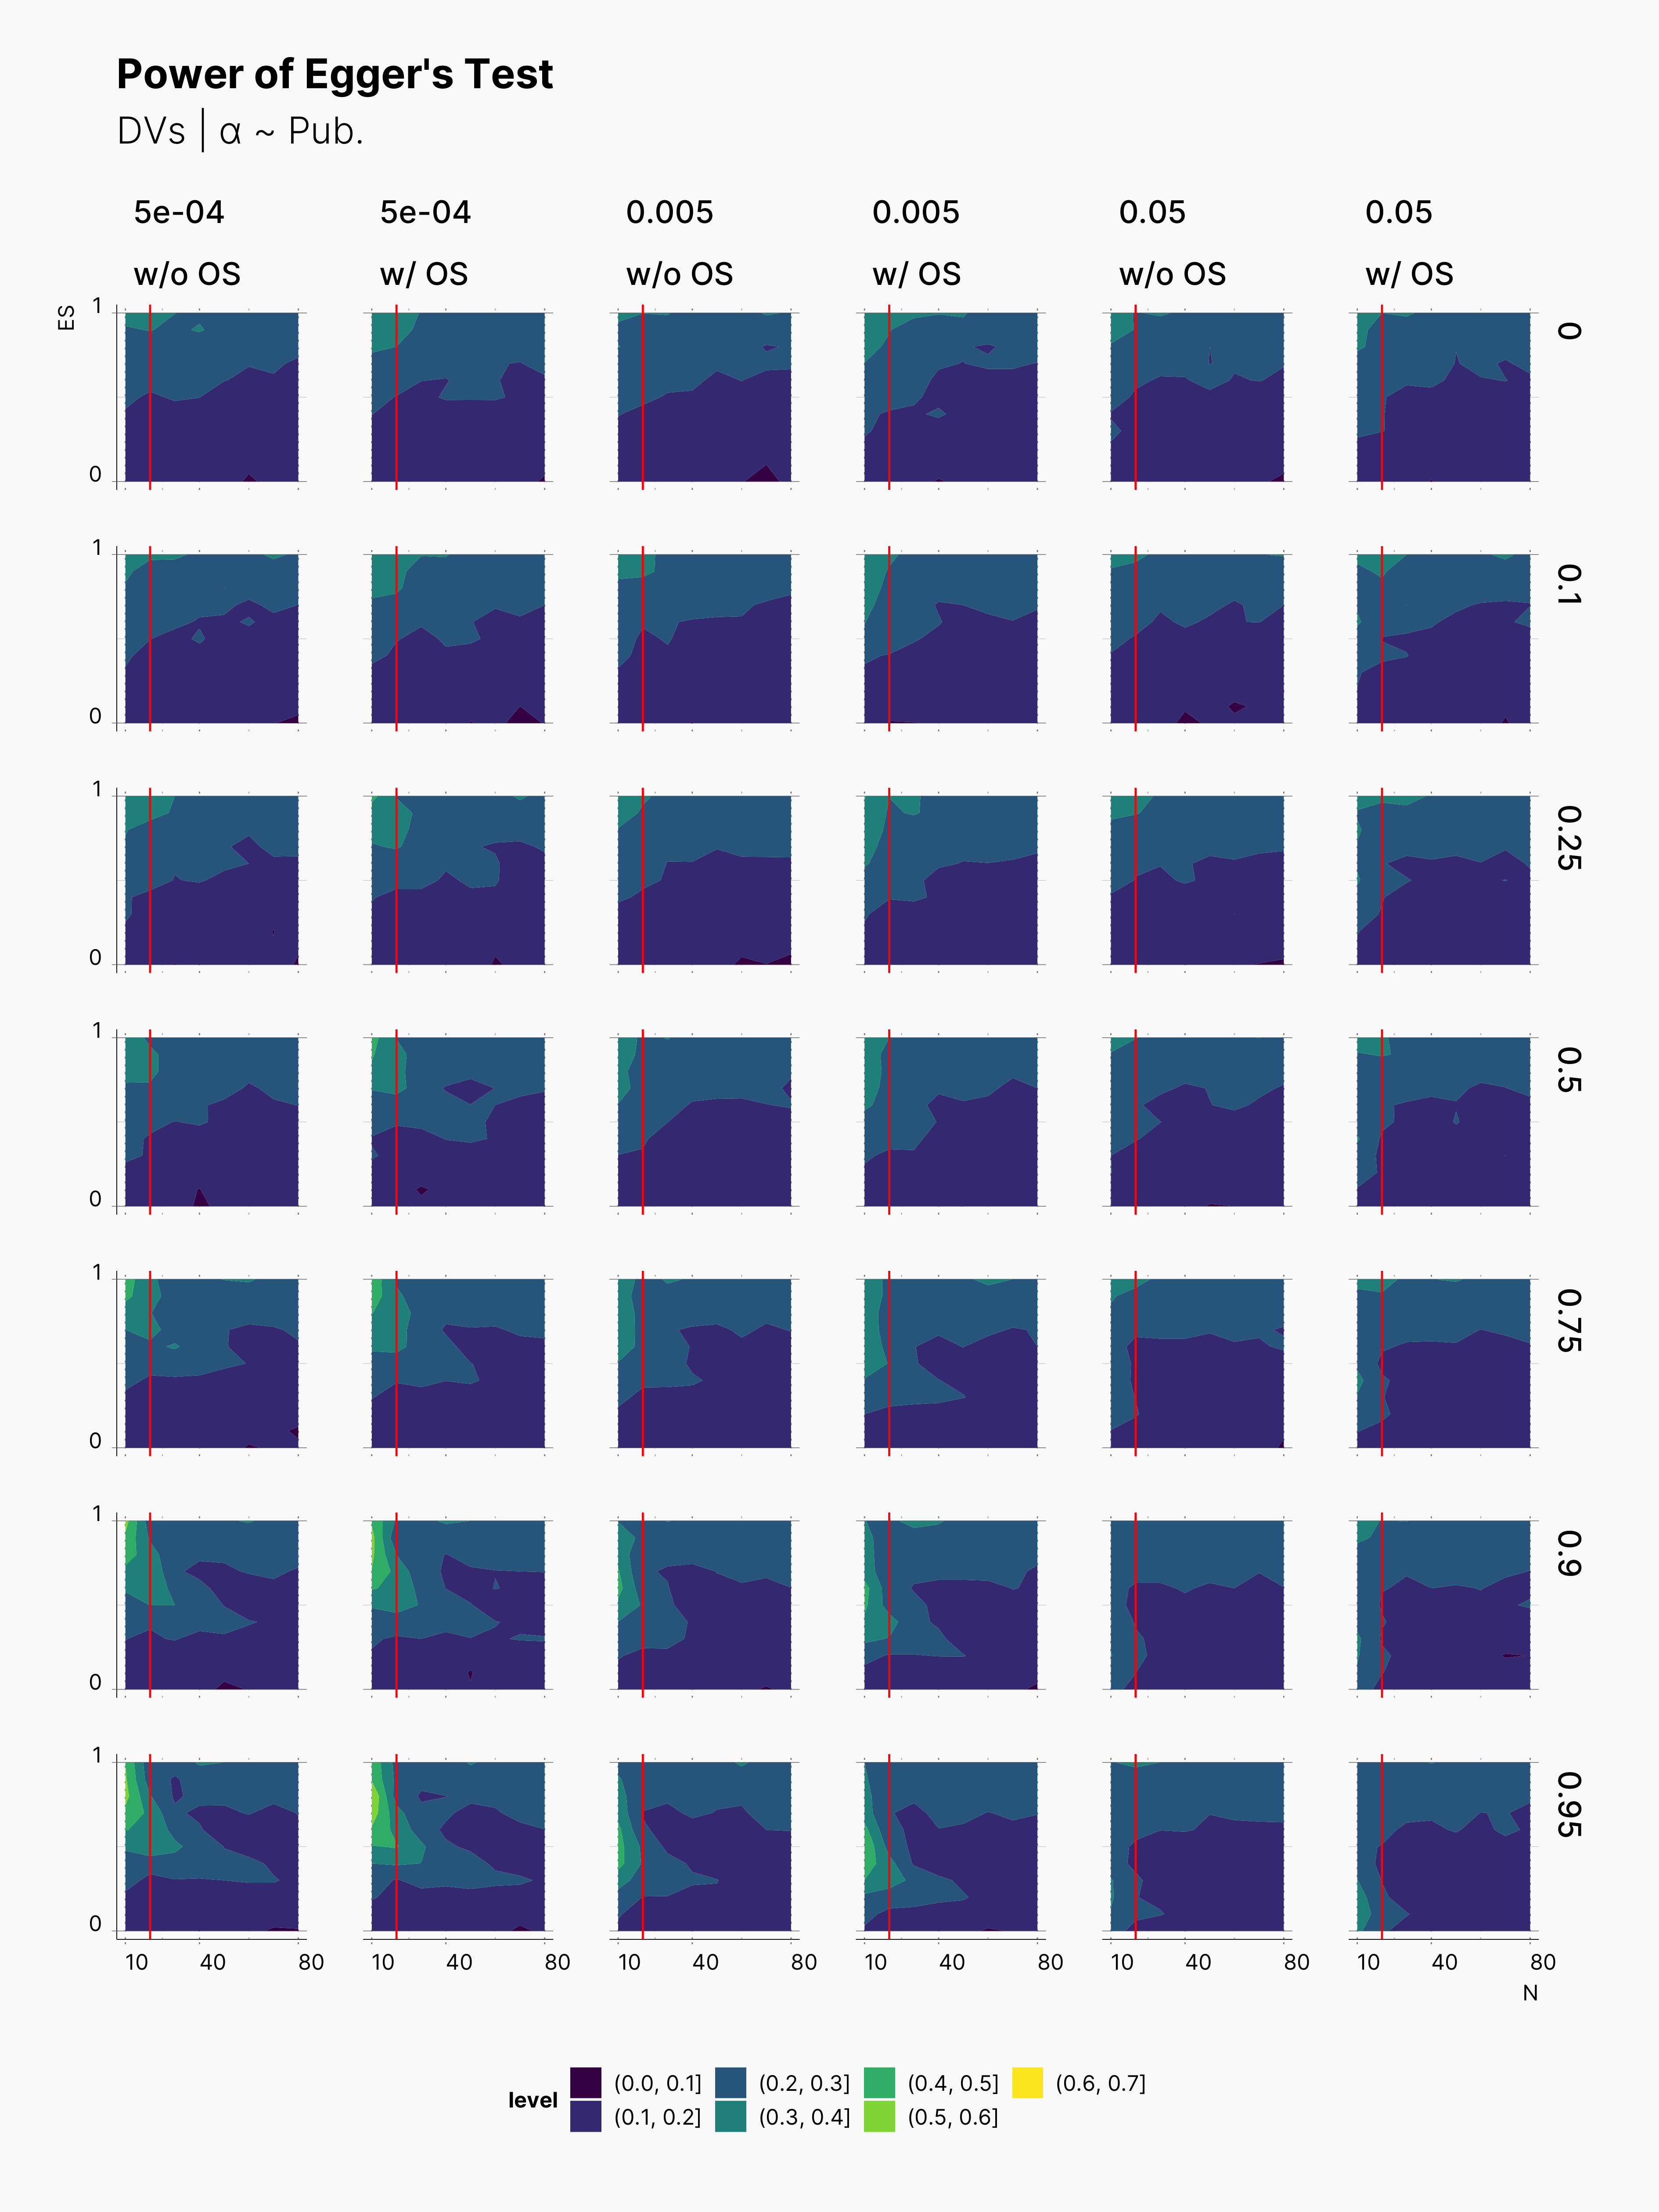
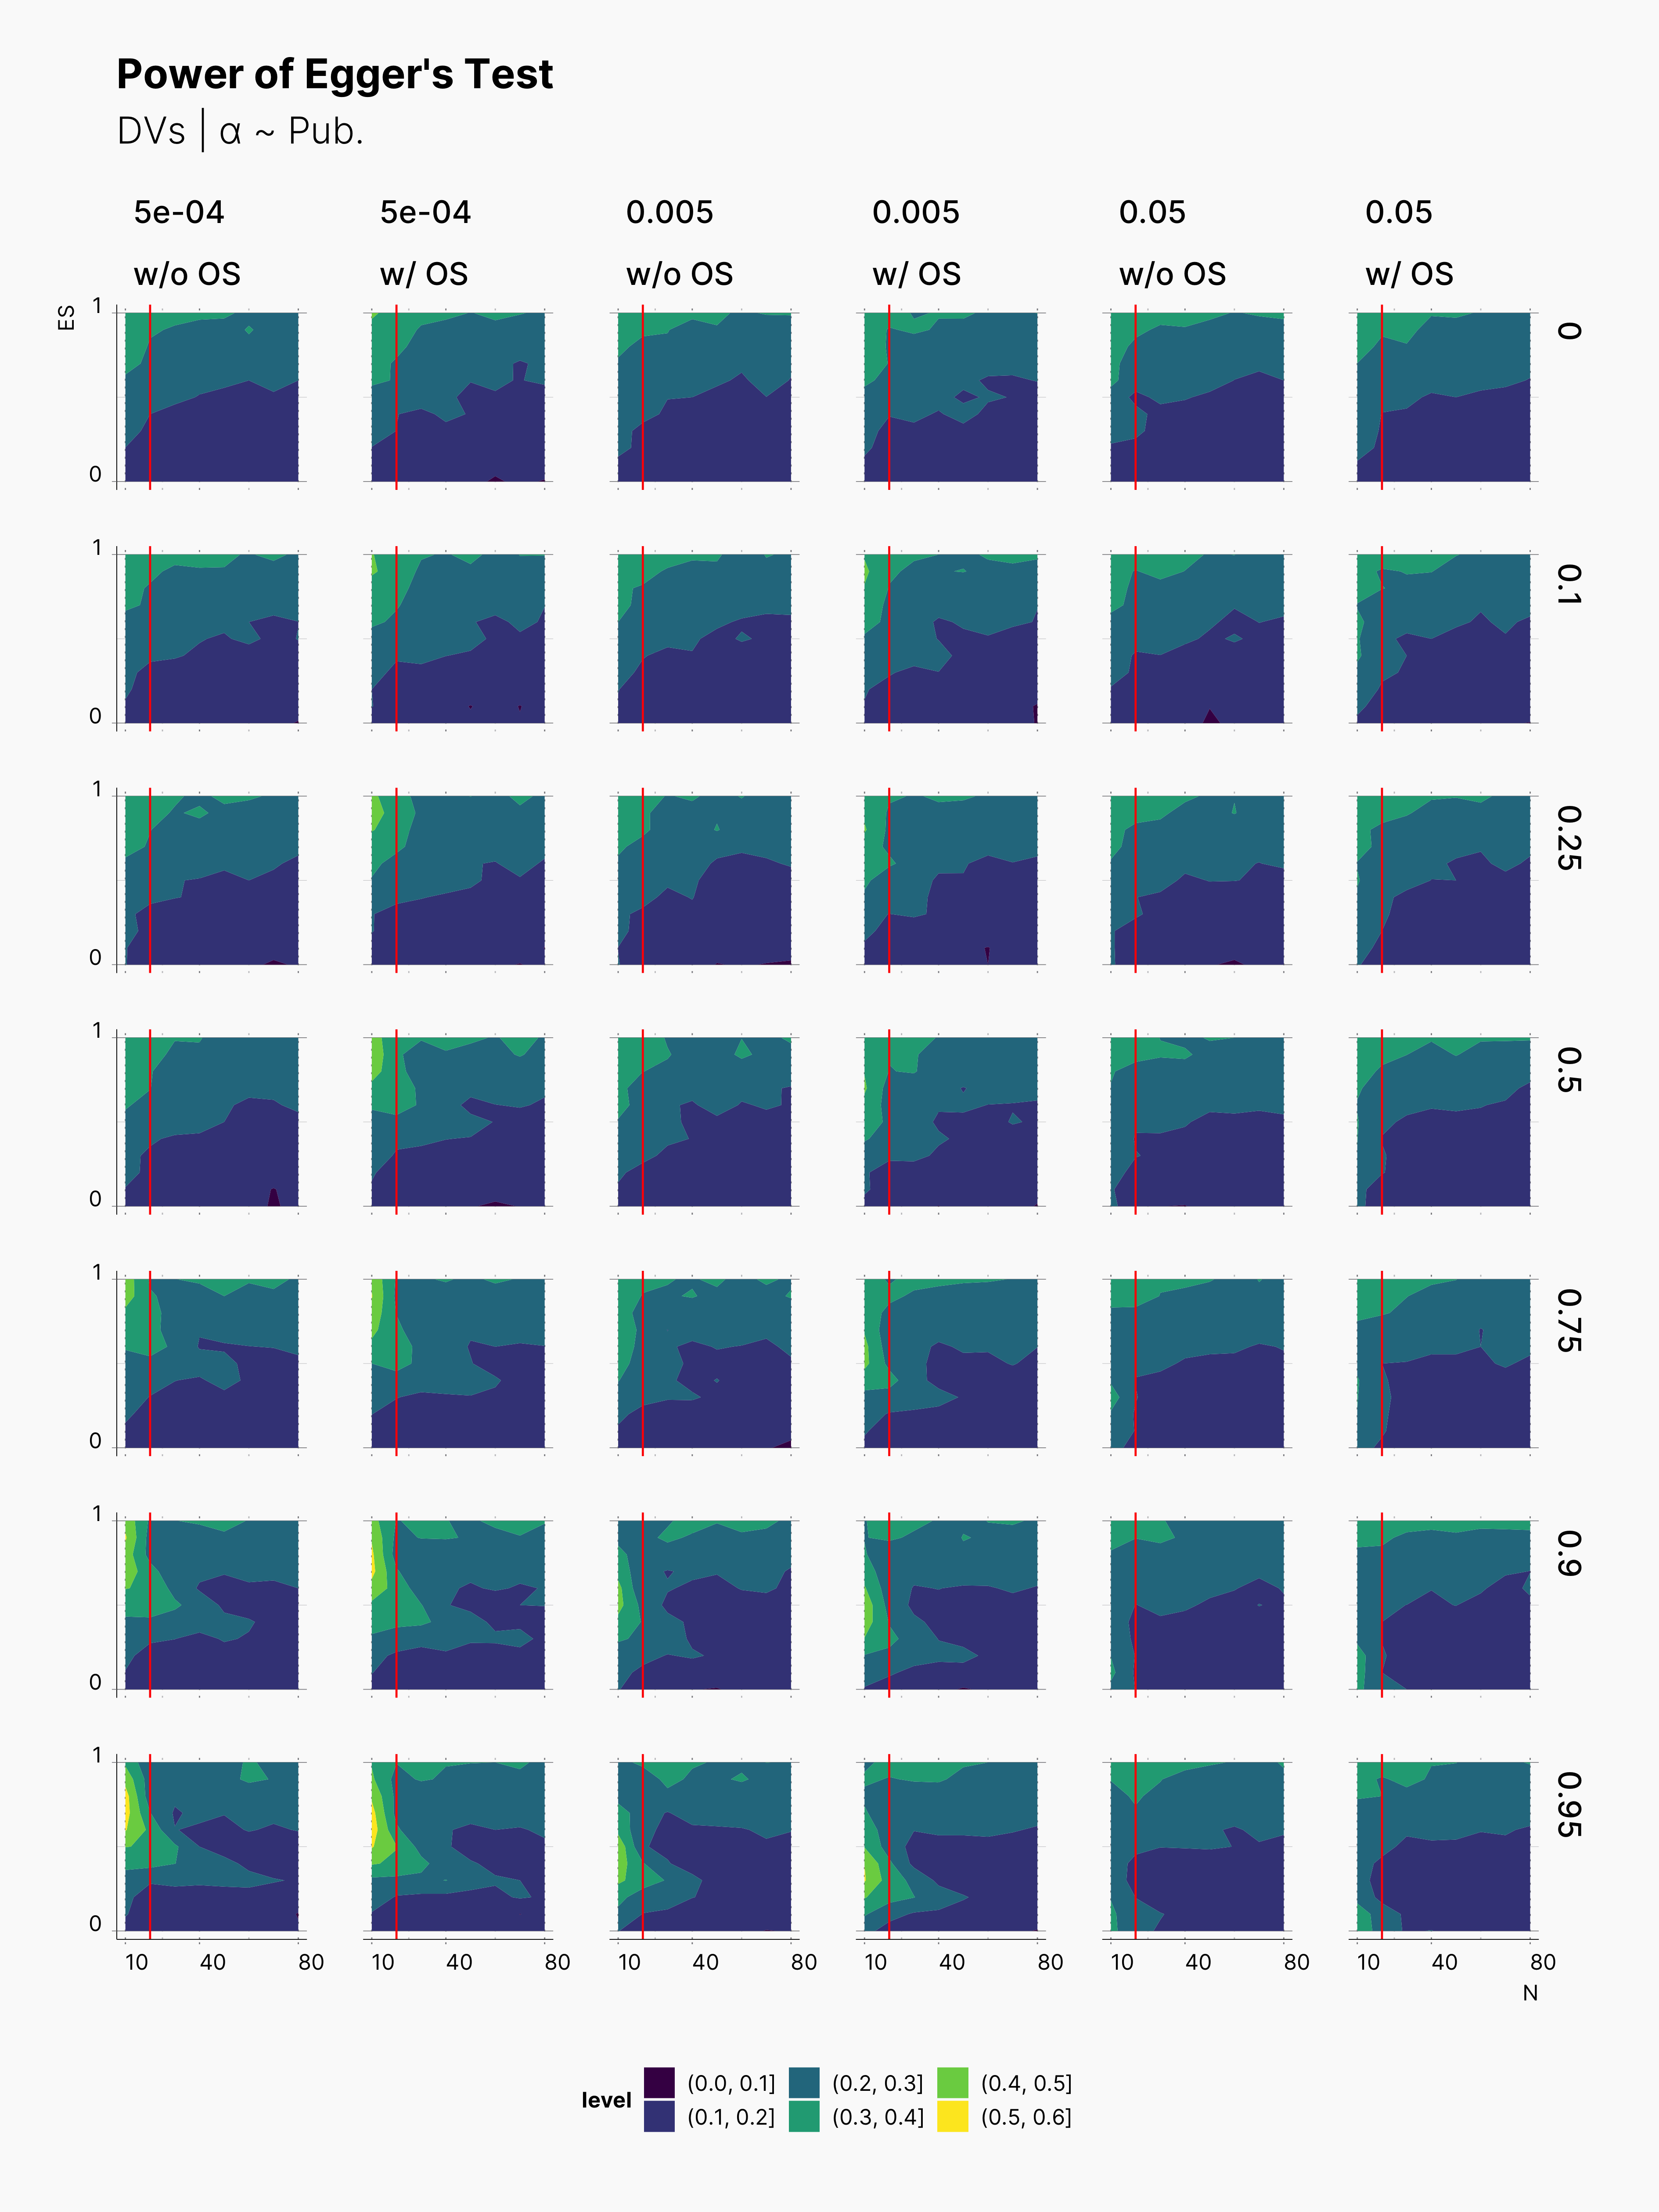
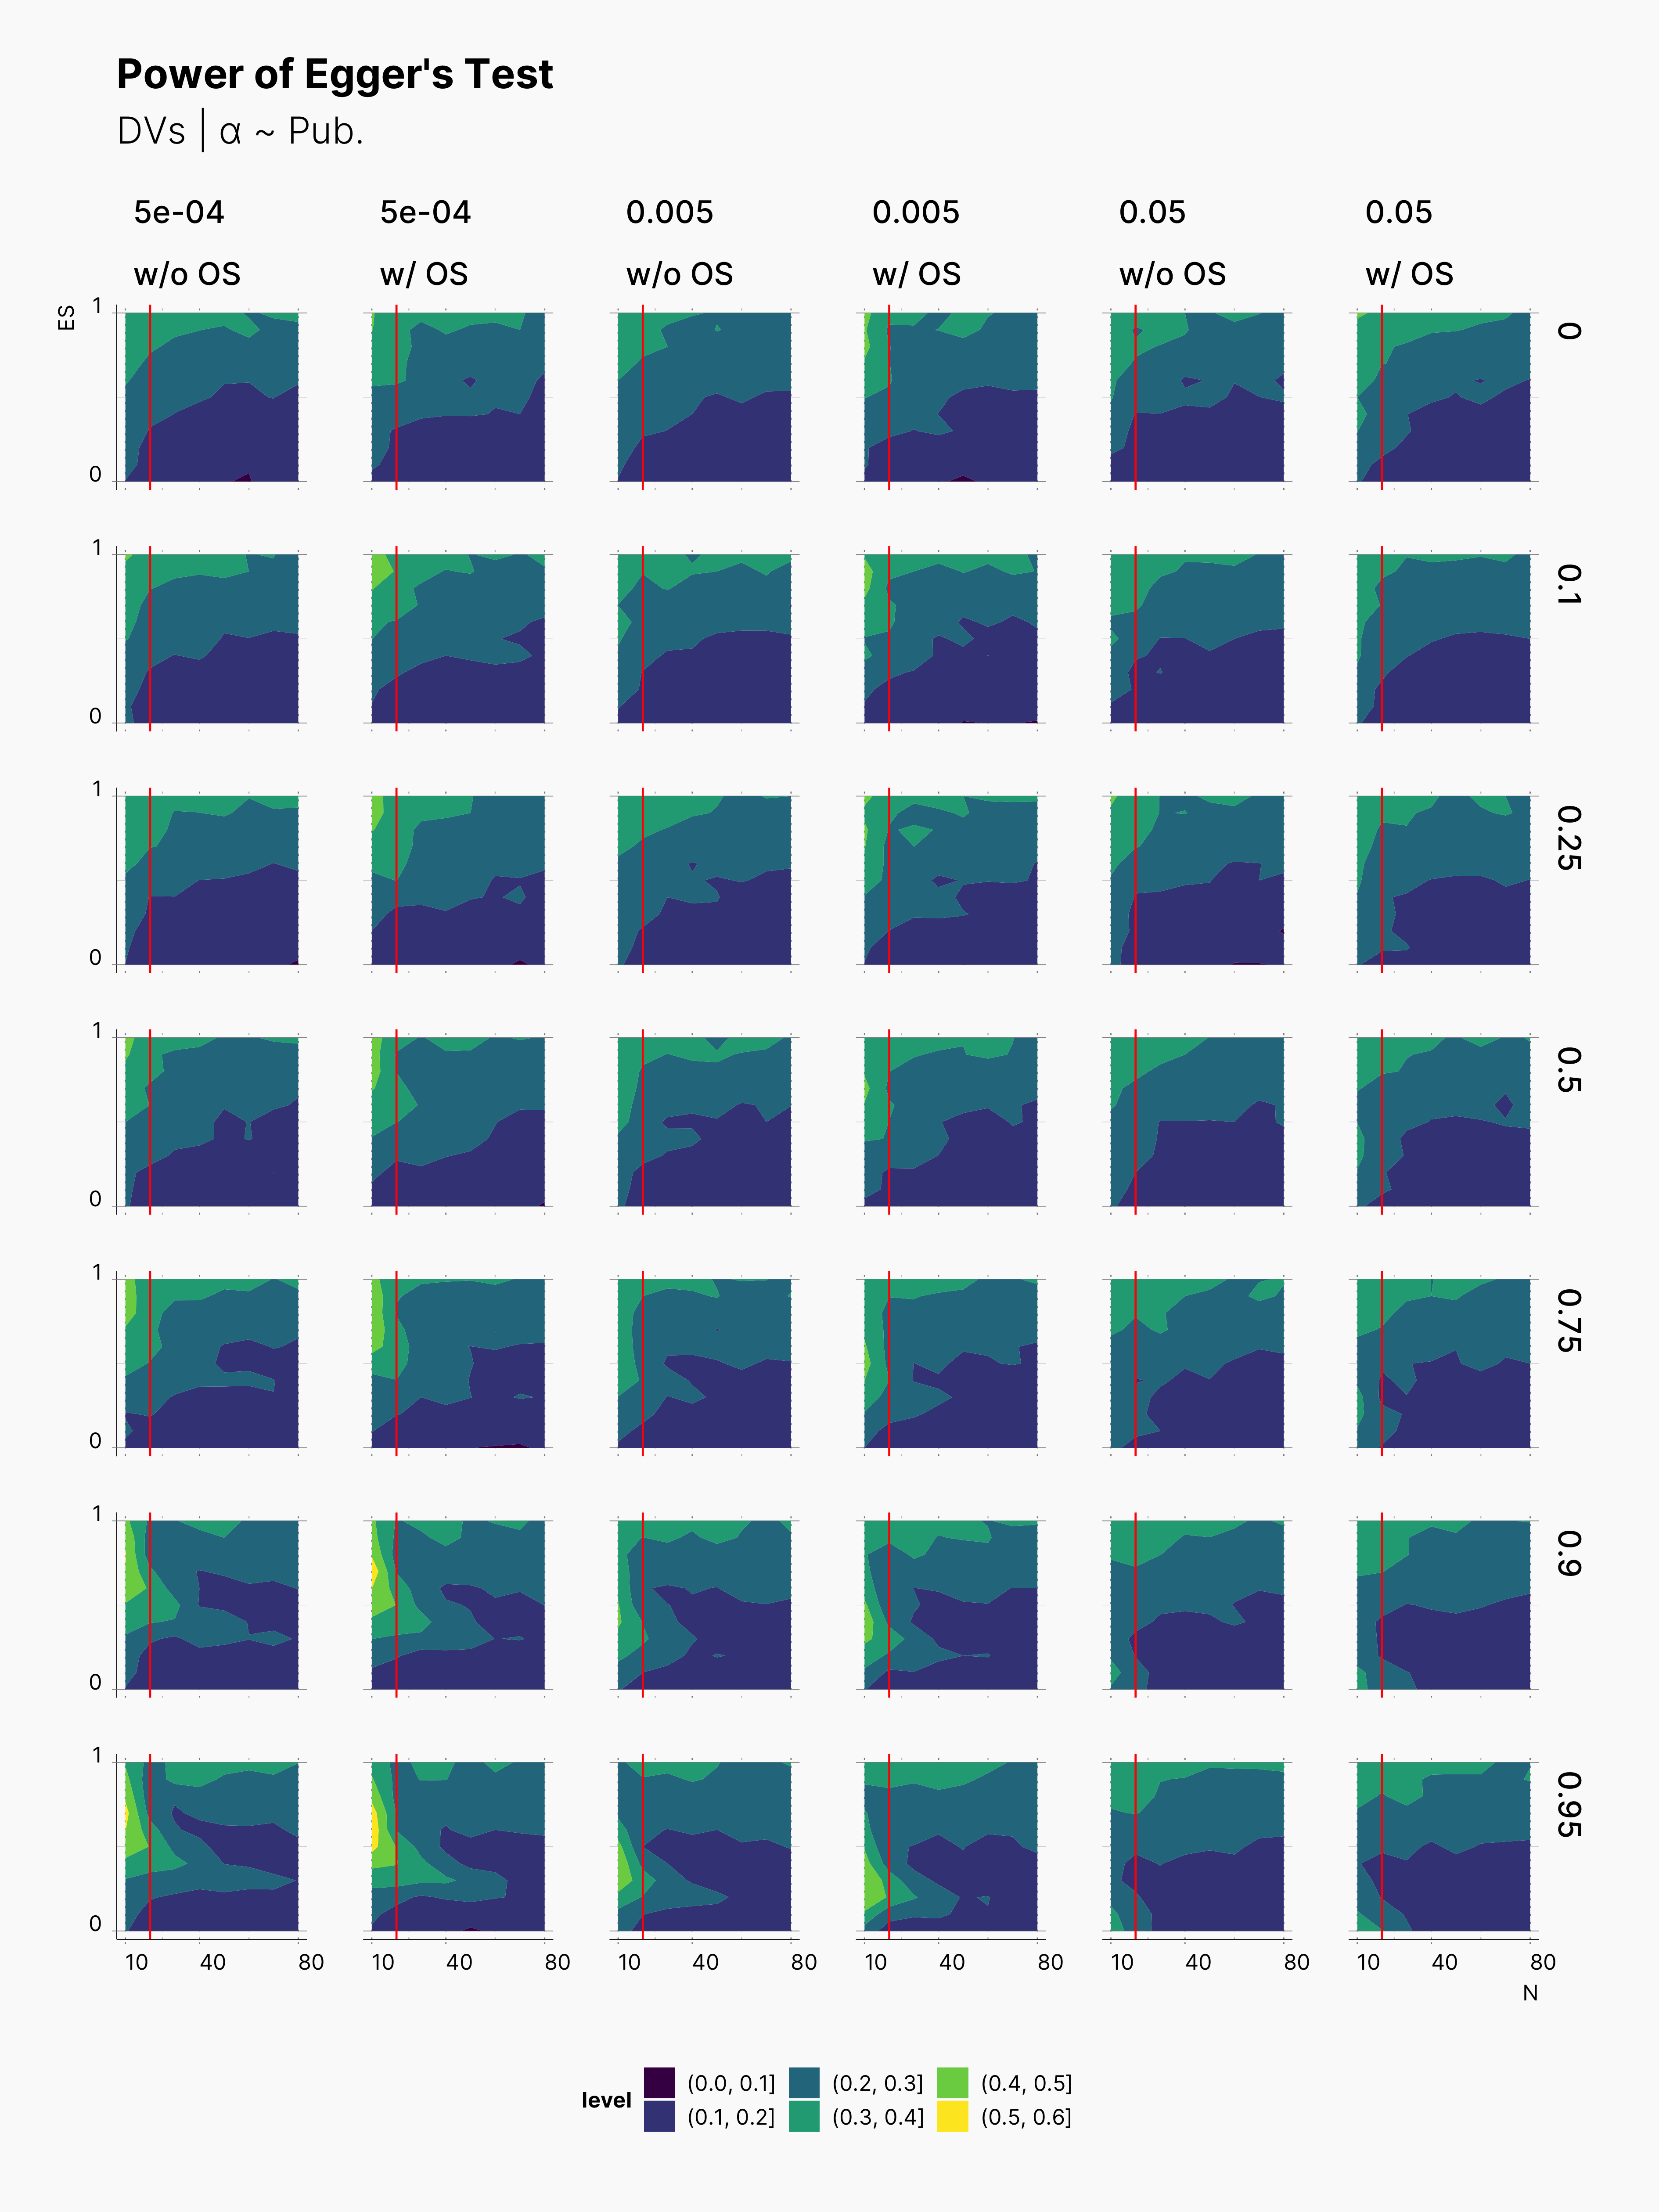
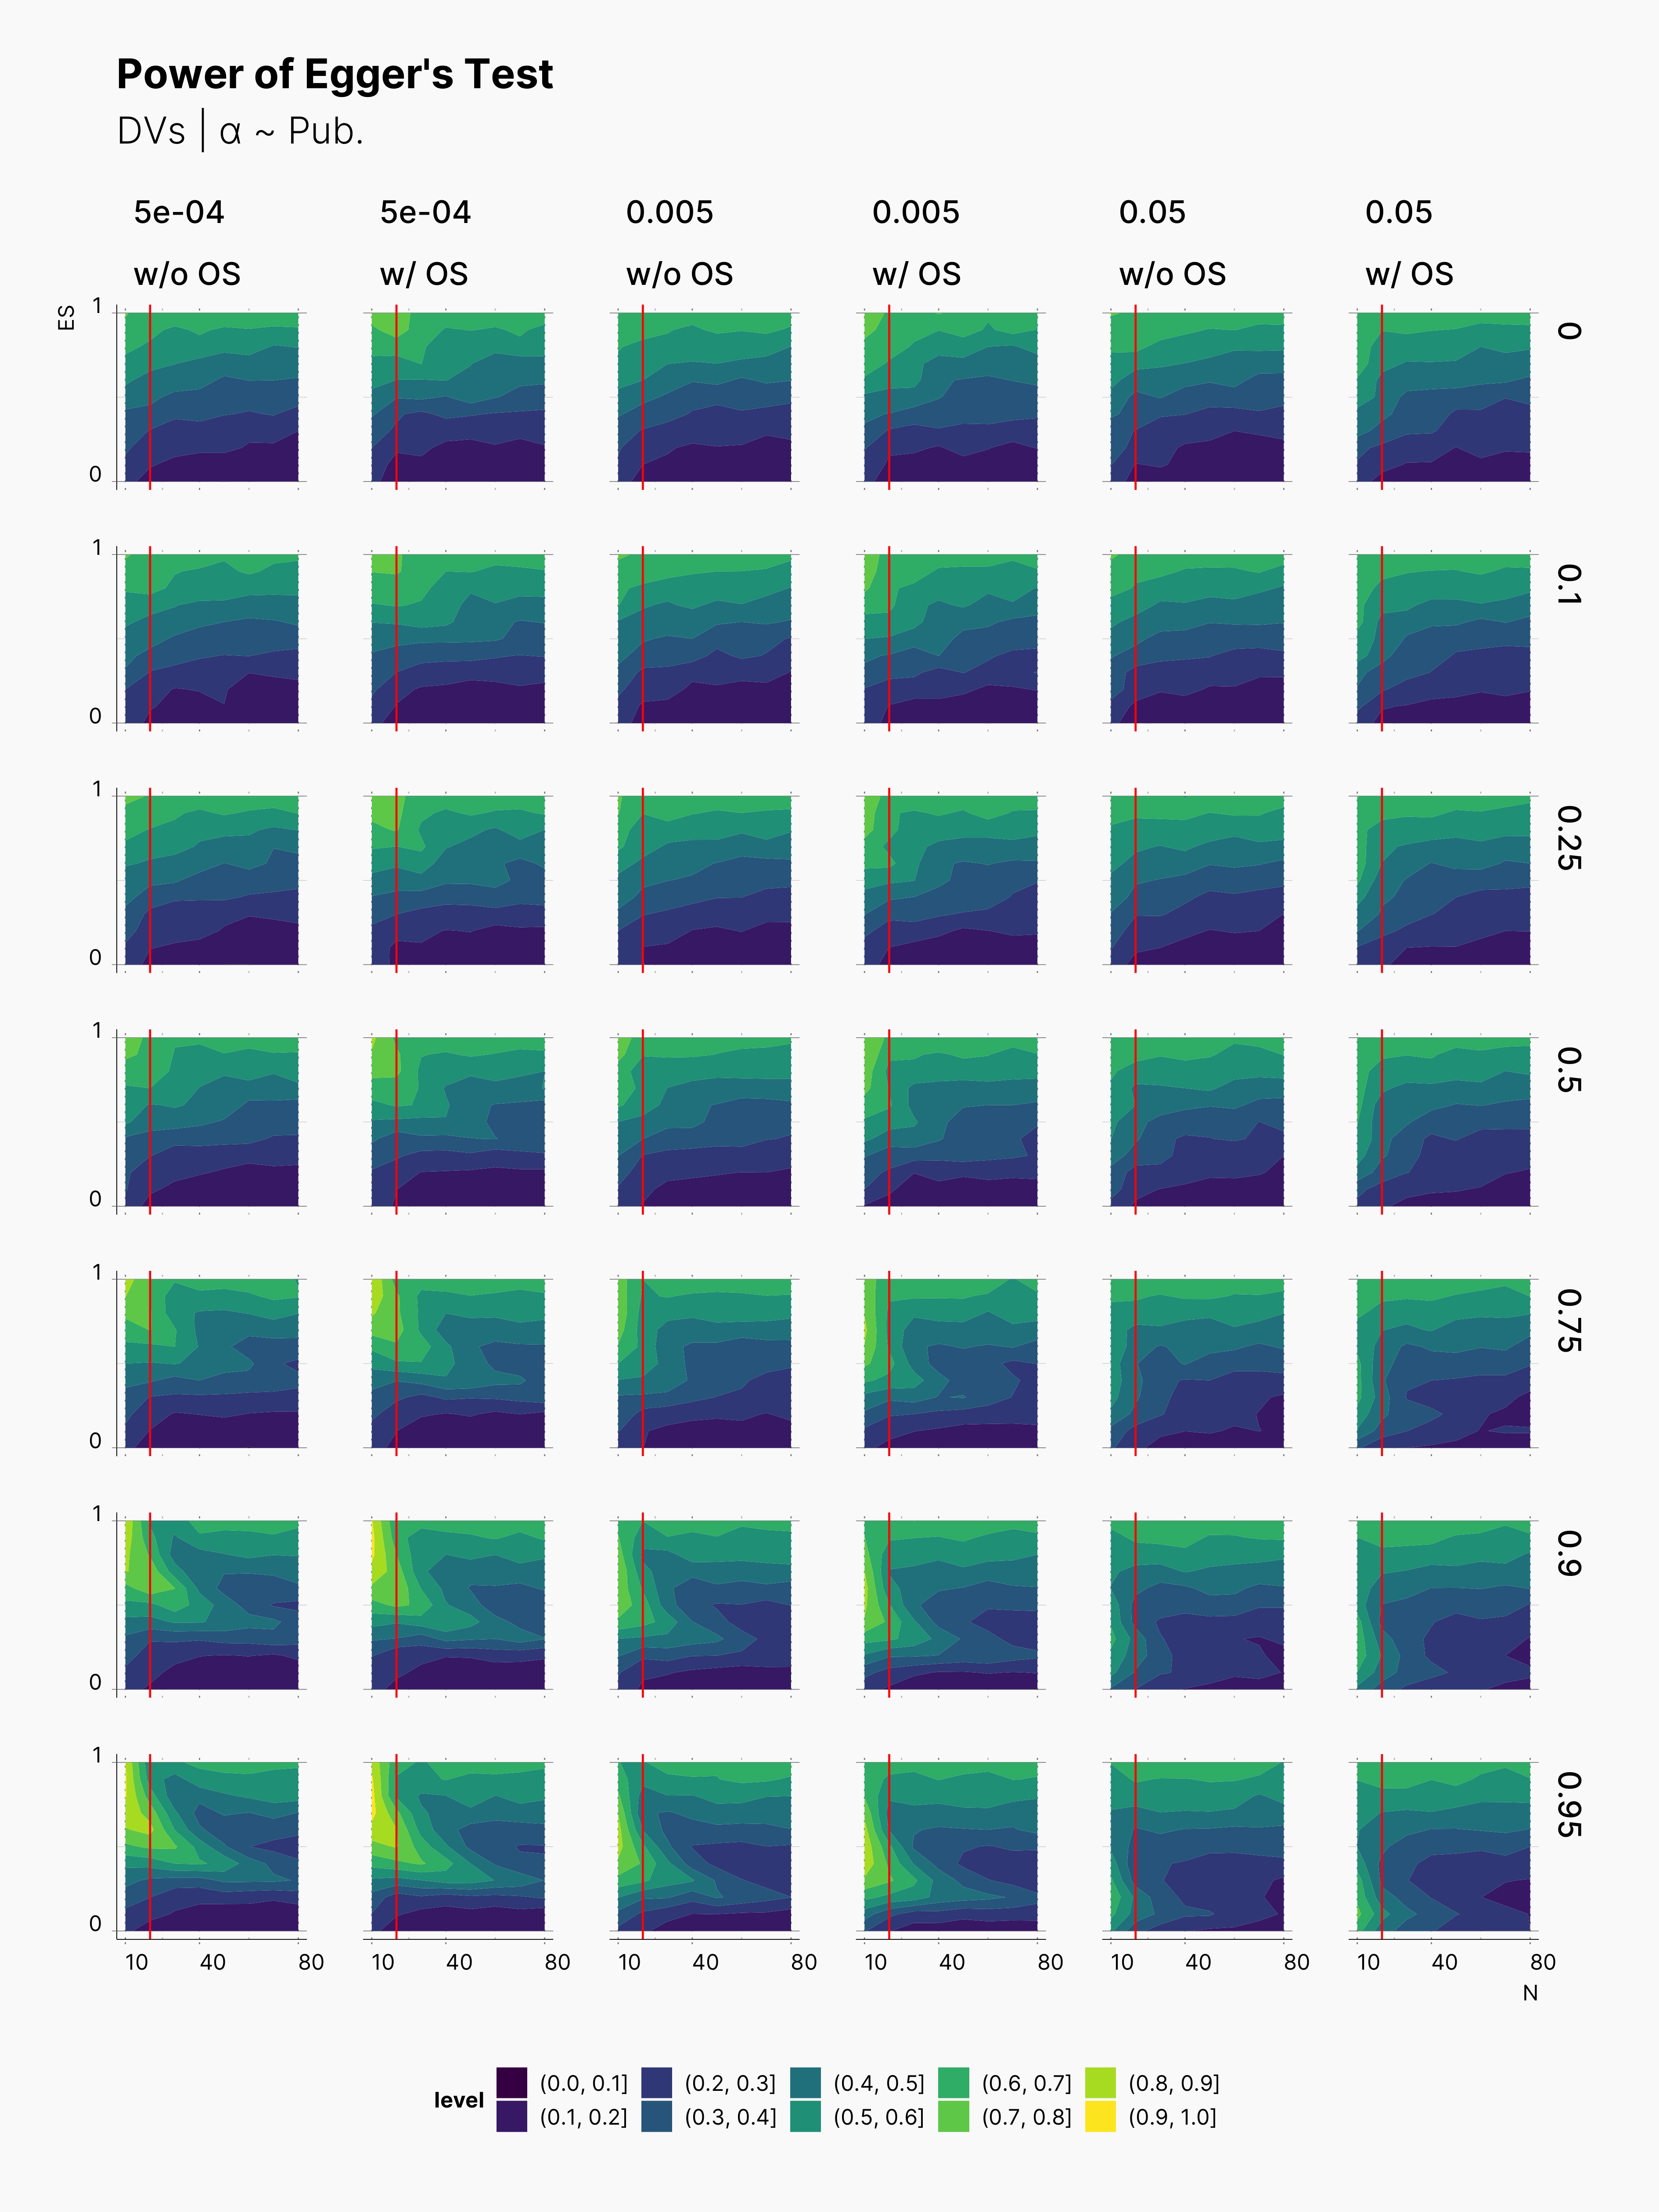
While we do not expect Egger's Test to be able to detect the influence of optional stopping on publication bias, we are curious to see how it performs within the range of our parameters. As we can see in the figure below, Egger's test clearly performs better with larger sample sizes. Moreover, as expected, Egger gets more confident as publication level raises. As shown in Maassen’s Simulation, Egger performs much better in lower ɑ-levels as well. In addtion, notice the fact that Egger's Test is only capable of detecting high (> 50%) publication bias within very extreme Pb values, and even then only within very high true effect sizes and low sample sizes.
In fact, Egger's Test is fairly ineffective in a large region of our parameters set. The good news is, its most effective region lies within small sample sizes, N ≲ 20.
In all cases, we can see a slightly more power withing studies undergone the optional stopping. However, as one would guess this is not to the courtesy of Egger's Test in detecting the influence of optional stopping. In fact, this is shows how optional stopping can pollute publication bias metrics like Egger's Test.
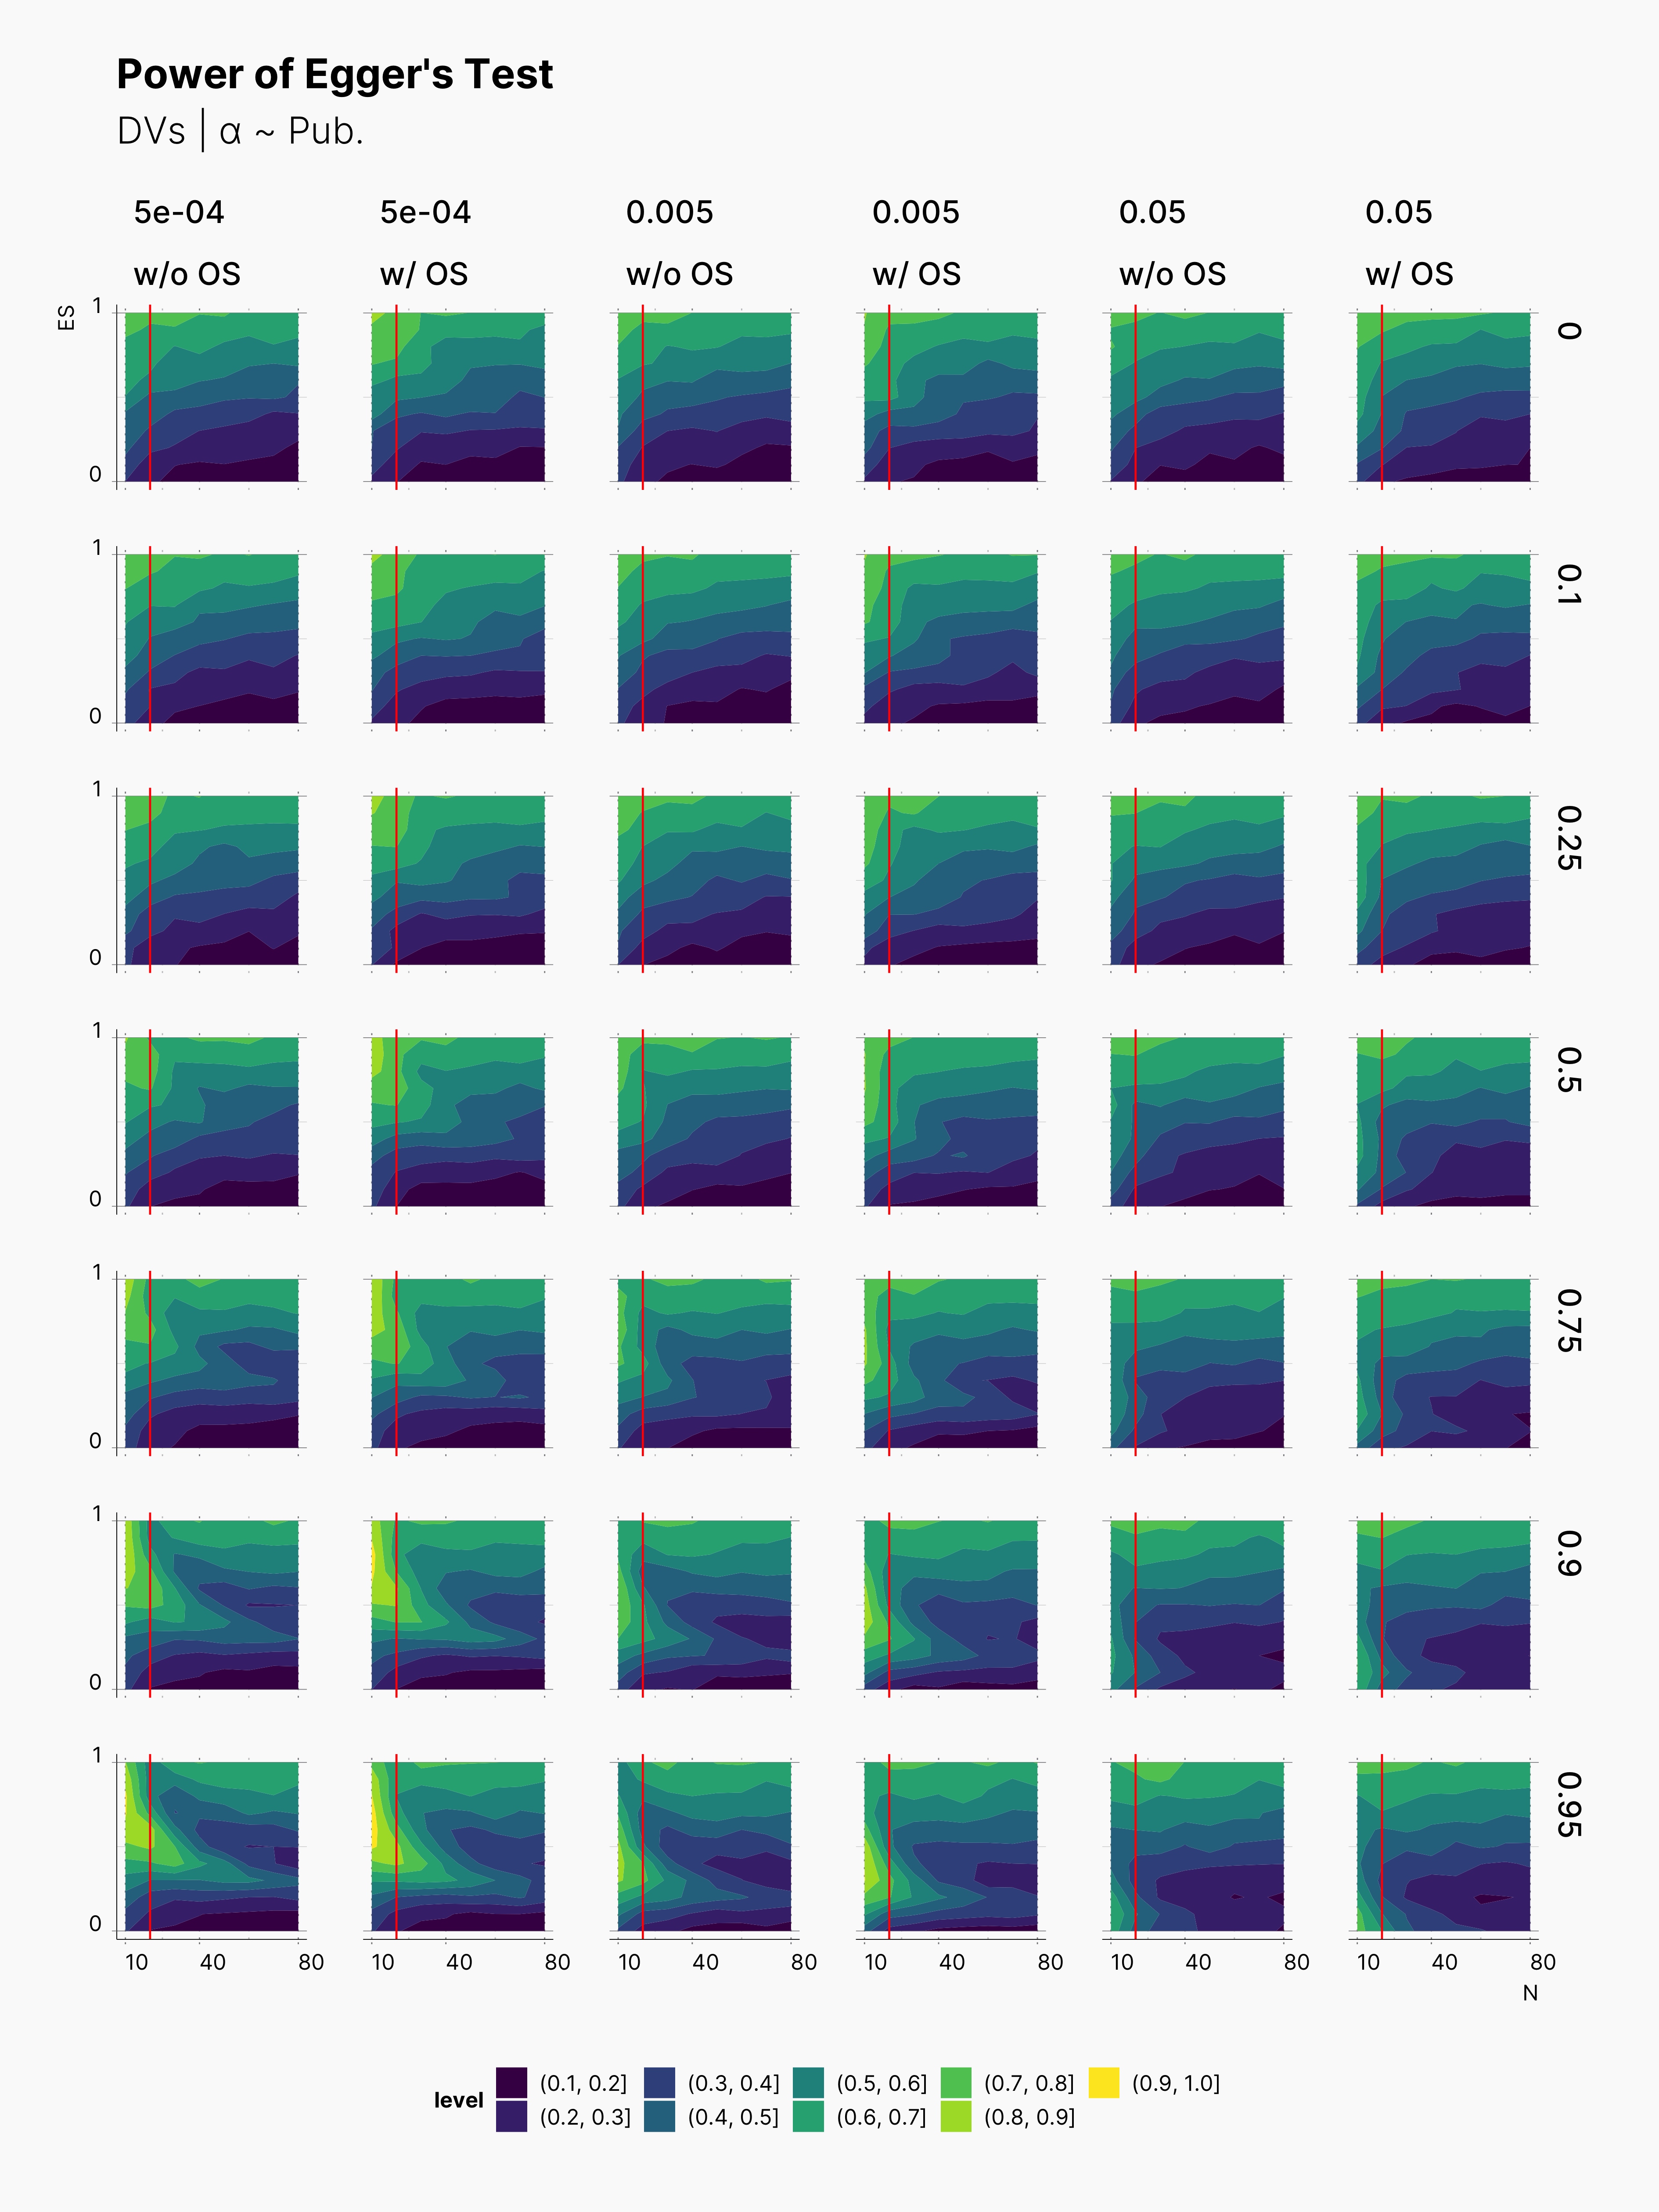
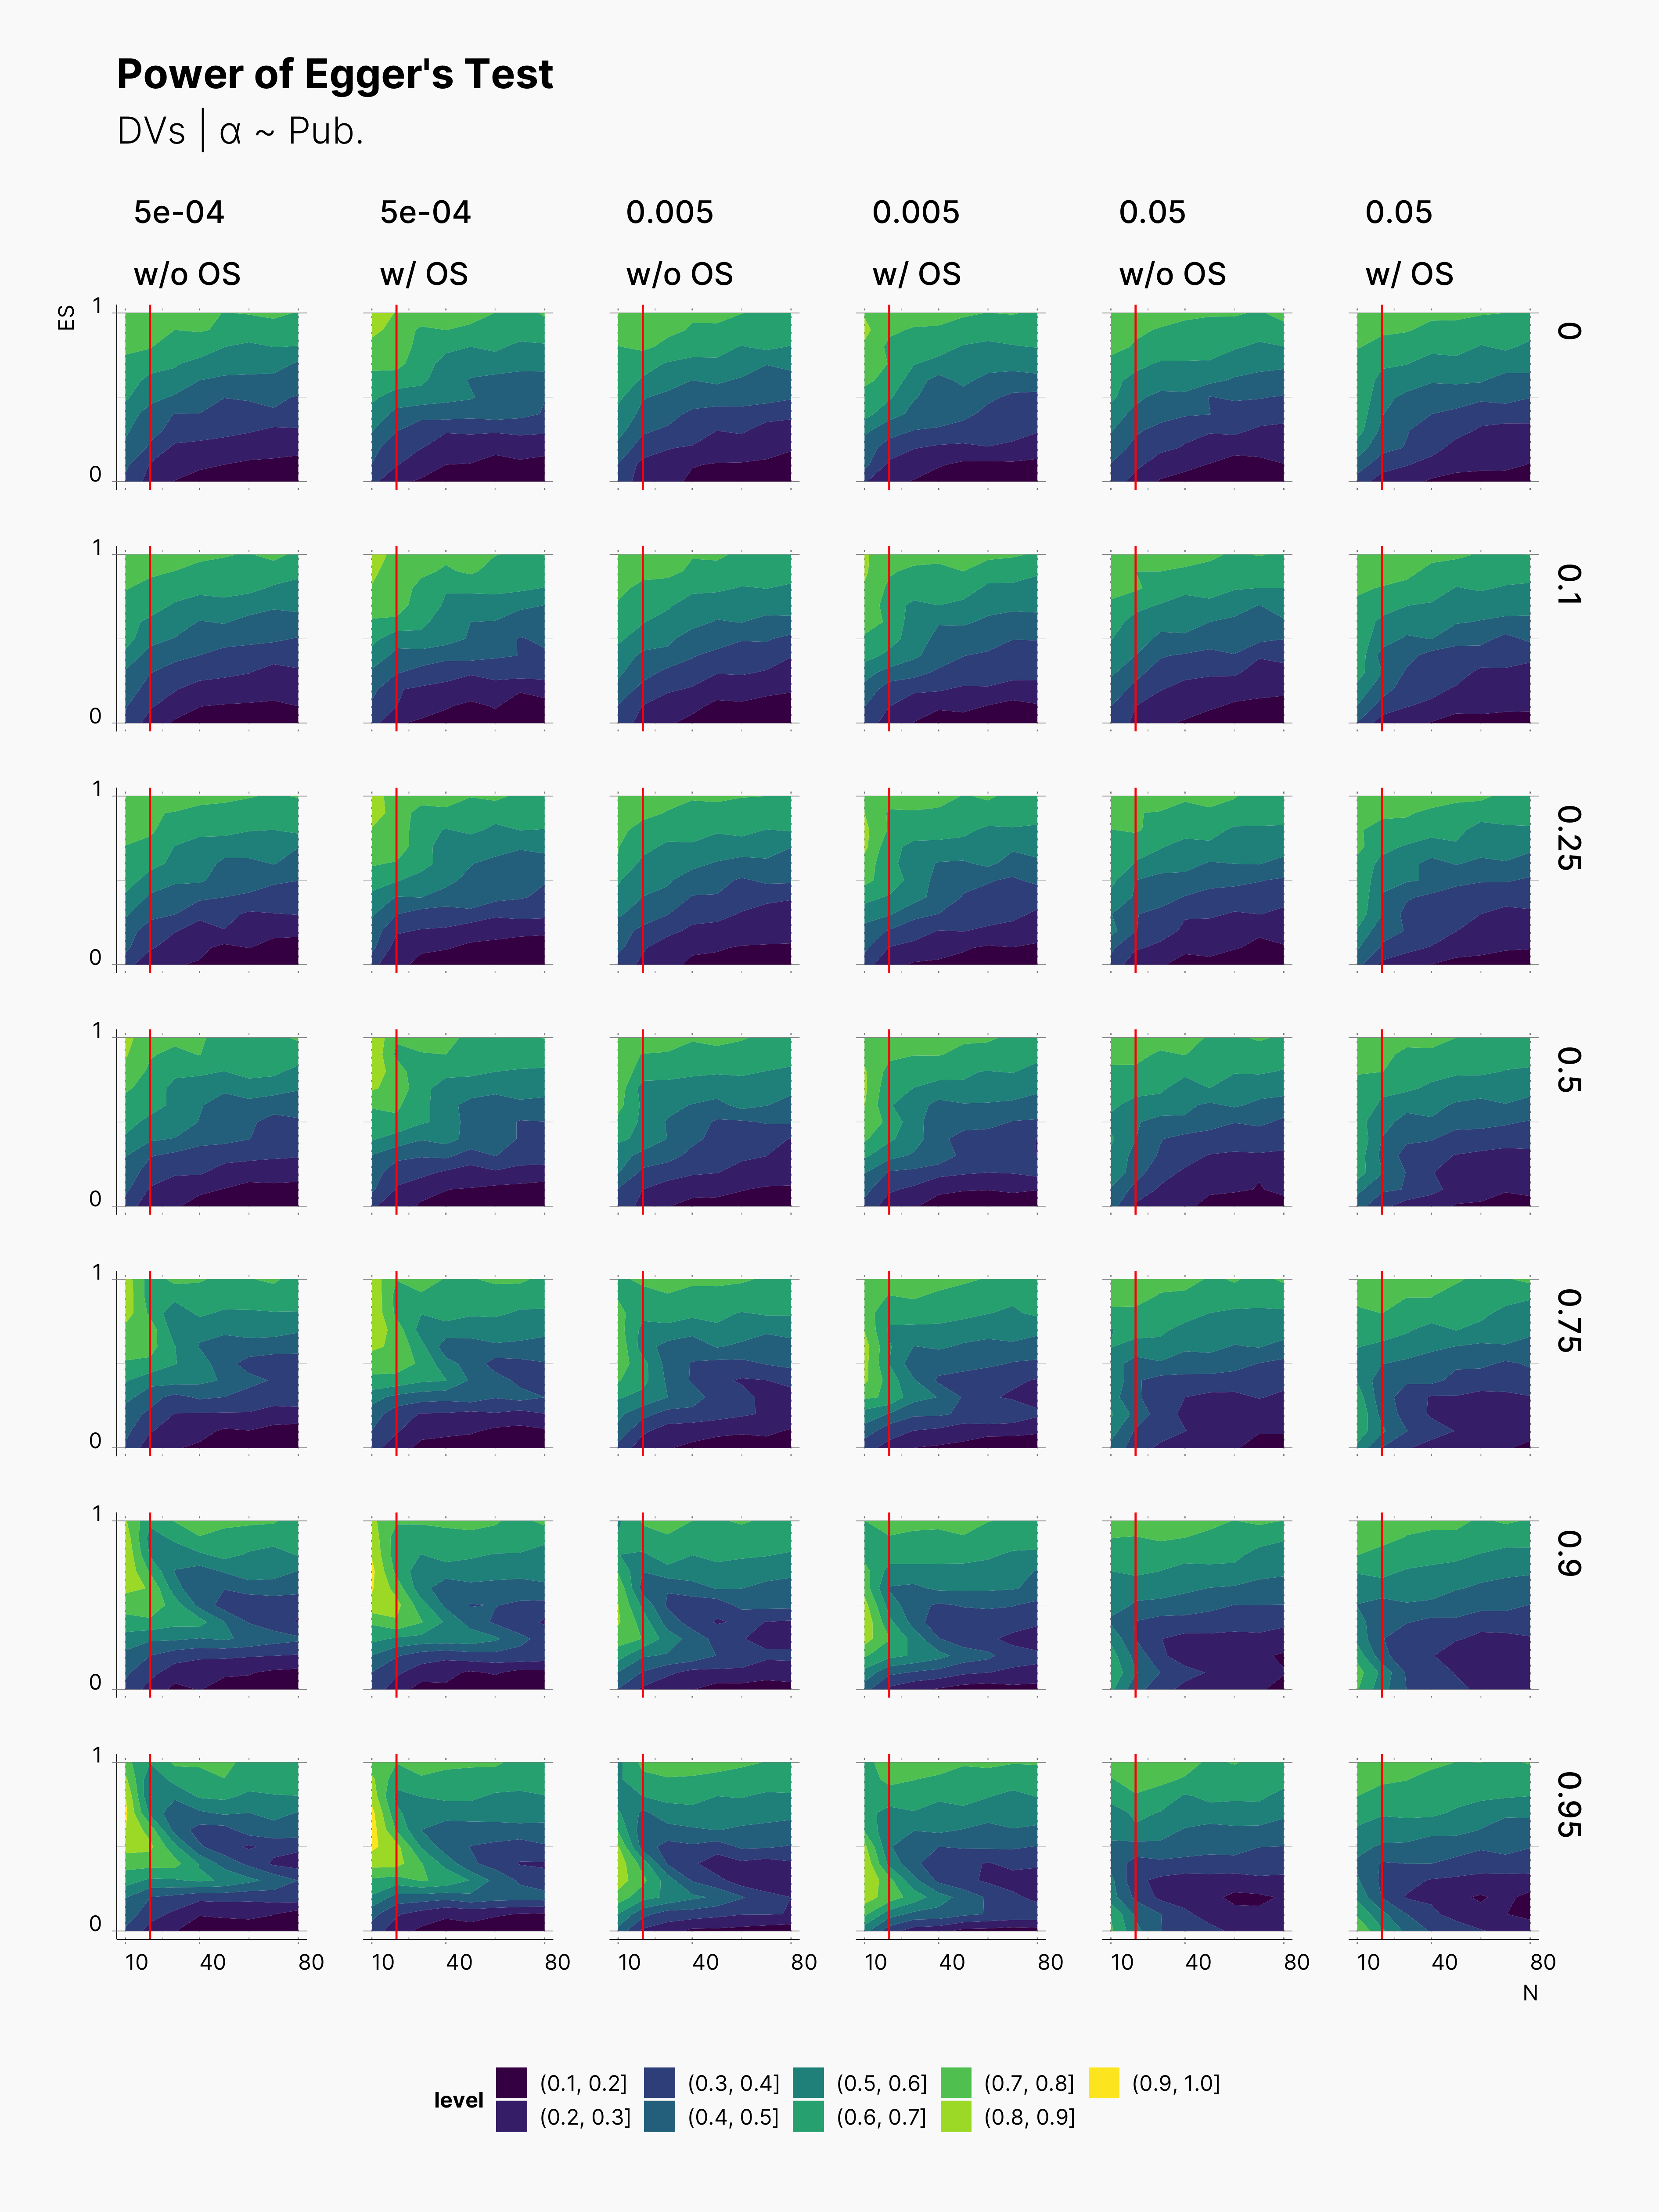
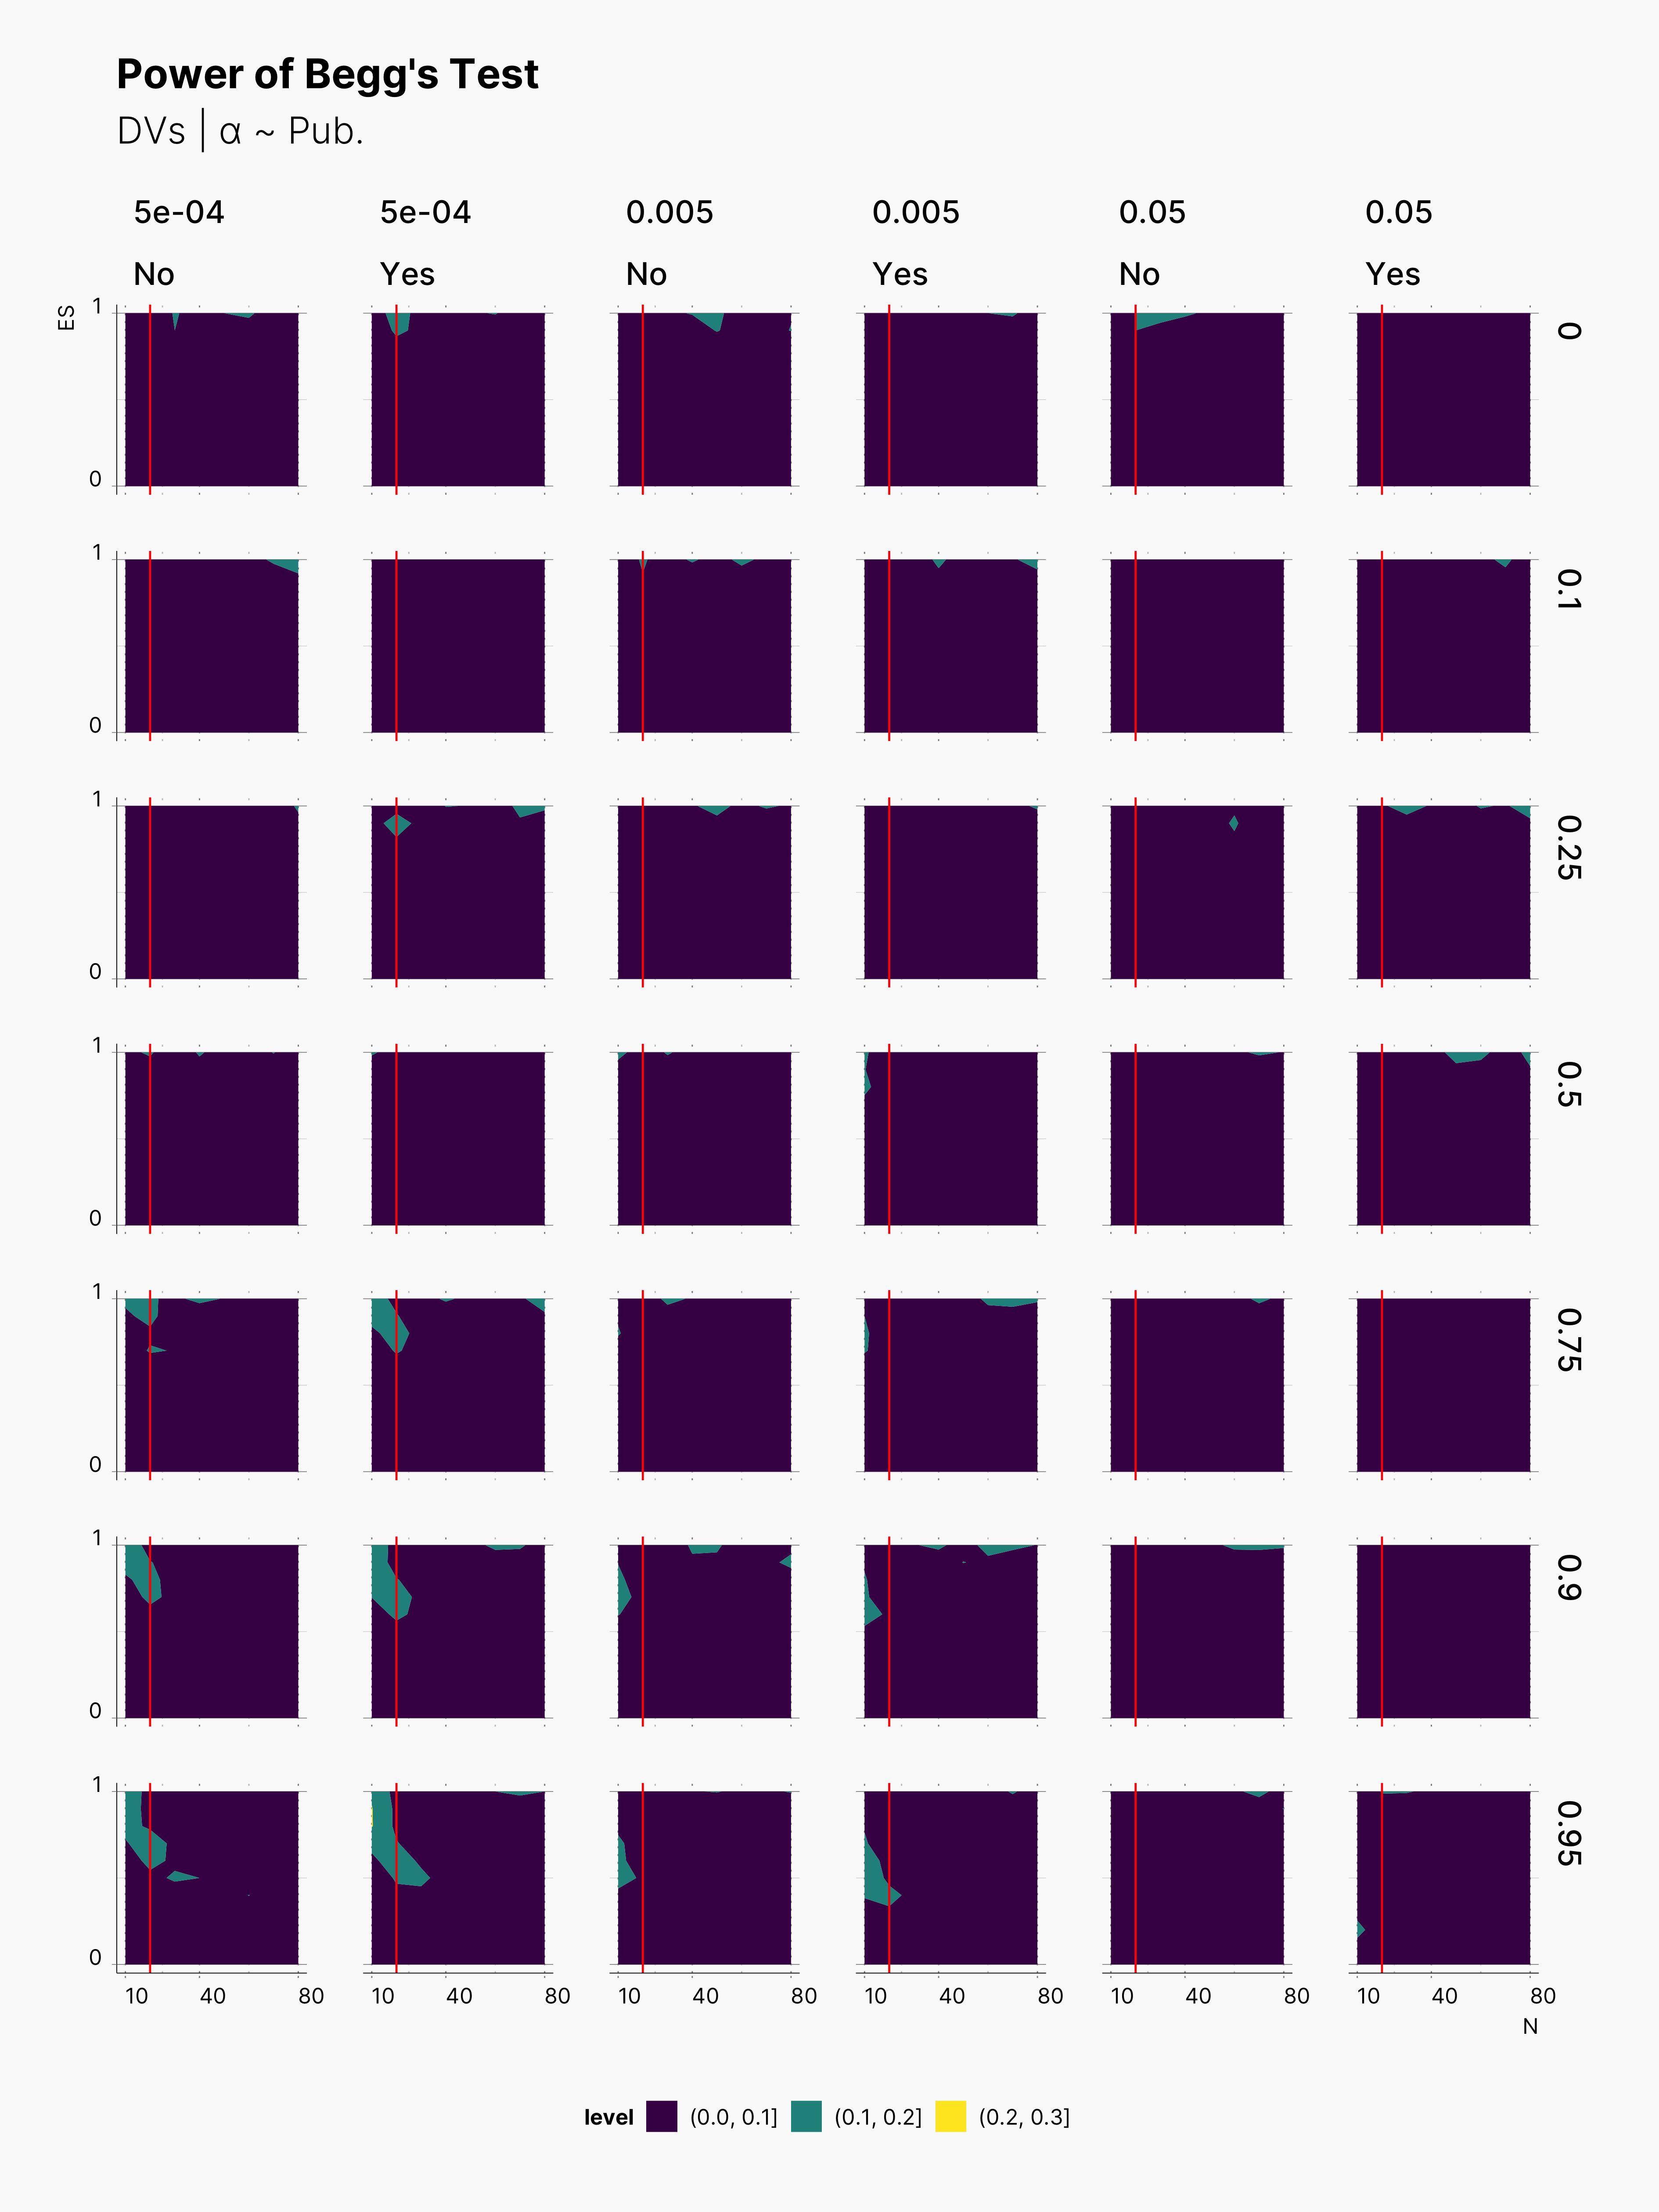
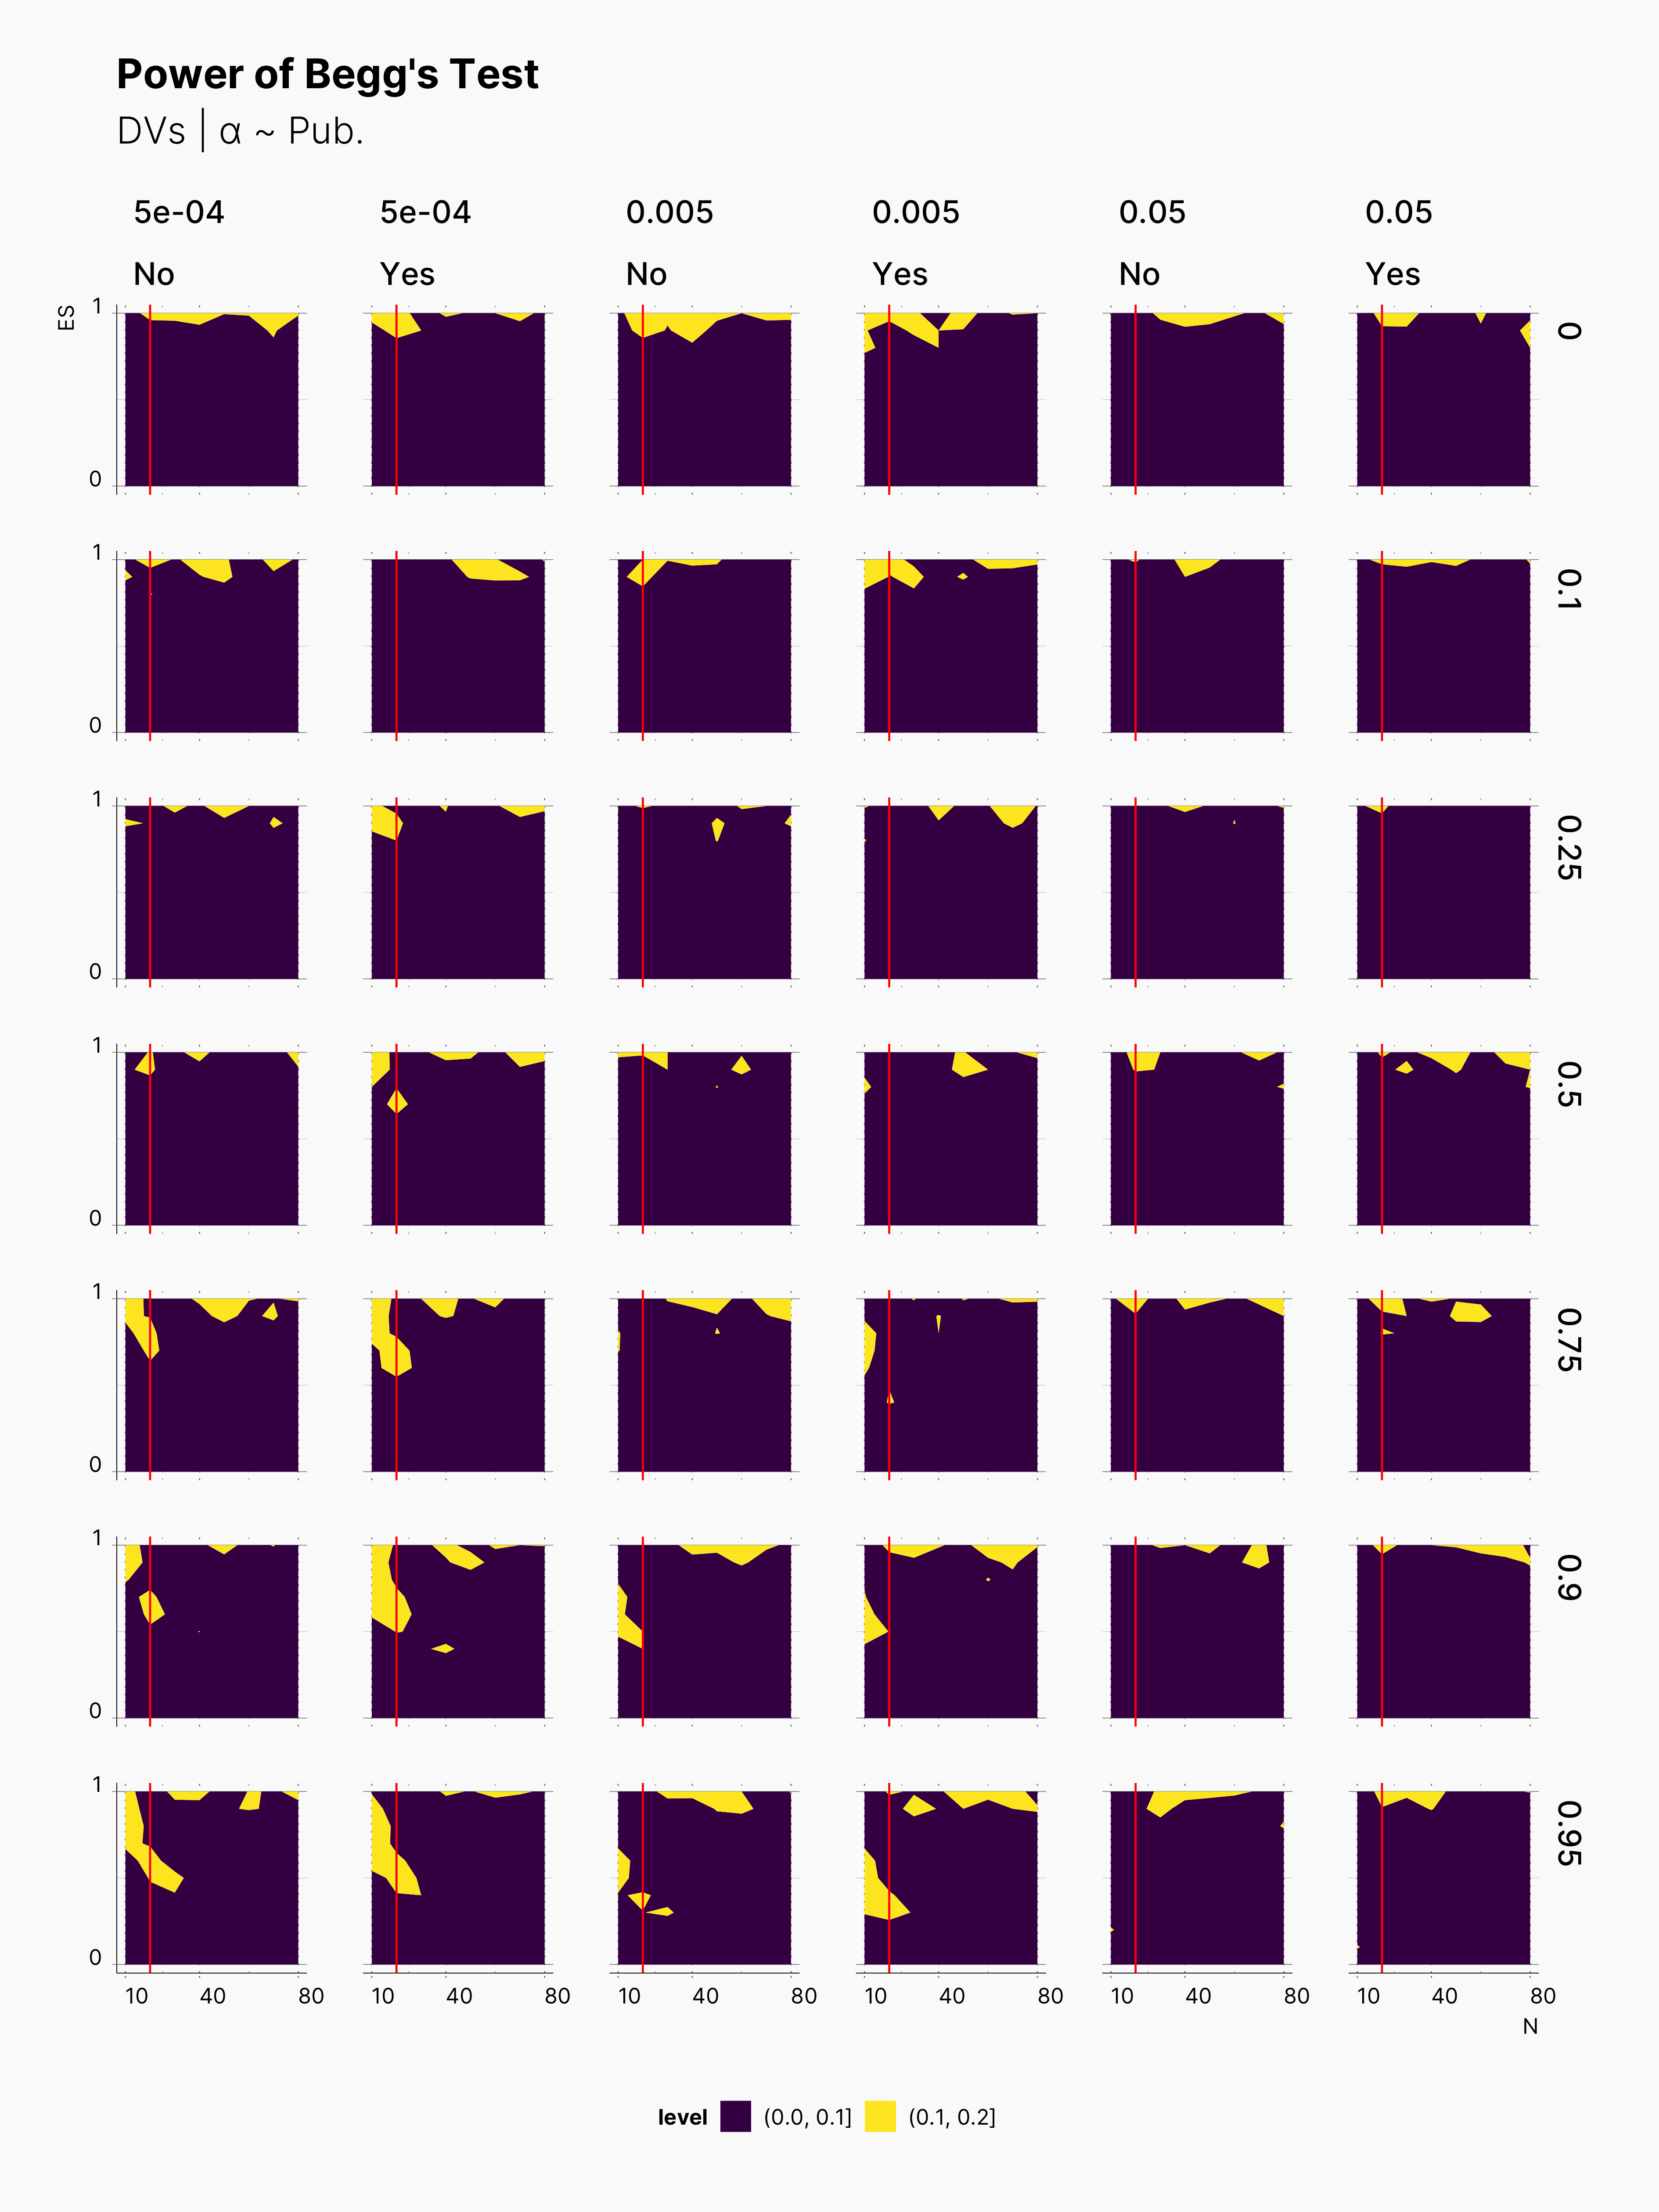
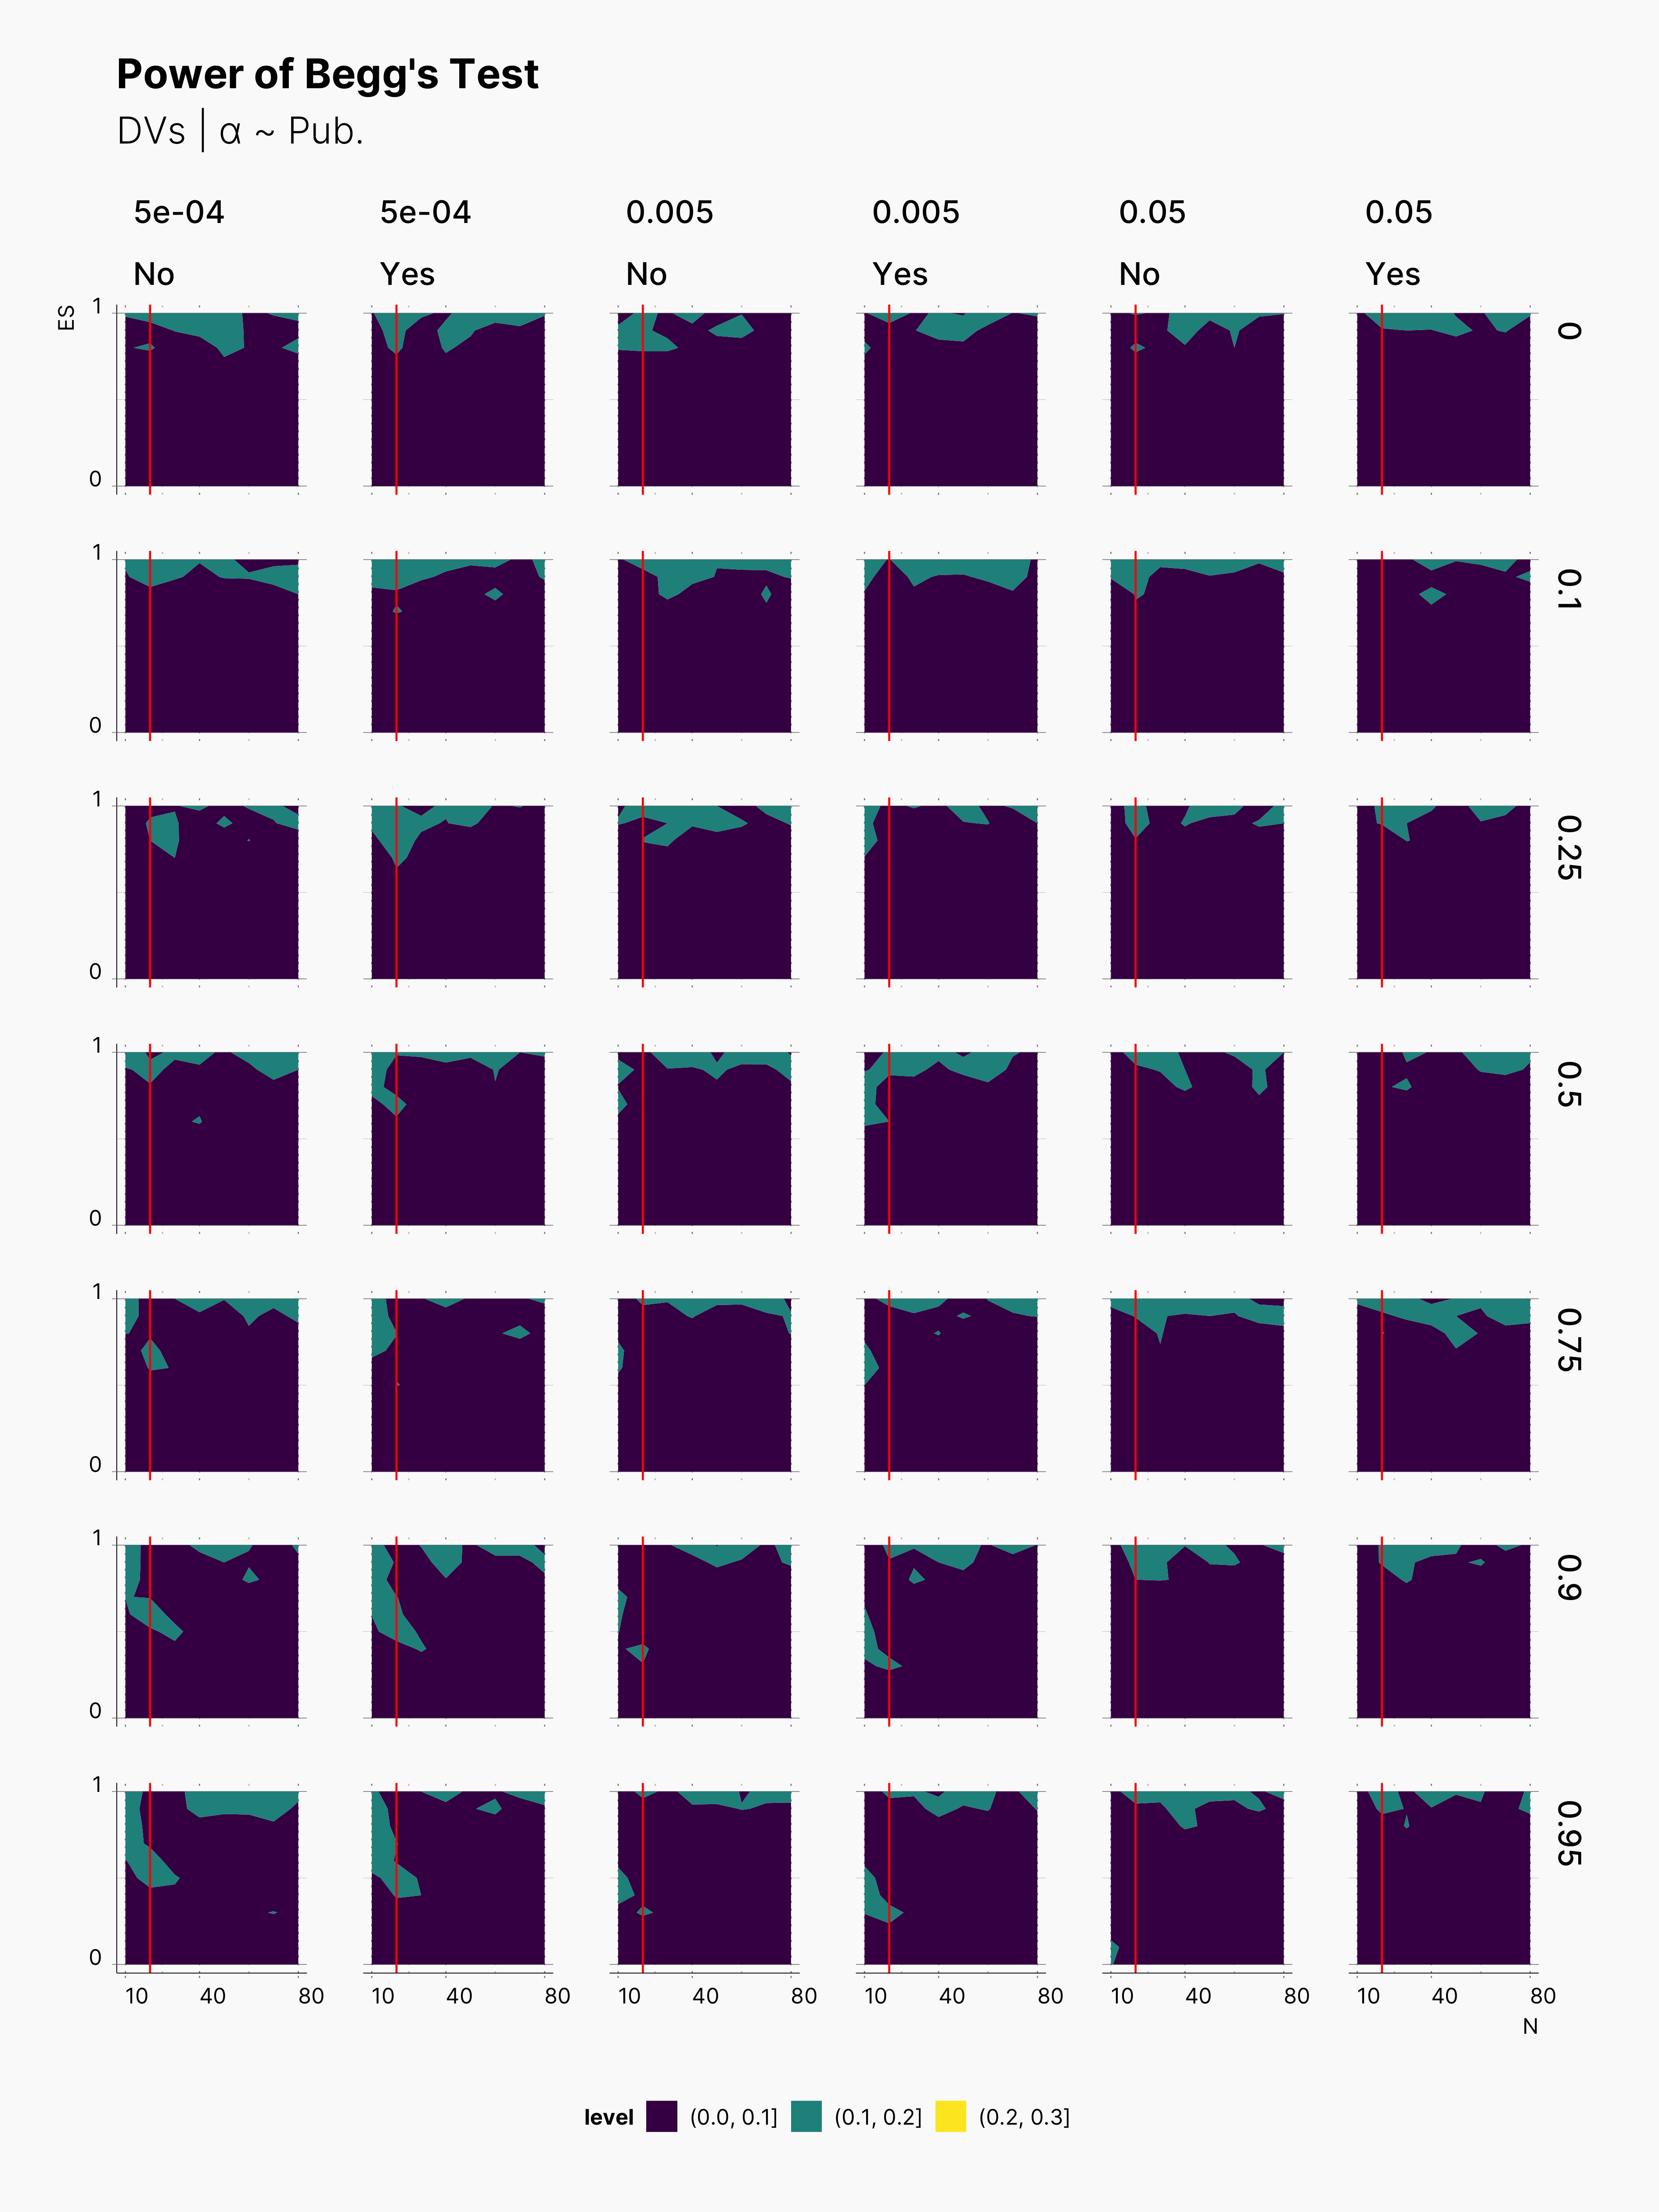
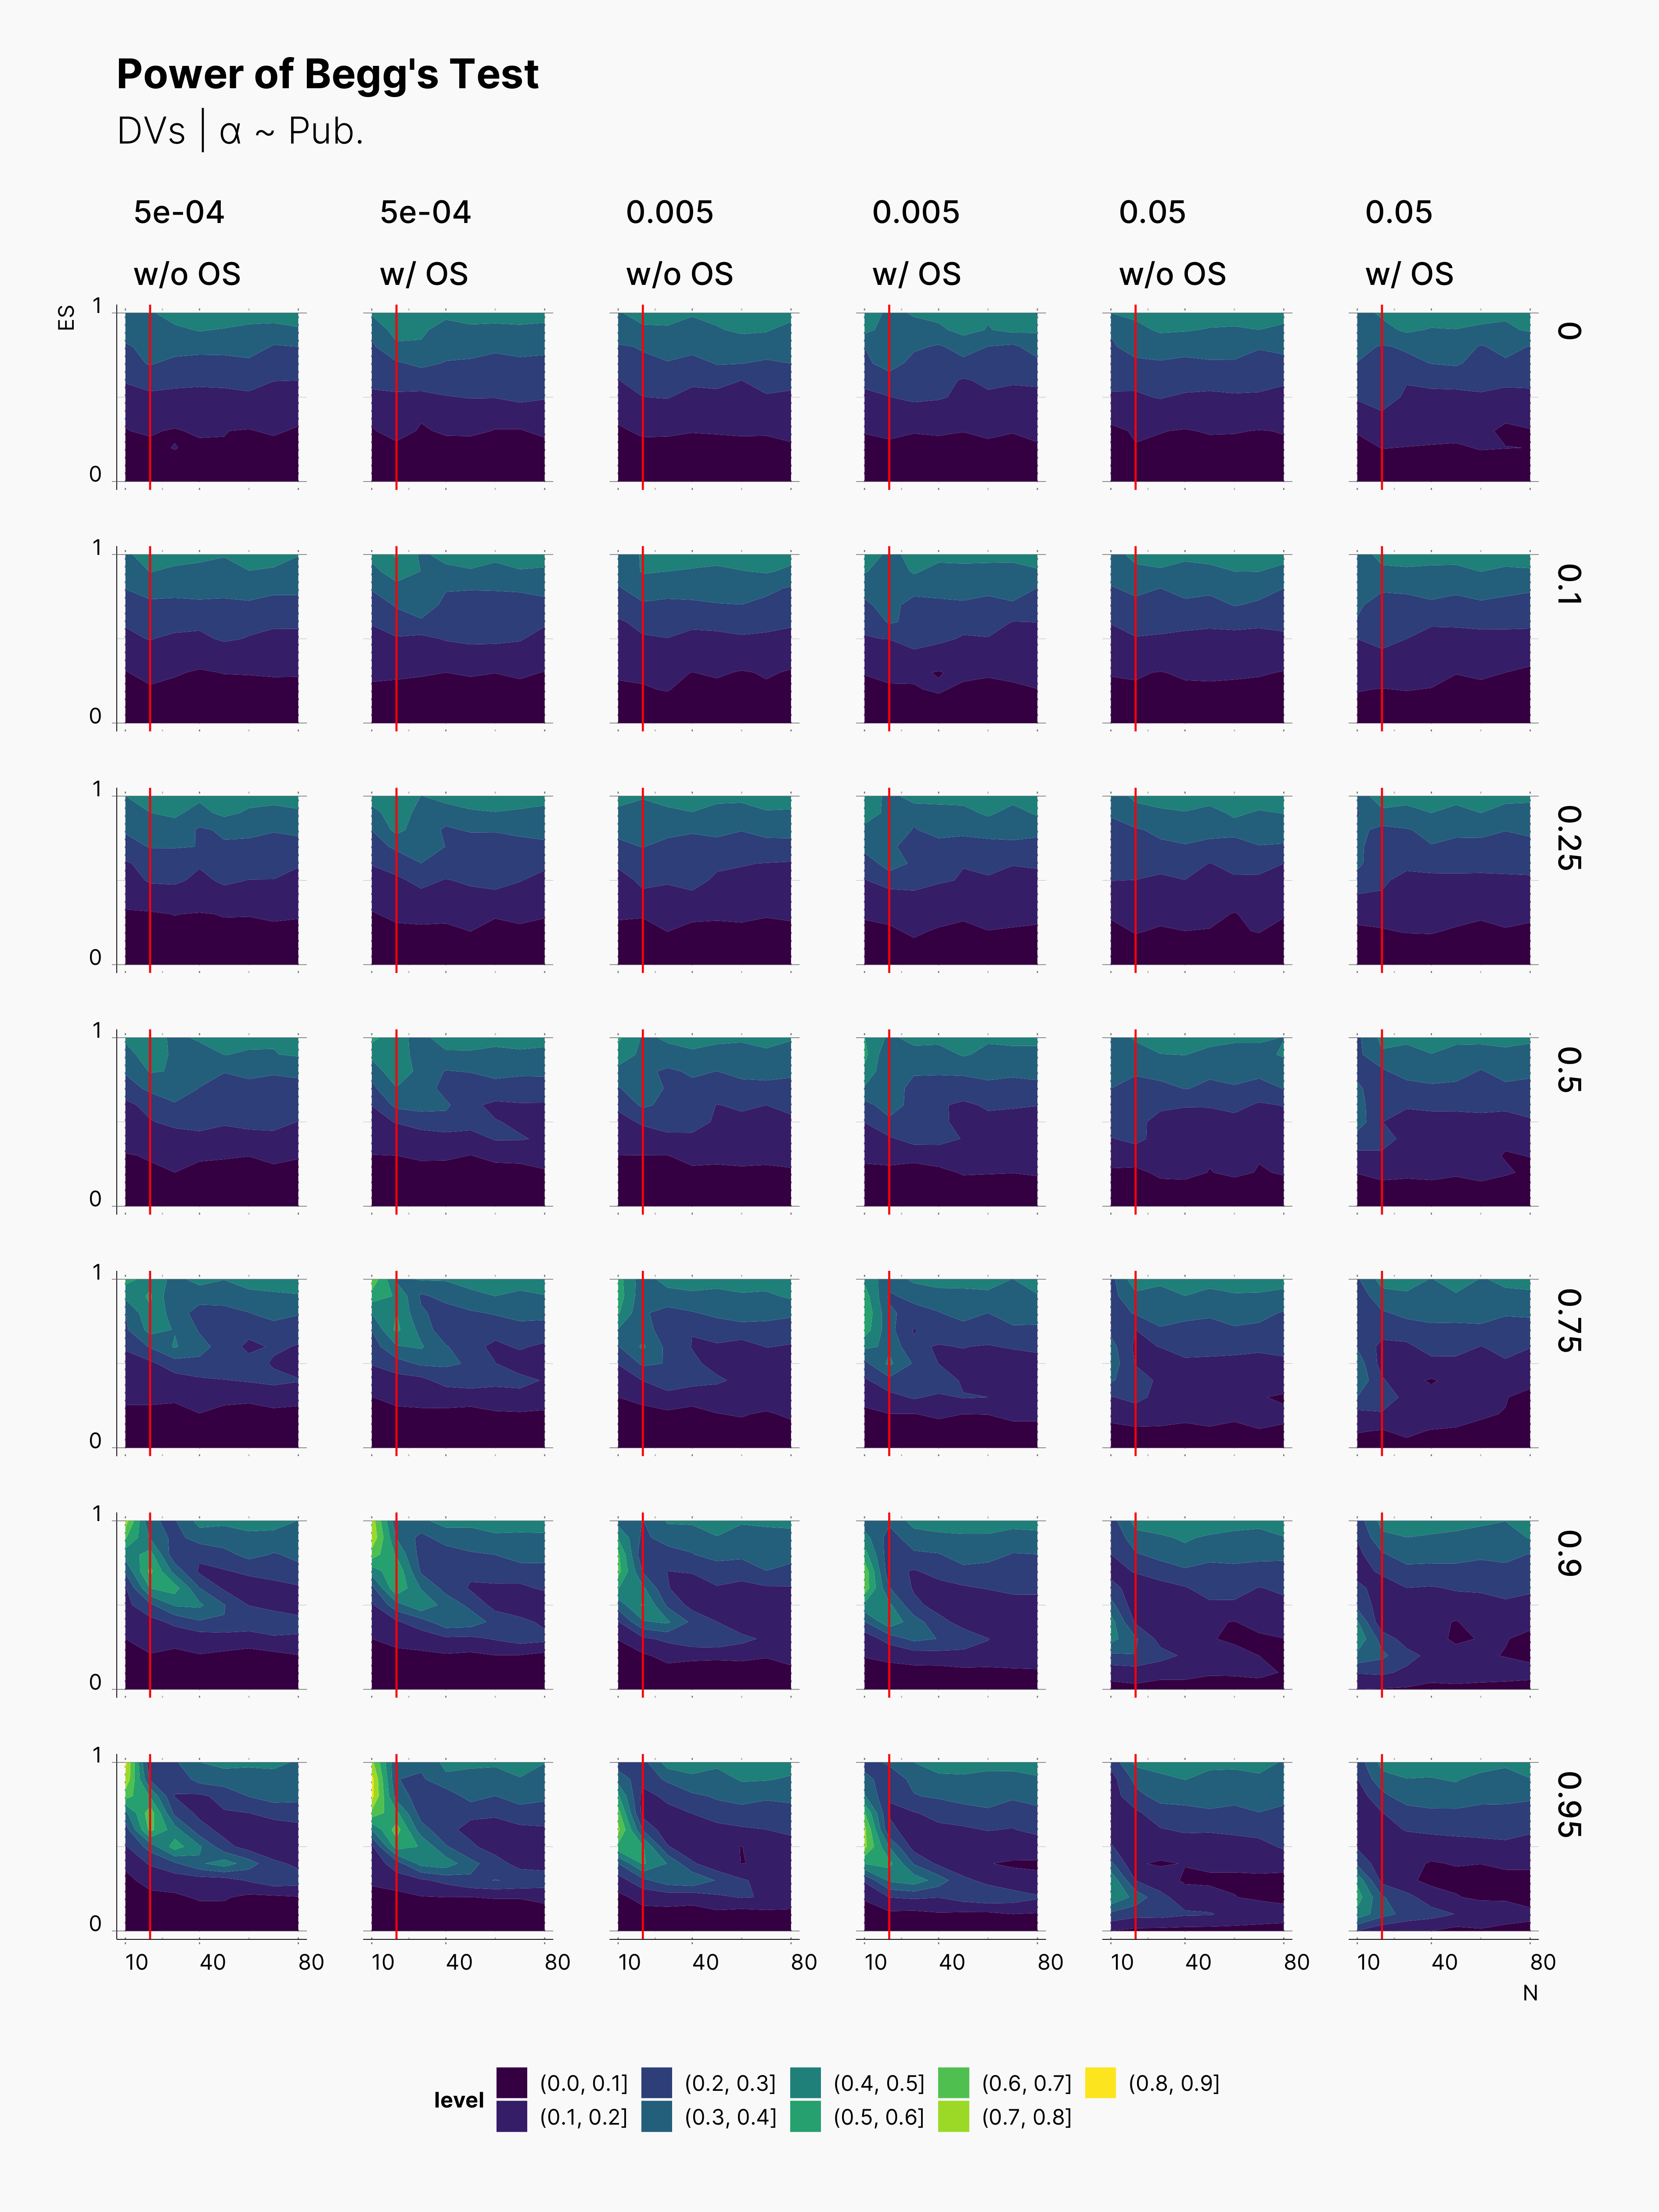
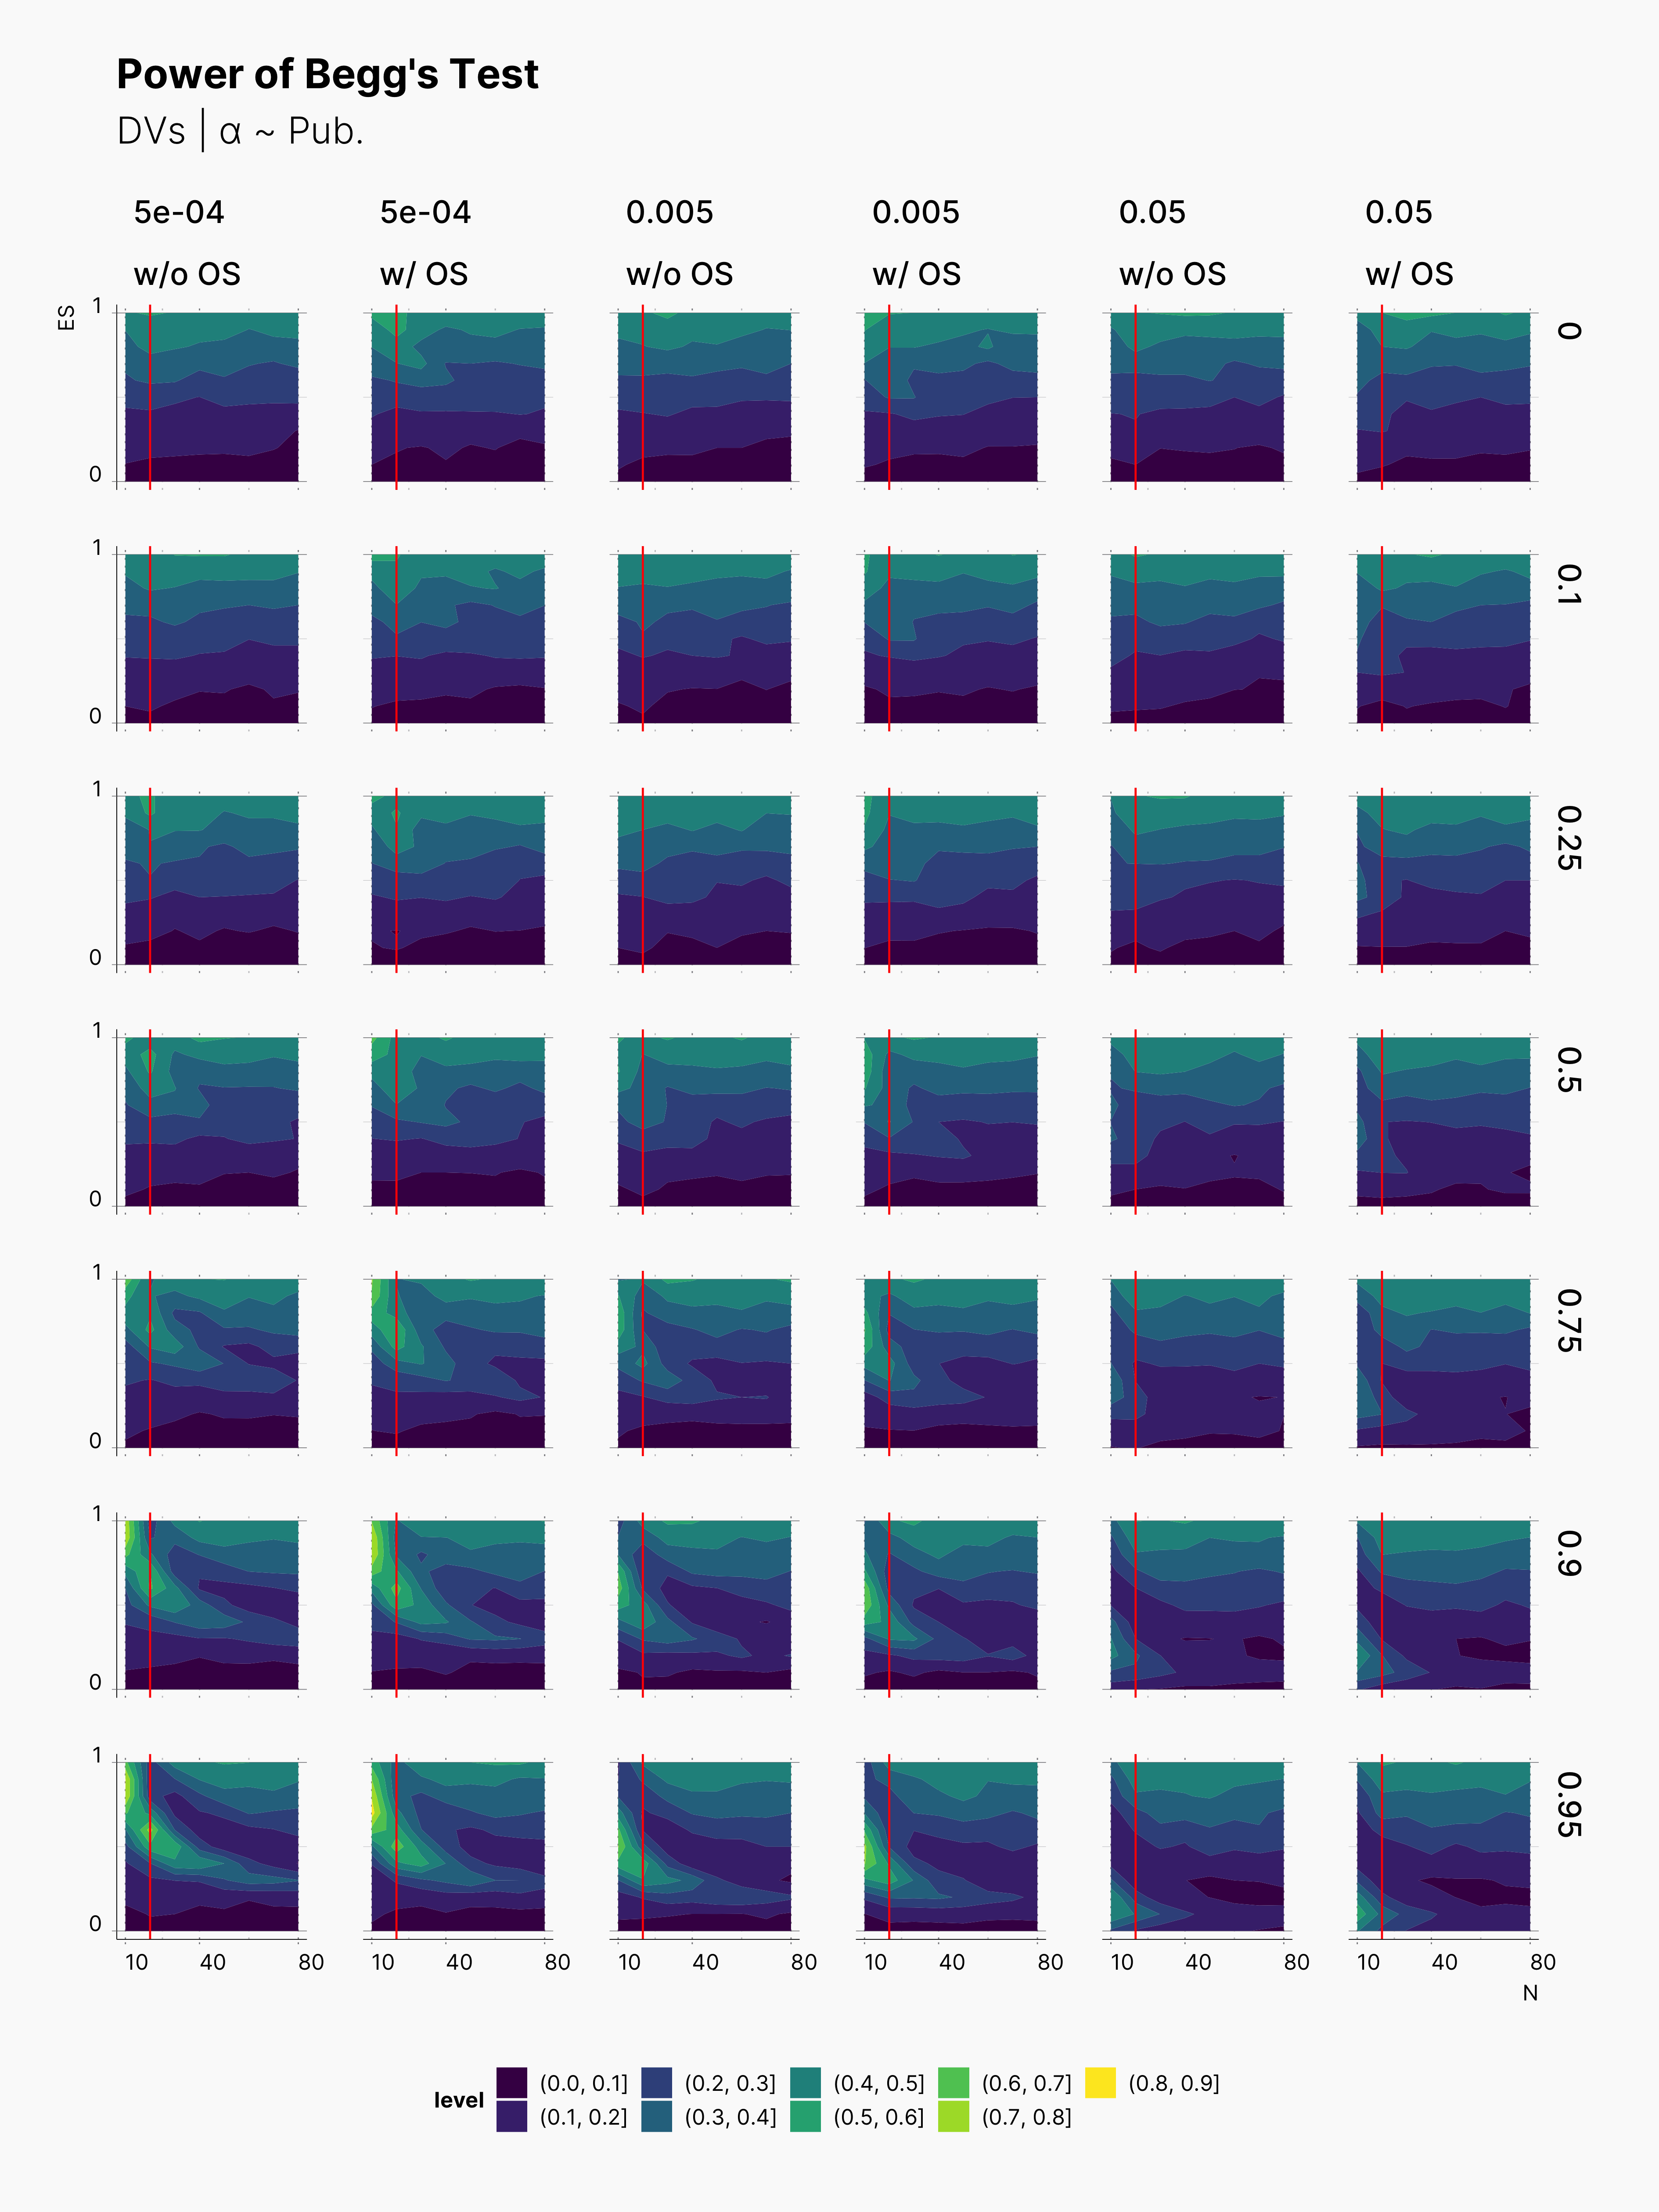
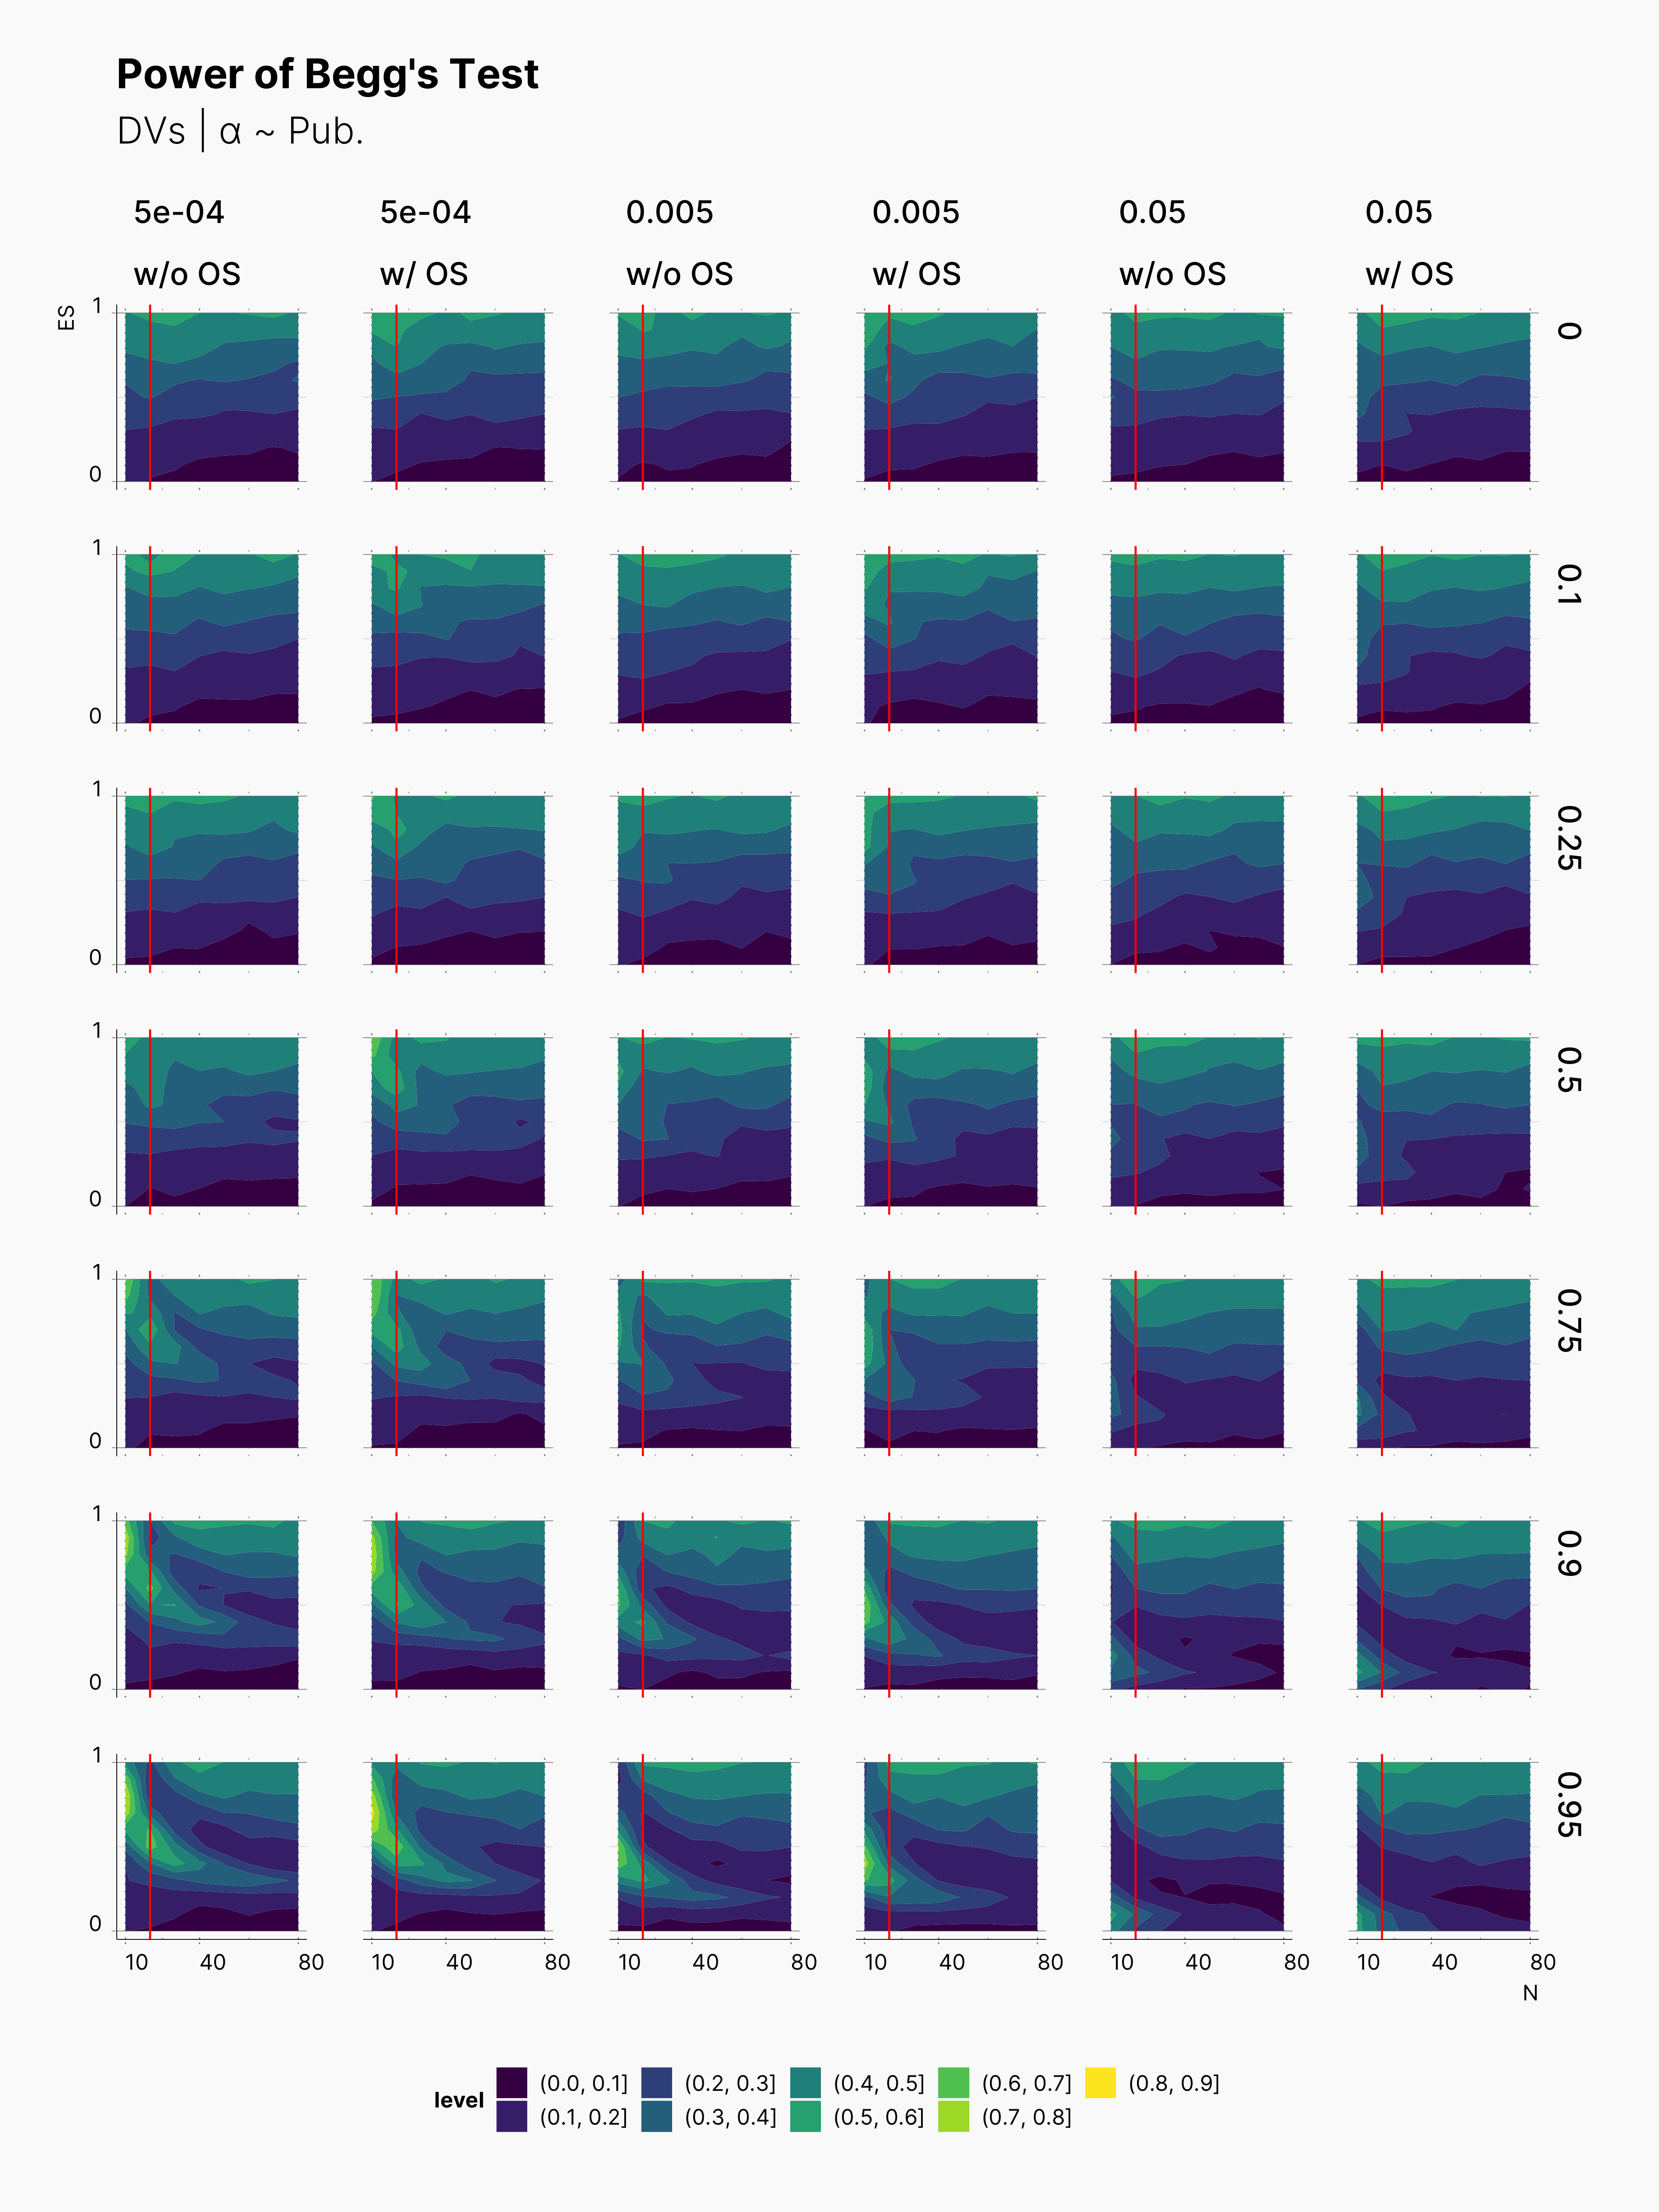
We also included Begg's Rank Correlation Test in our meta analysis. Figures below showcase the variation of its power. As we know Begg's test does not perform well with small samples sizes, and it performs the best with at least K ≳ 72 [cite], see Maassen et al., 2016. Here, we can observe the same behavior, as we see much brigher contour batches with K = 24. In comparison to Egger's test, Begg's test has a lower power, and does not necessary come out more successful. Similarly, Begg's test is more powerful withing the region of N ≲ 20, and higher true effect sizes, θ.
Third Extension
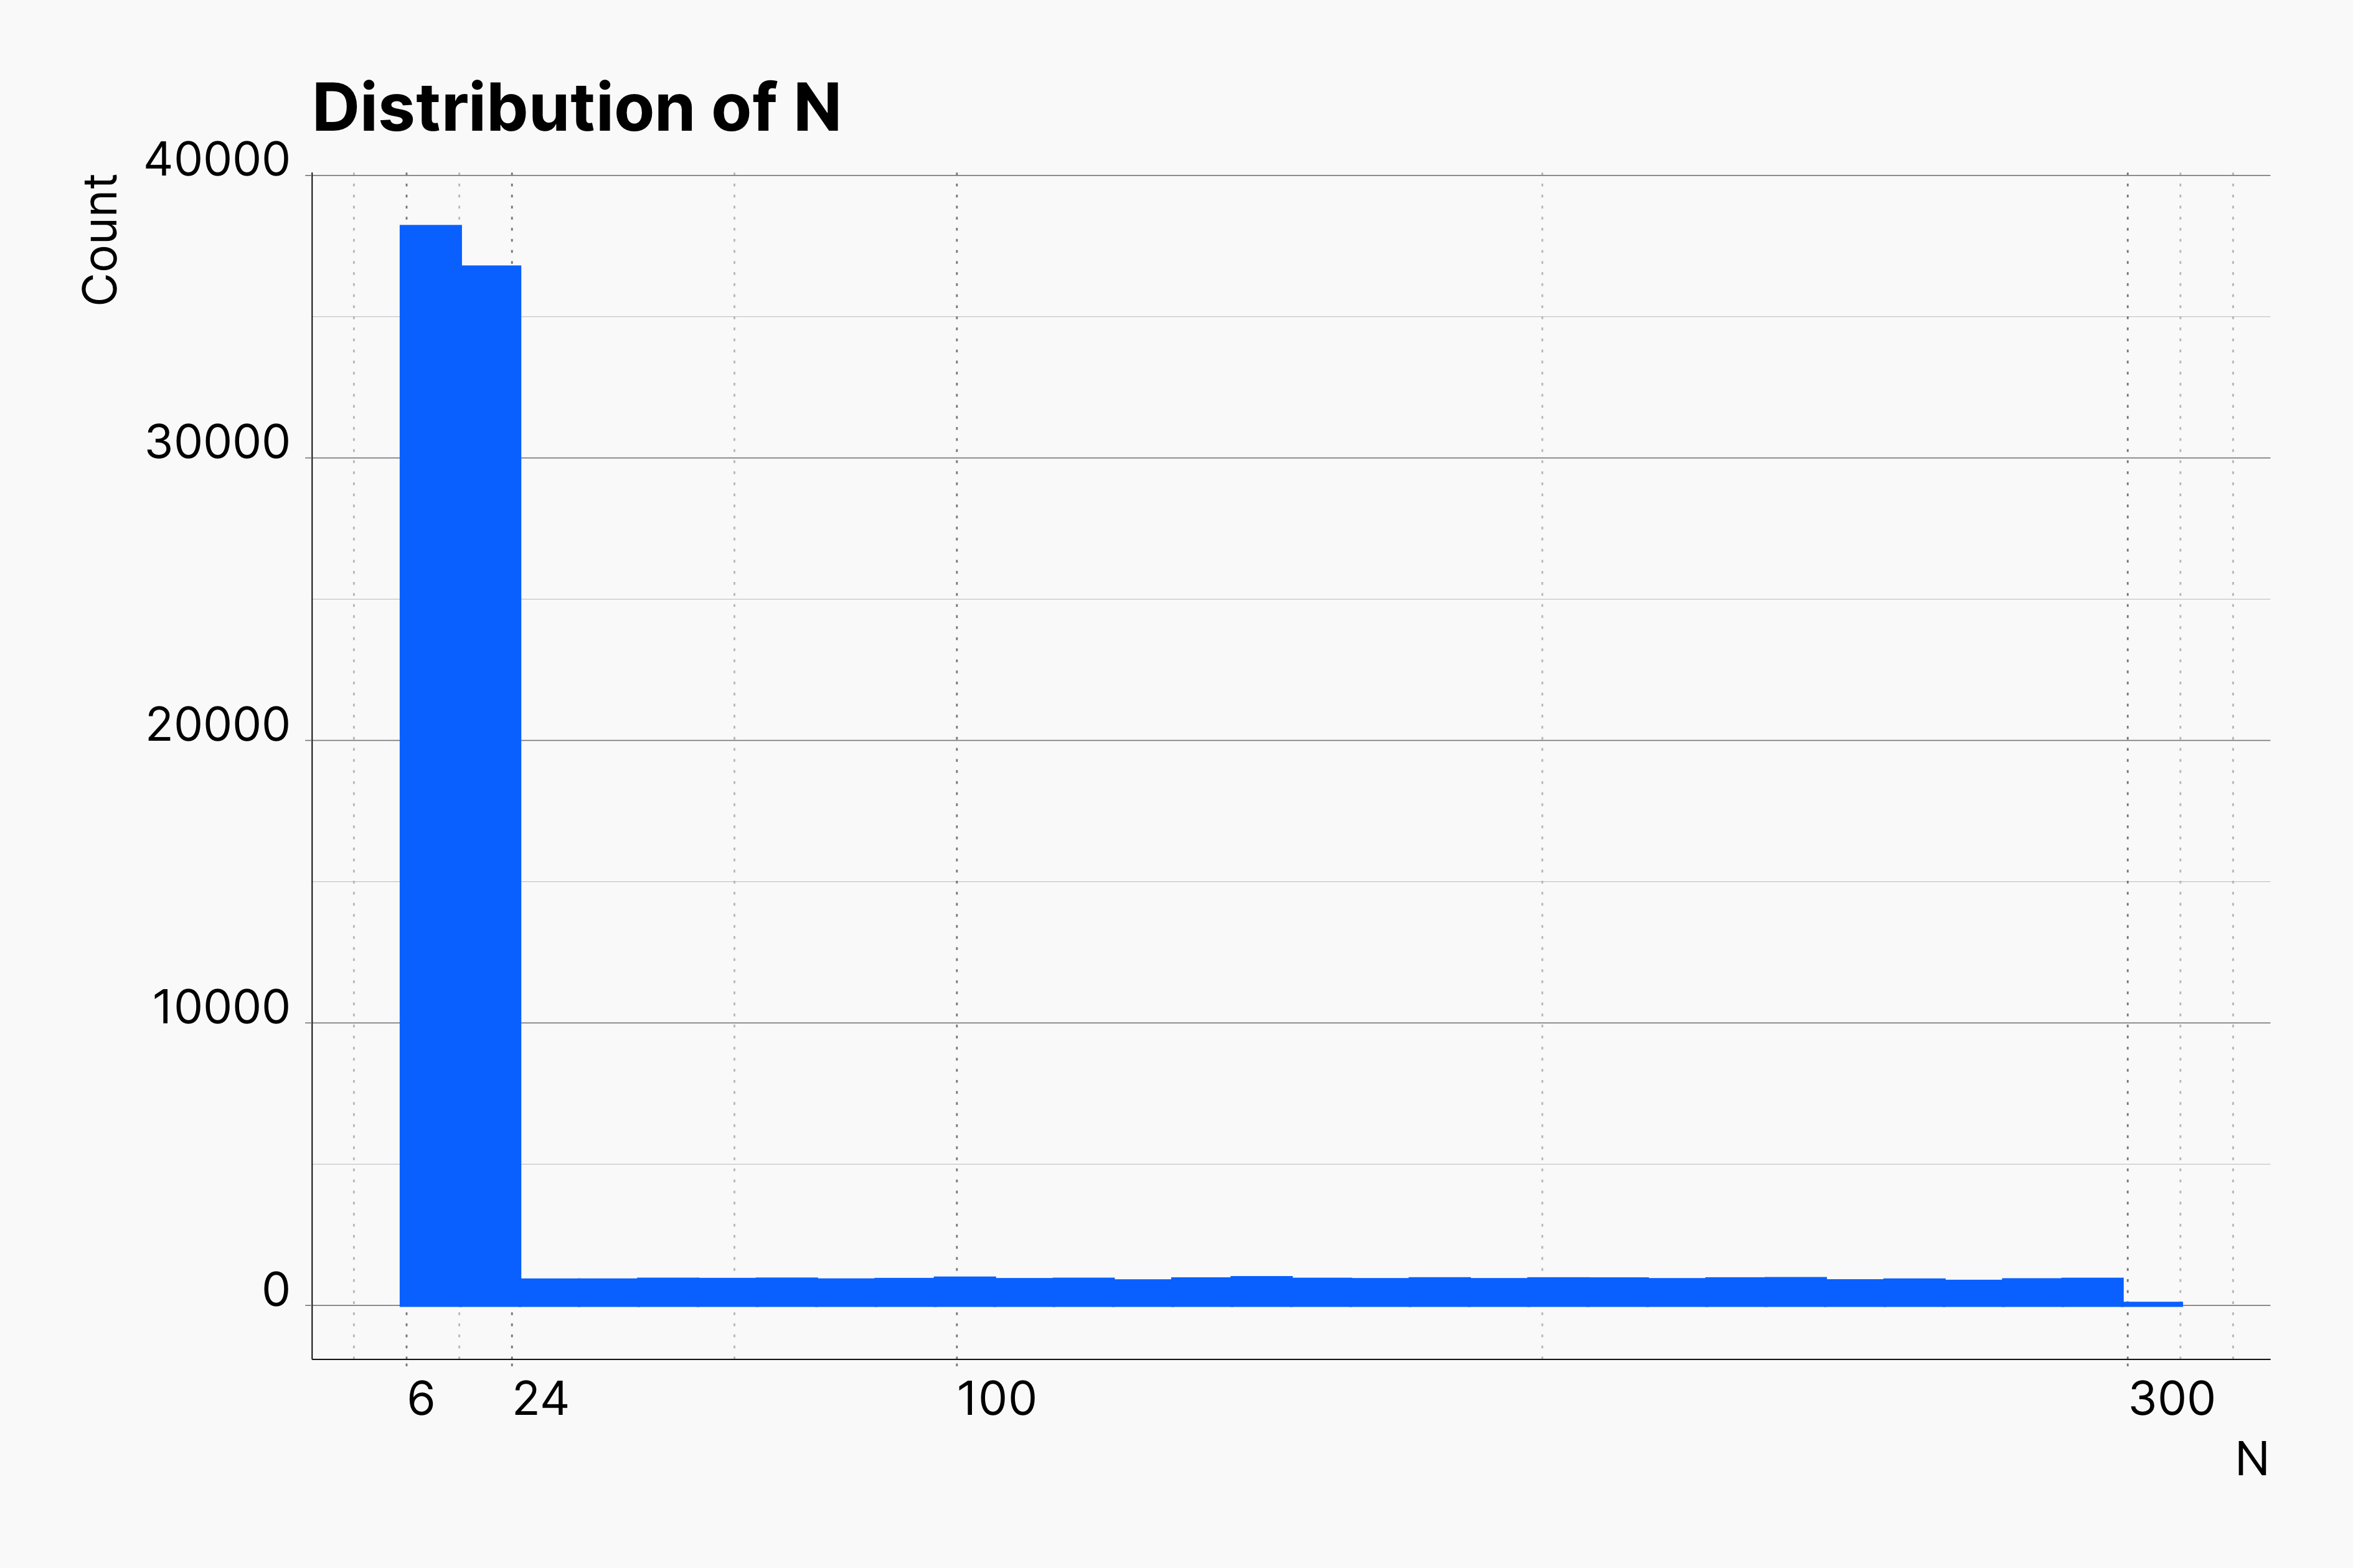
In our last extension, we remove an another dimension by replacing a set of sample sizes with values drawn from a custom designed destribution. As shown here, we aim for a distirbution with higher chance of returning smaller N's and lower chance of returning higher values. We tuned our distirbution such that 75% of our sample sizes lie within [6, 24], and the rest are drawn from [25, 300]. We can achieve this by tuning a piecewise_constant_distribution as follow within our Data Strategy configuration.
Configuration: Data Strategy
{
    "experiment_parameters": {
    "n_reps": 1,
    "n_conditions": 2,
    "n_dep_vars": 2,
    "n_obs": {
        "dist": "piecewise_constant_distribution",
        "intervals": [6, 24, 300],
        "densities": [0.75,  0.25]
    },
    "data_strategy": {
        "name": "LinearModel",
        "measurements": {
            "dist": "mvnorm_distribution",
            "means": [0.0, 0.0, μ, μ],
            "covs": 0.5,
            "stddevs": 1.0
        }
    },
    "effect_strategy": {
        "name": "StandardizedMeanDifference"
    },
    "test_strategy": {
        "name": "TTest",
        "alpha": 0.05,
        "alternative": "TwoSided",
        "var_equal": true
    }
}
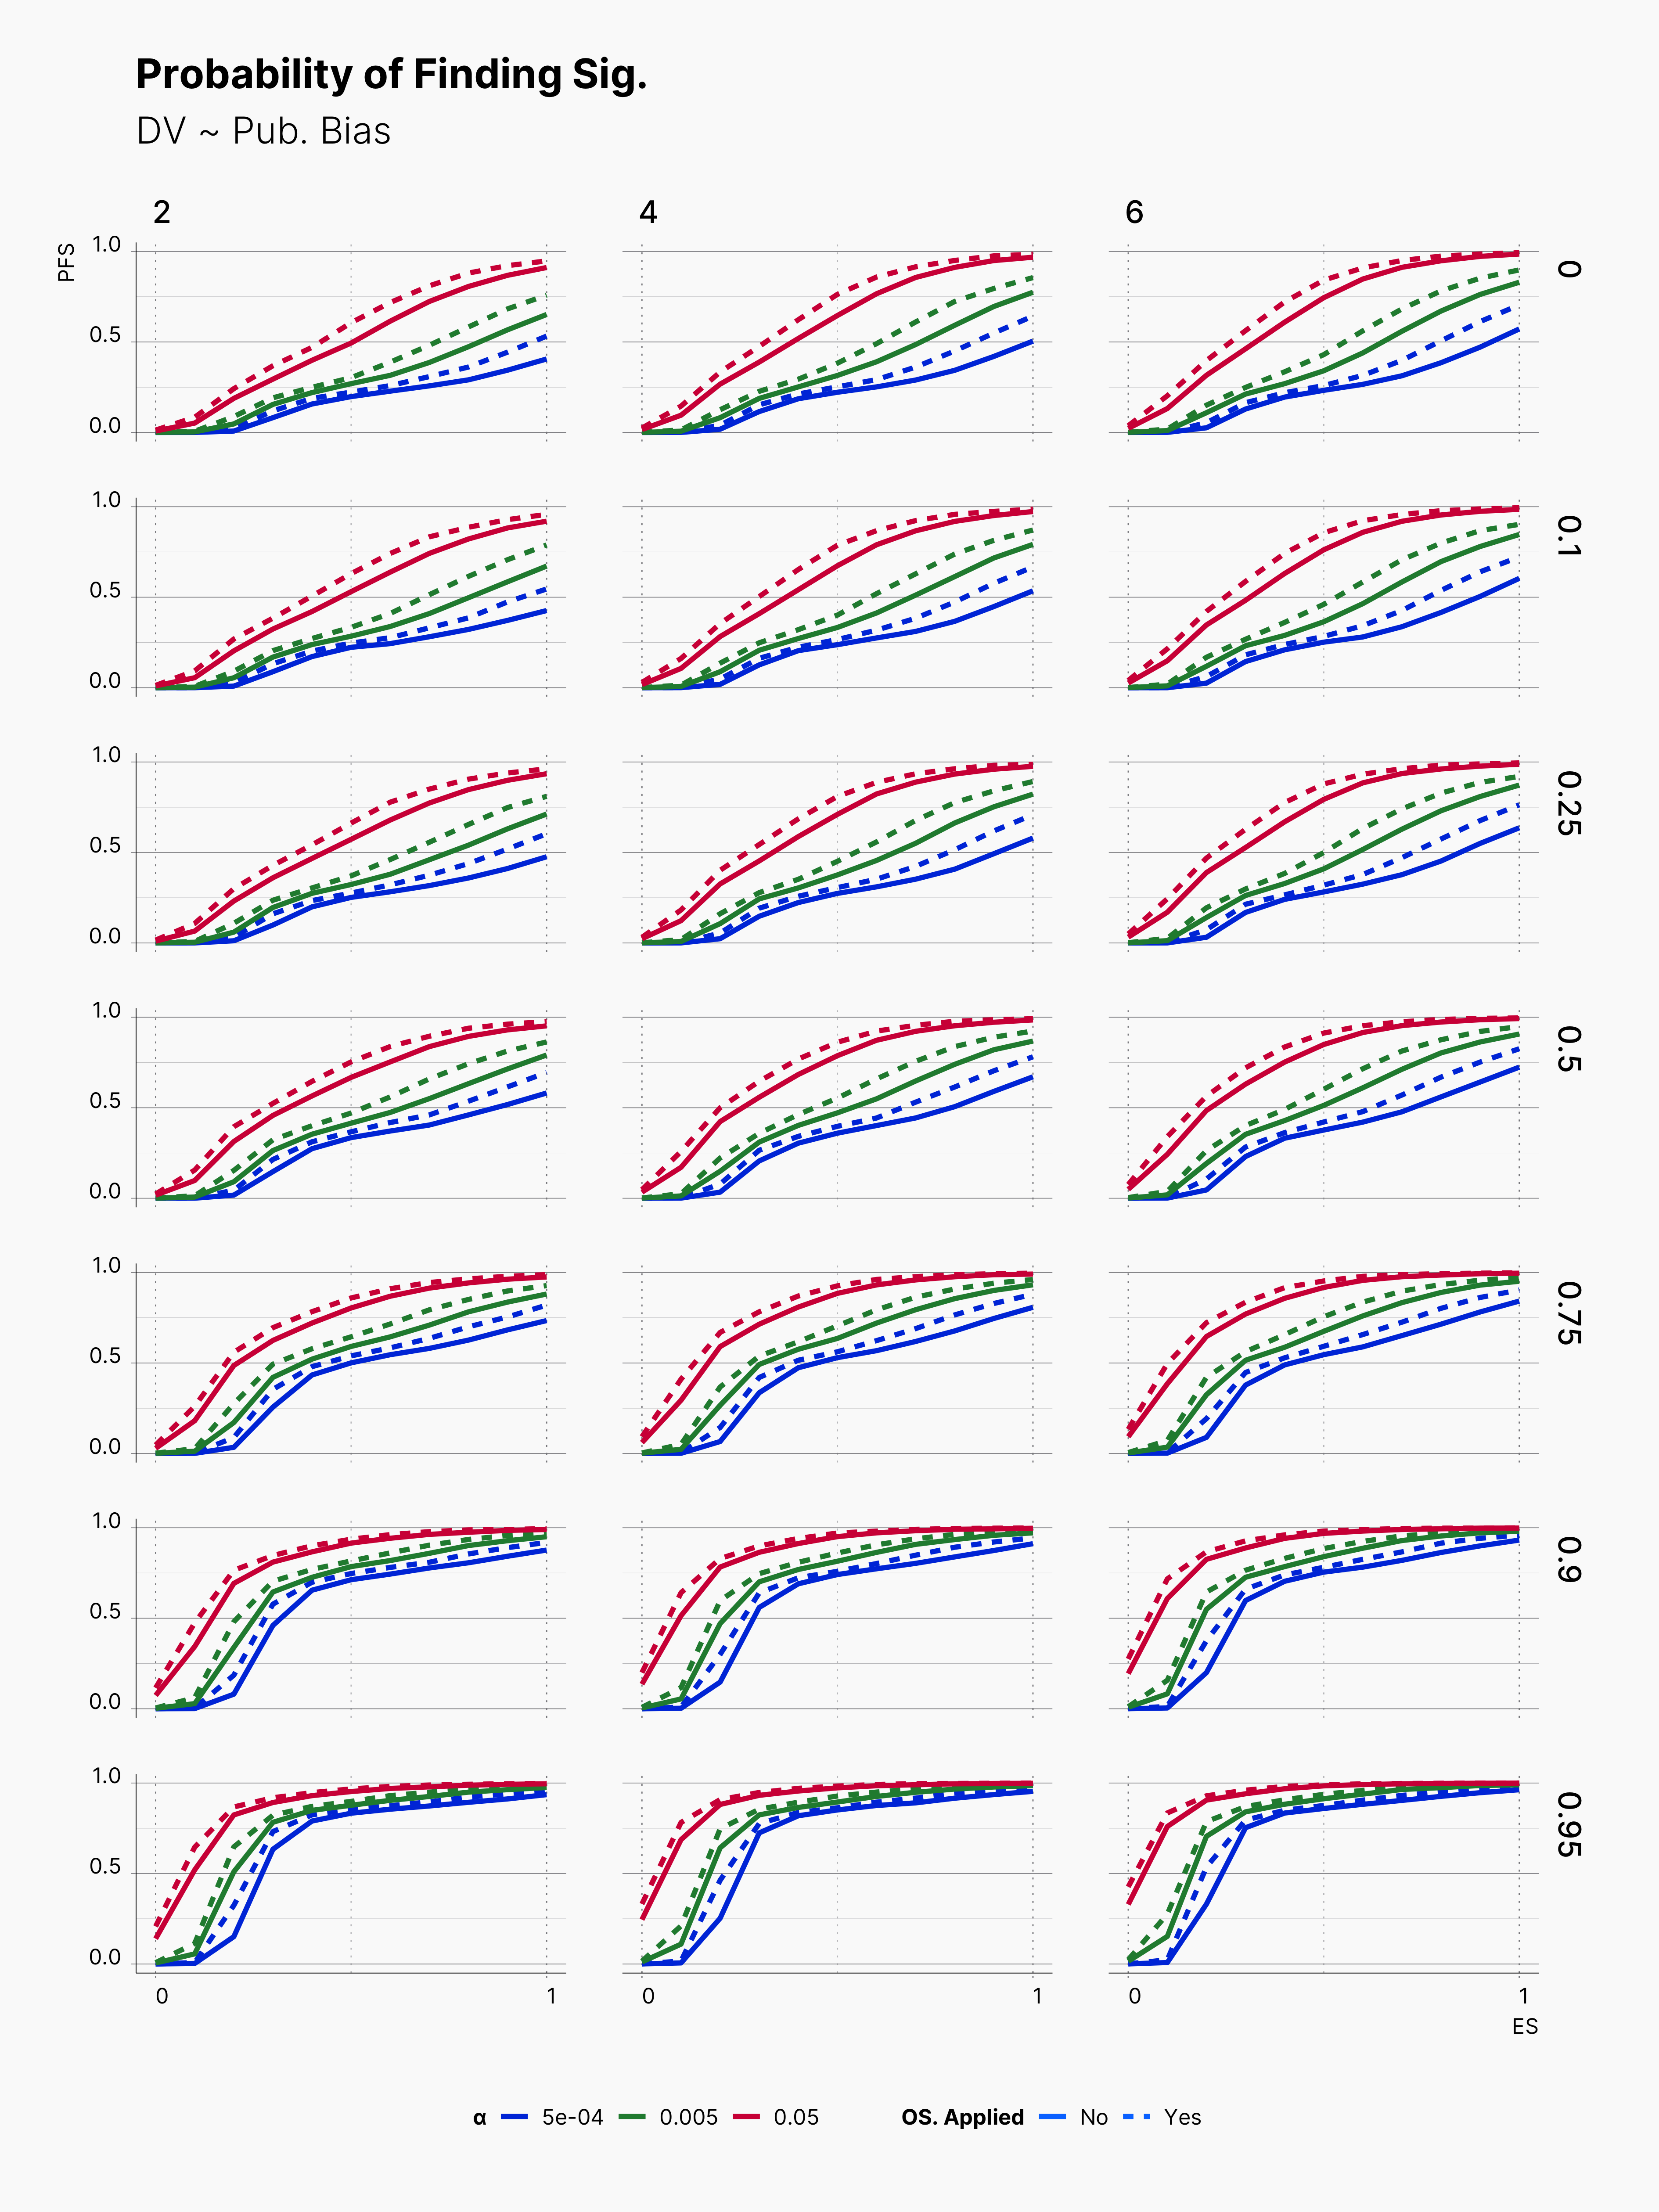
As before, we investigate the probability of finding significant results. The figure below shows the overall level of PFS in different scenarios. As before, we can see that optional stopping does not greatly streches the chance of finding significant results. As this is consistent with our previous observations, we may speculate that optional stopping might not necessarily helps one in its journey of finding significant results.
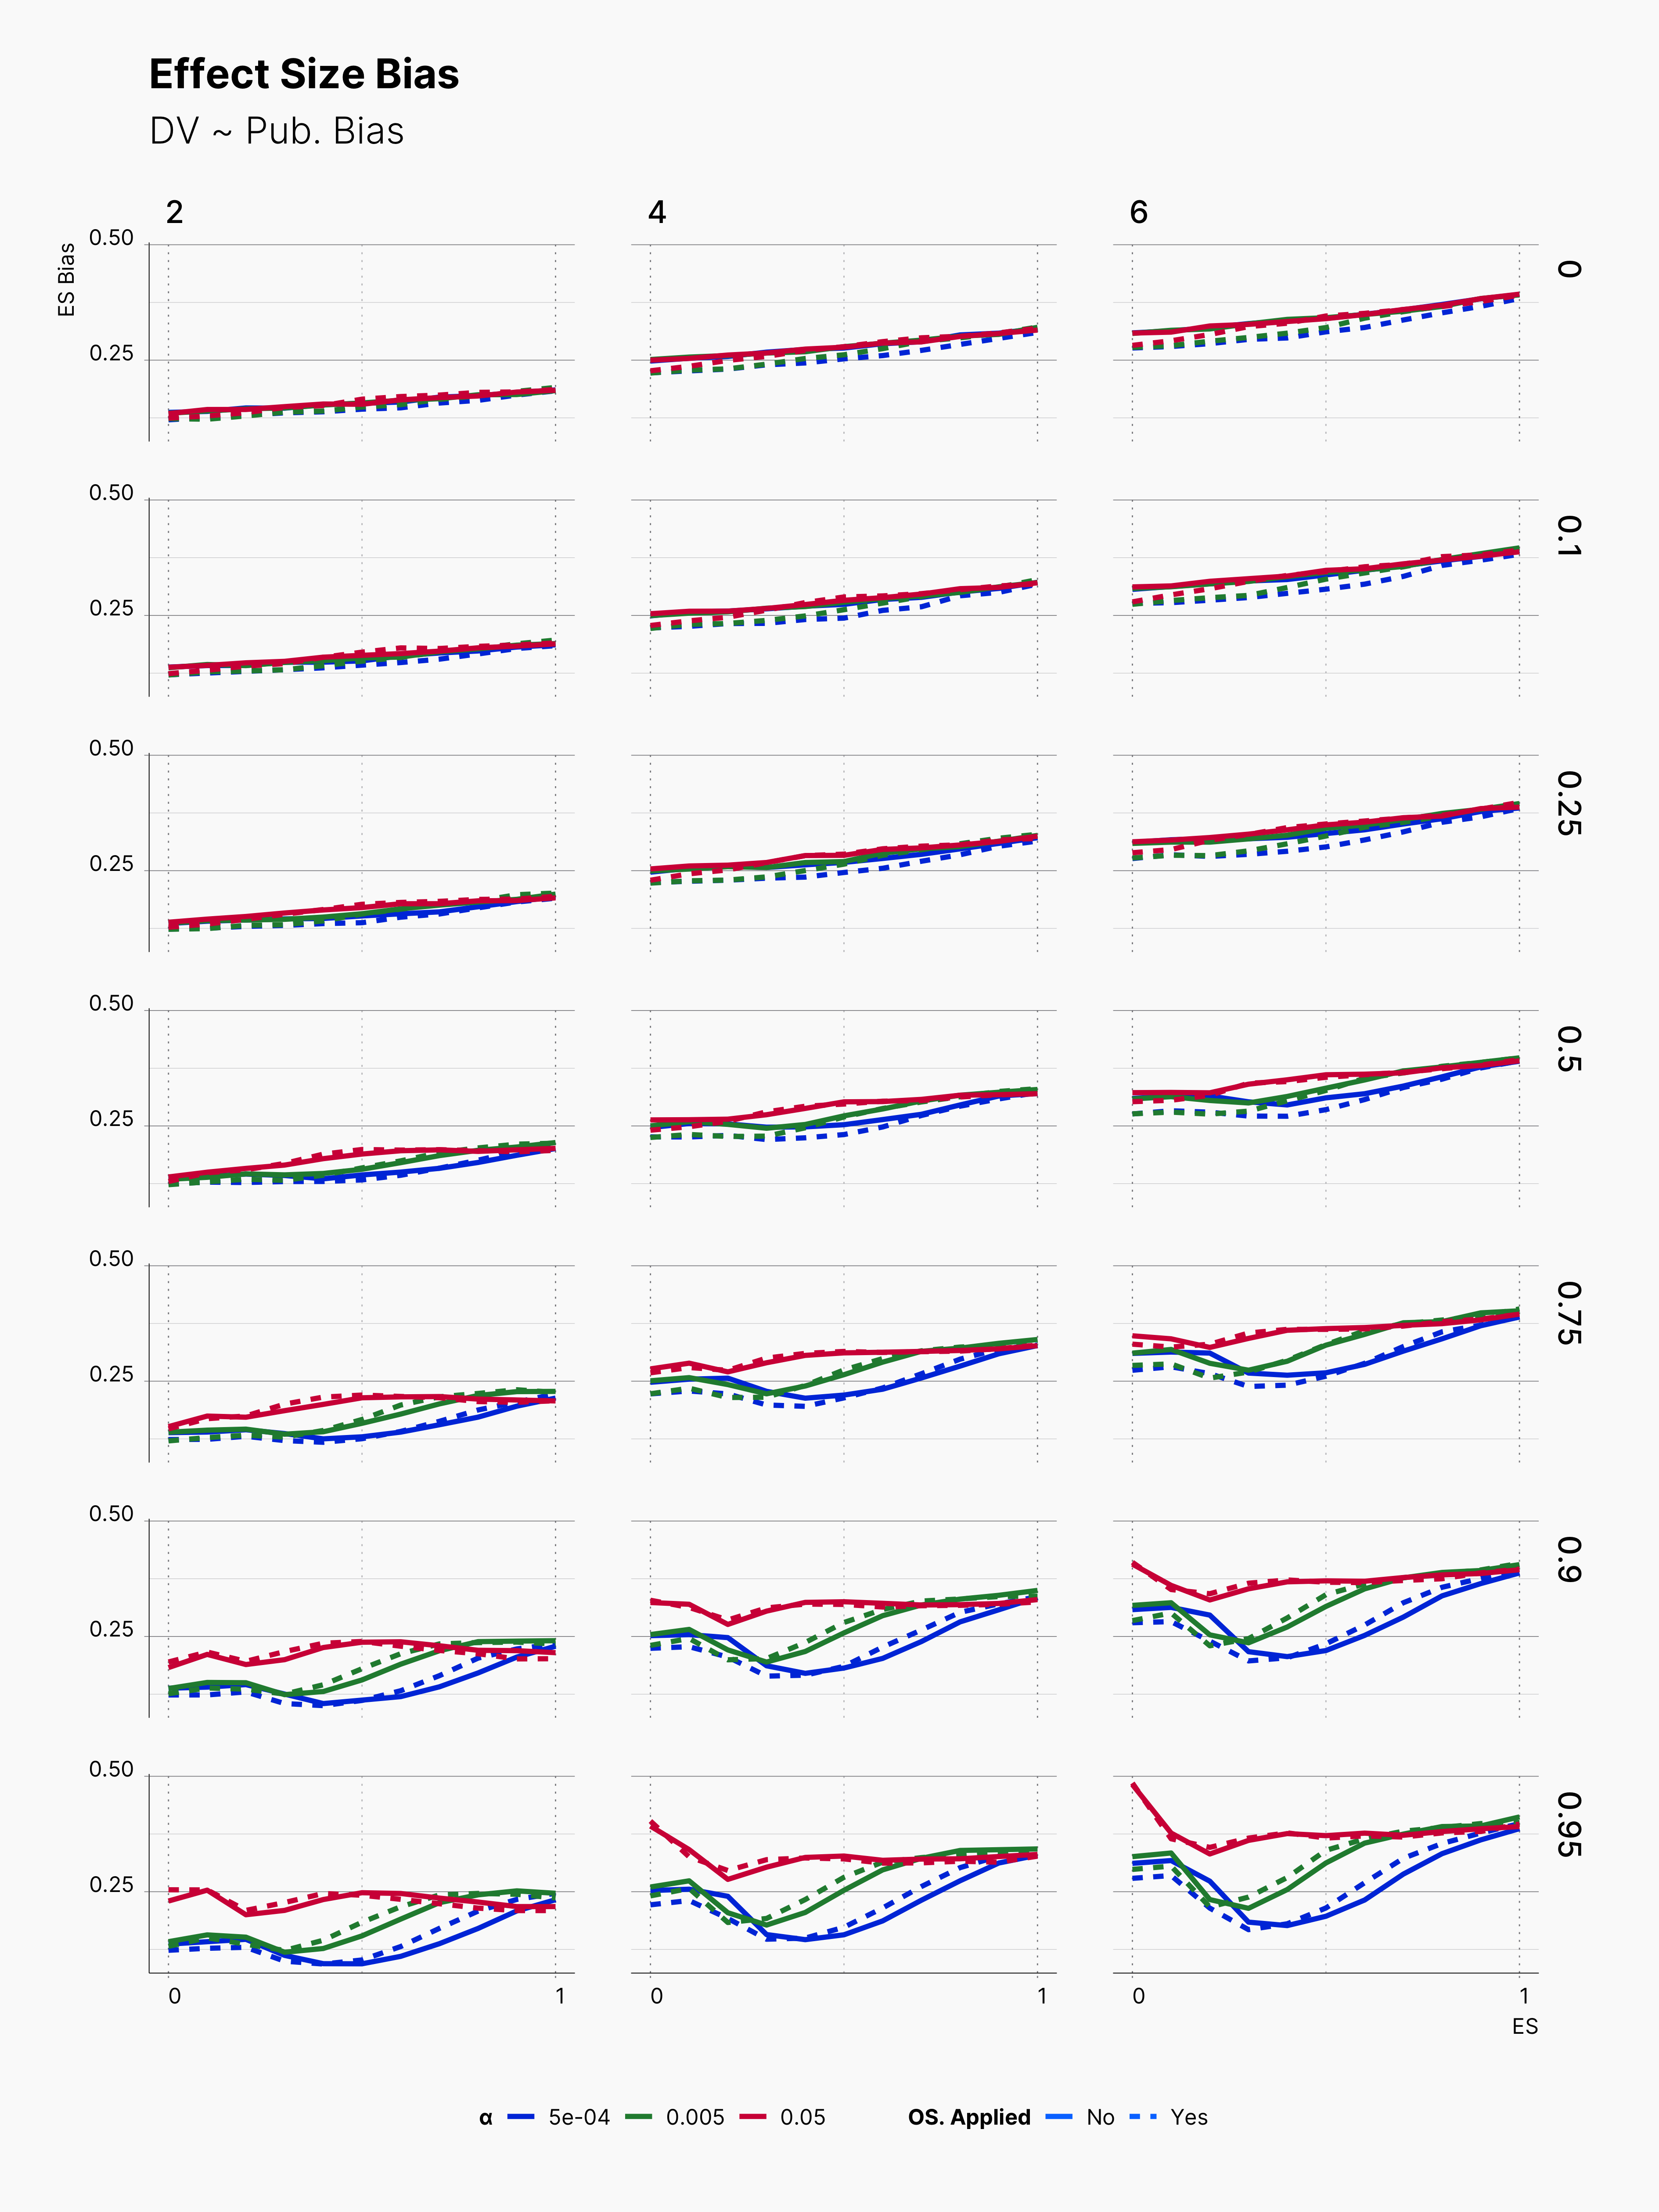
Similarly, we see a minimal variation in the level of bias!
Publication Bias
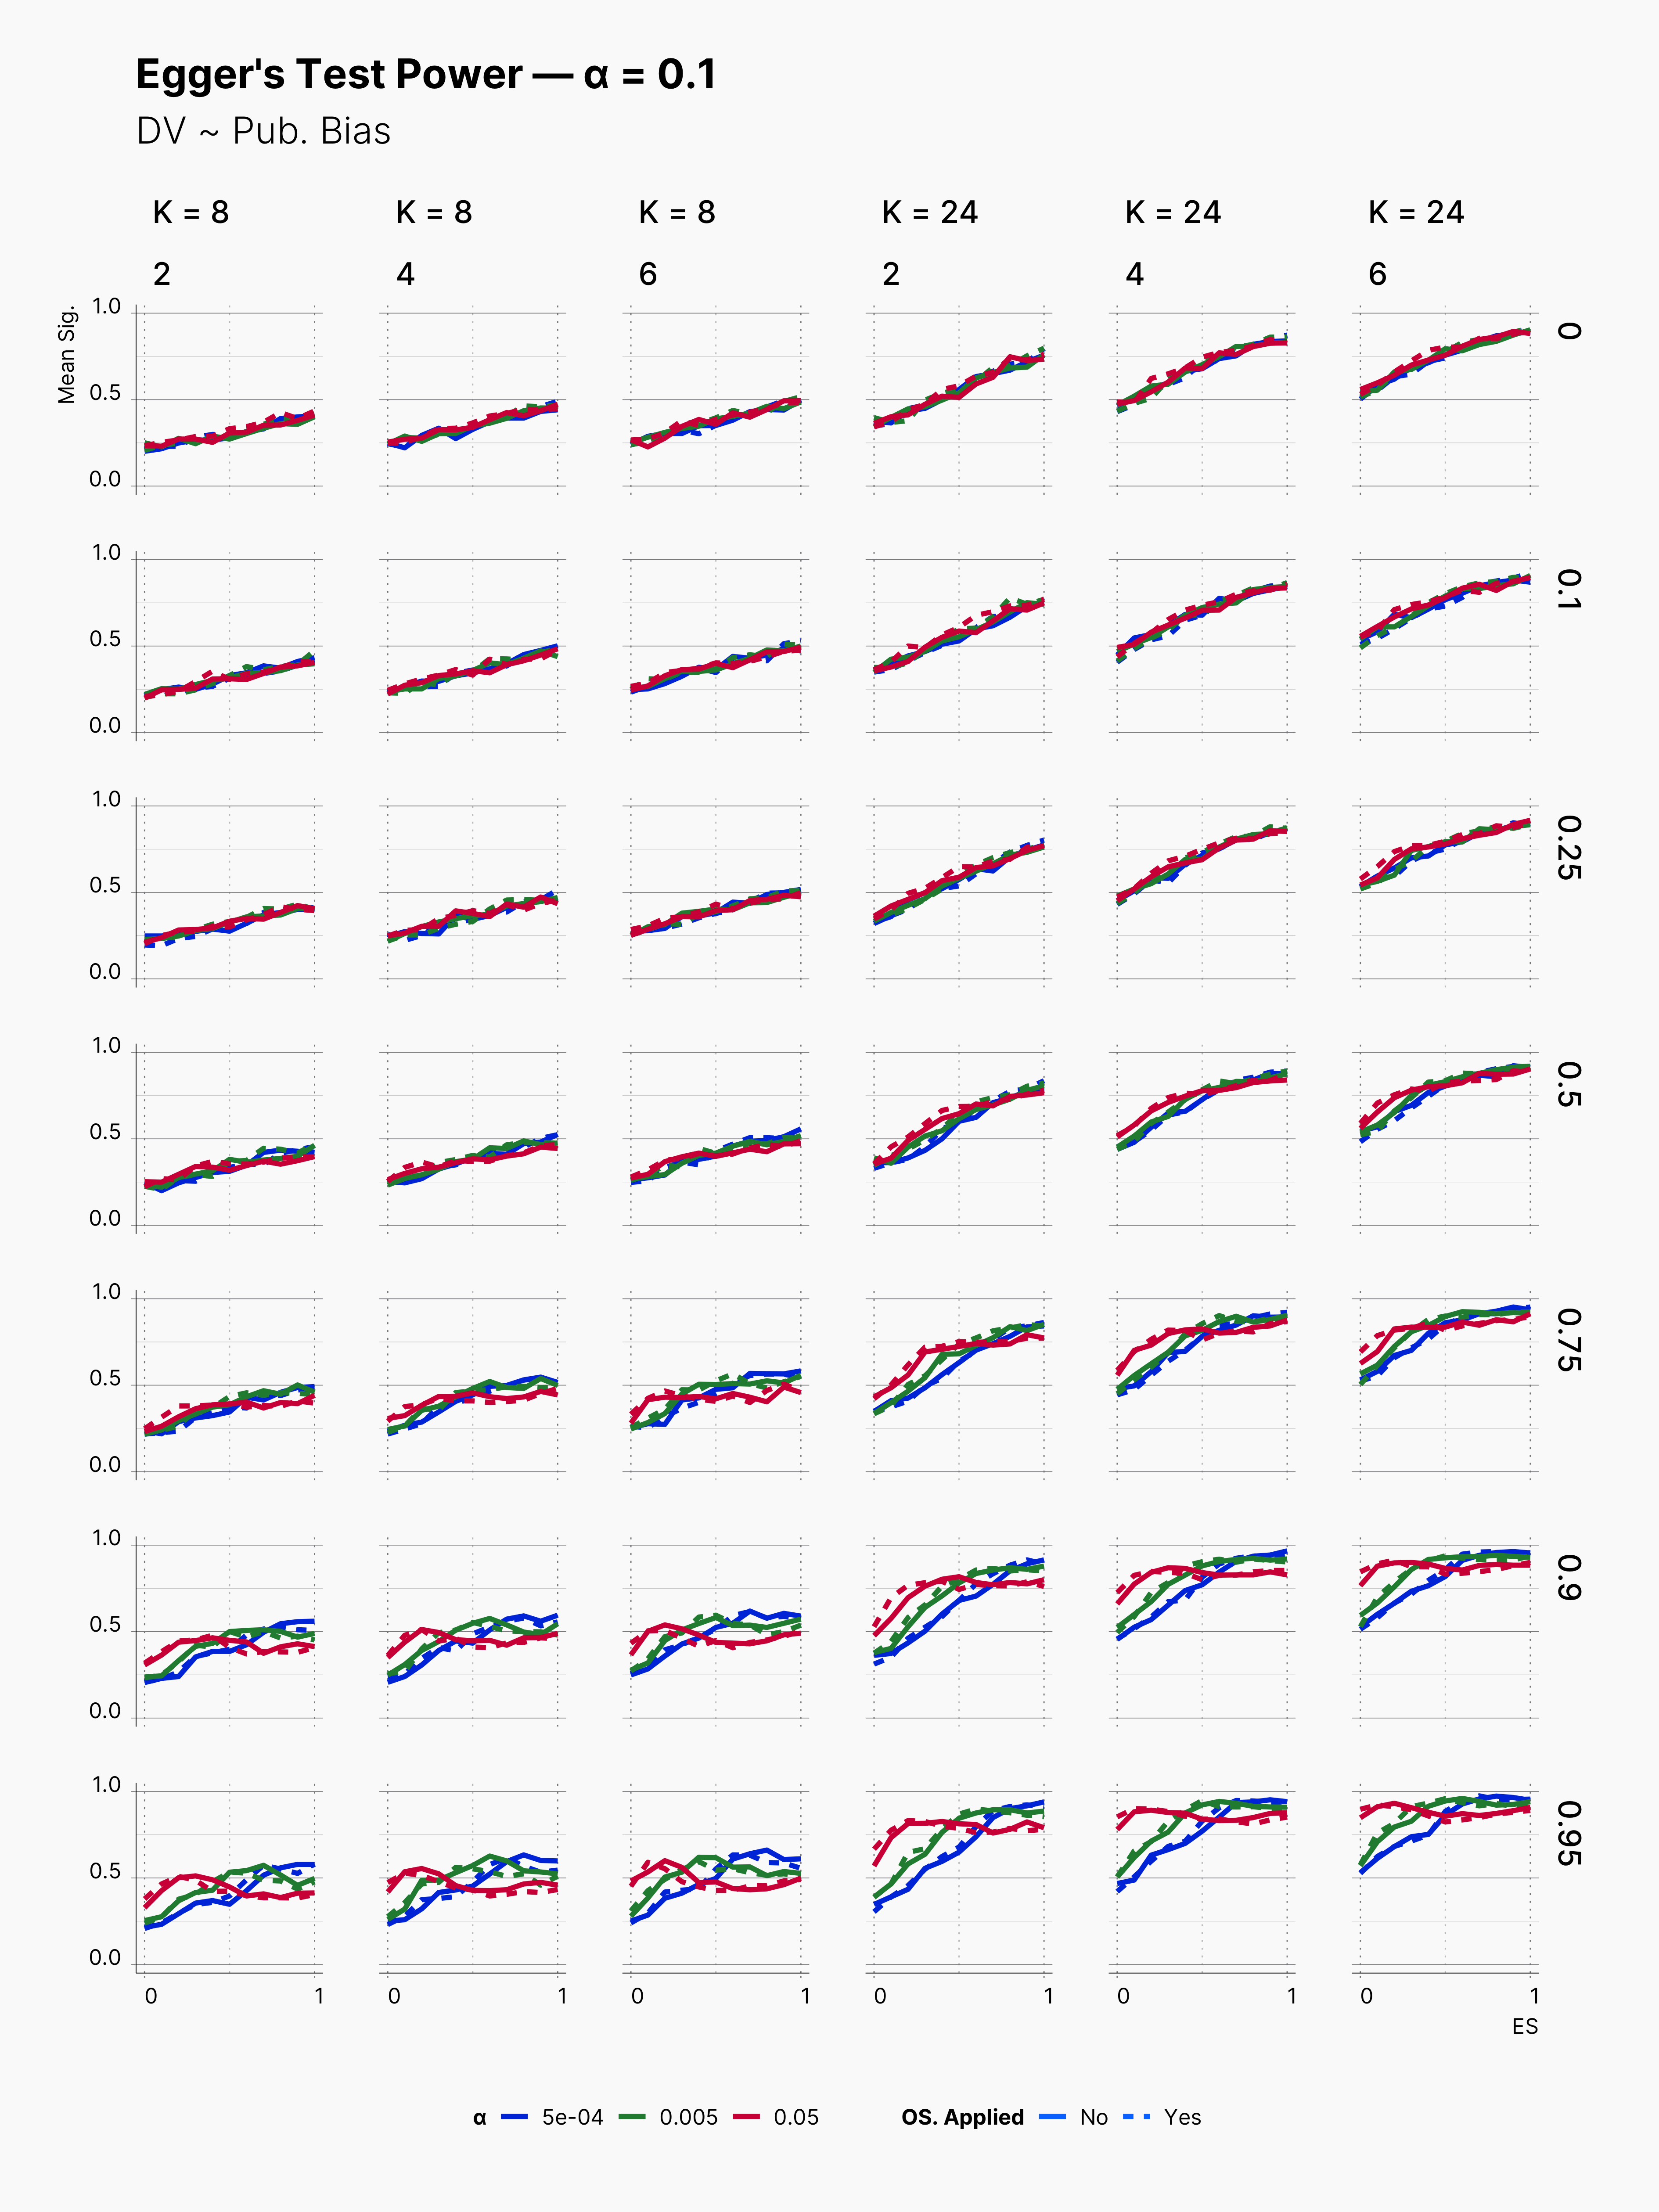
Looking into our publication bias measures, we see similar trends as before in many different parameters pools. Egger's test perform well within higher true effect sizes, and loses its edge in lower effect sizes. Moreover, we again see a minimal influece of optional stopping on its power.
One interesting difference in Egger's test performance is high positive rate within journals with low publication bias. Notice three top-right figures where we simulated a journal with no publication bias; but, Egger's test is very confident taht we are dealing with very high publication bias.
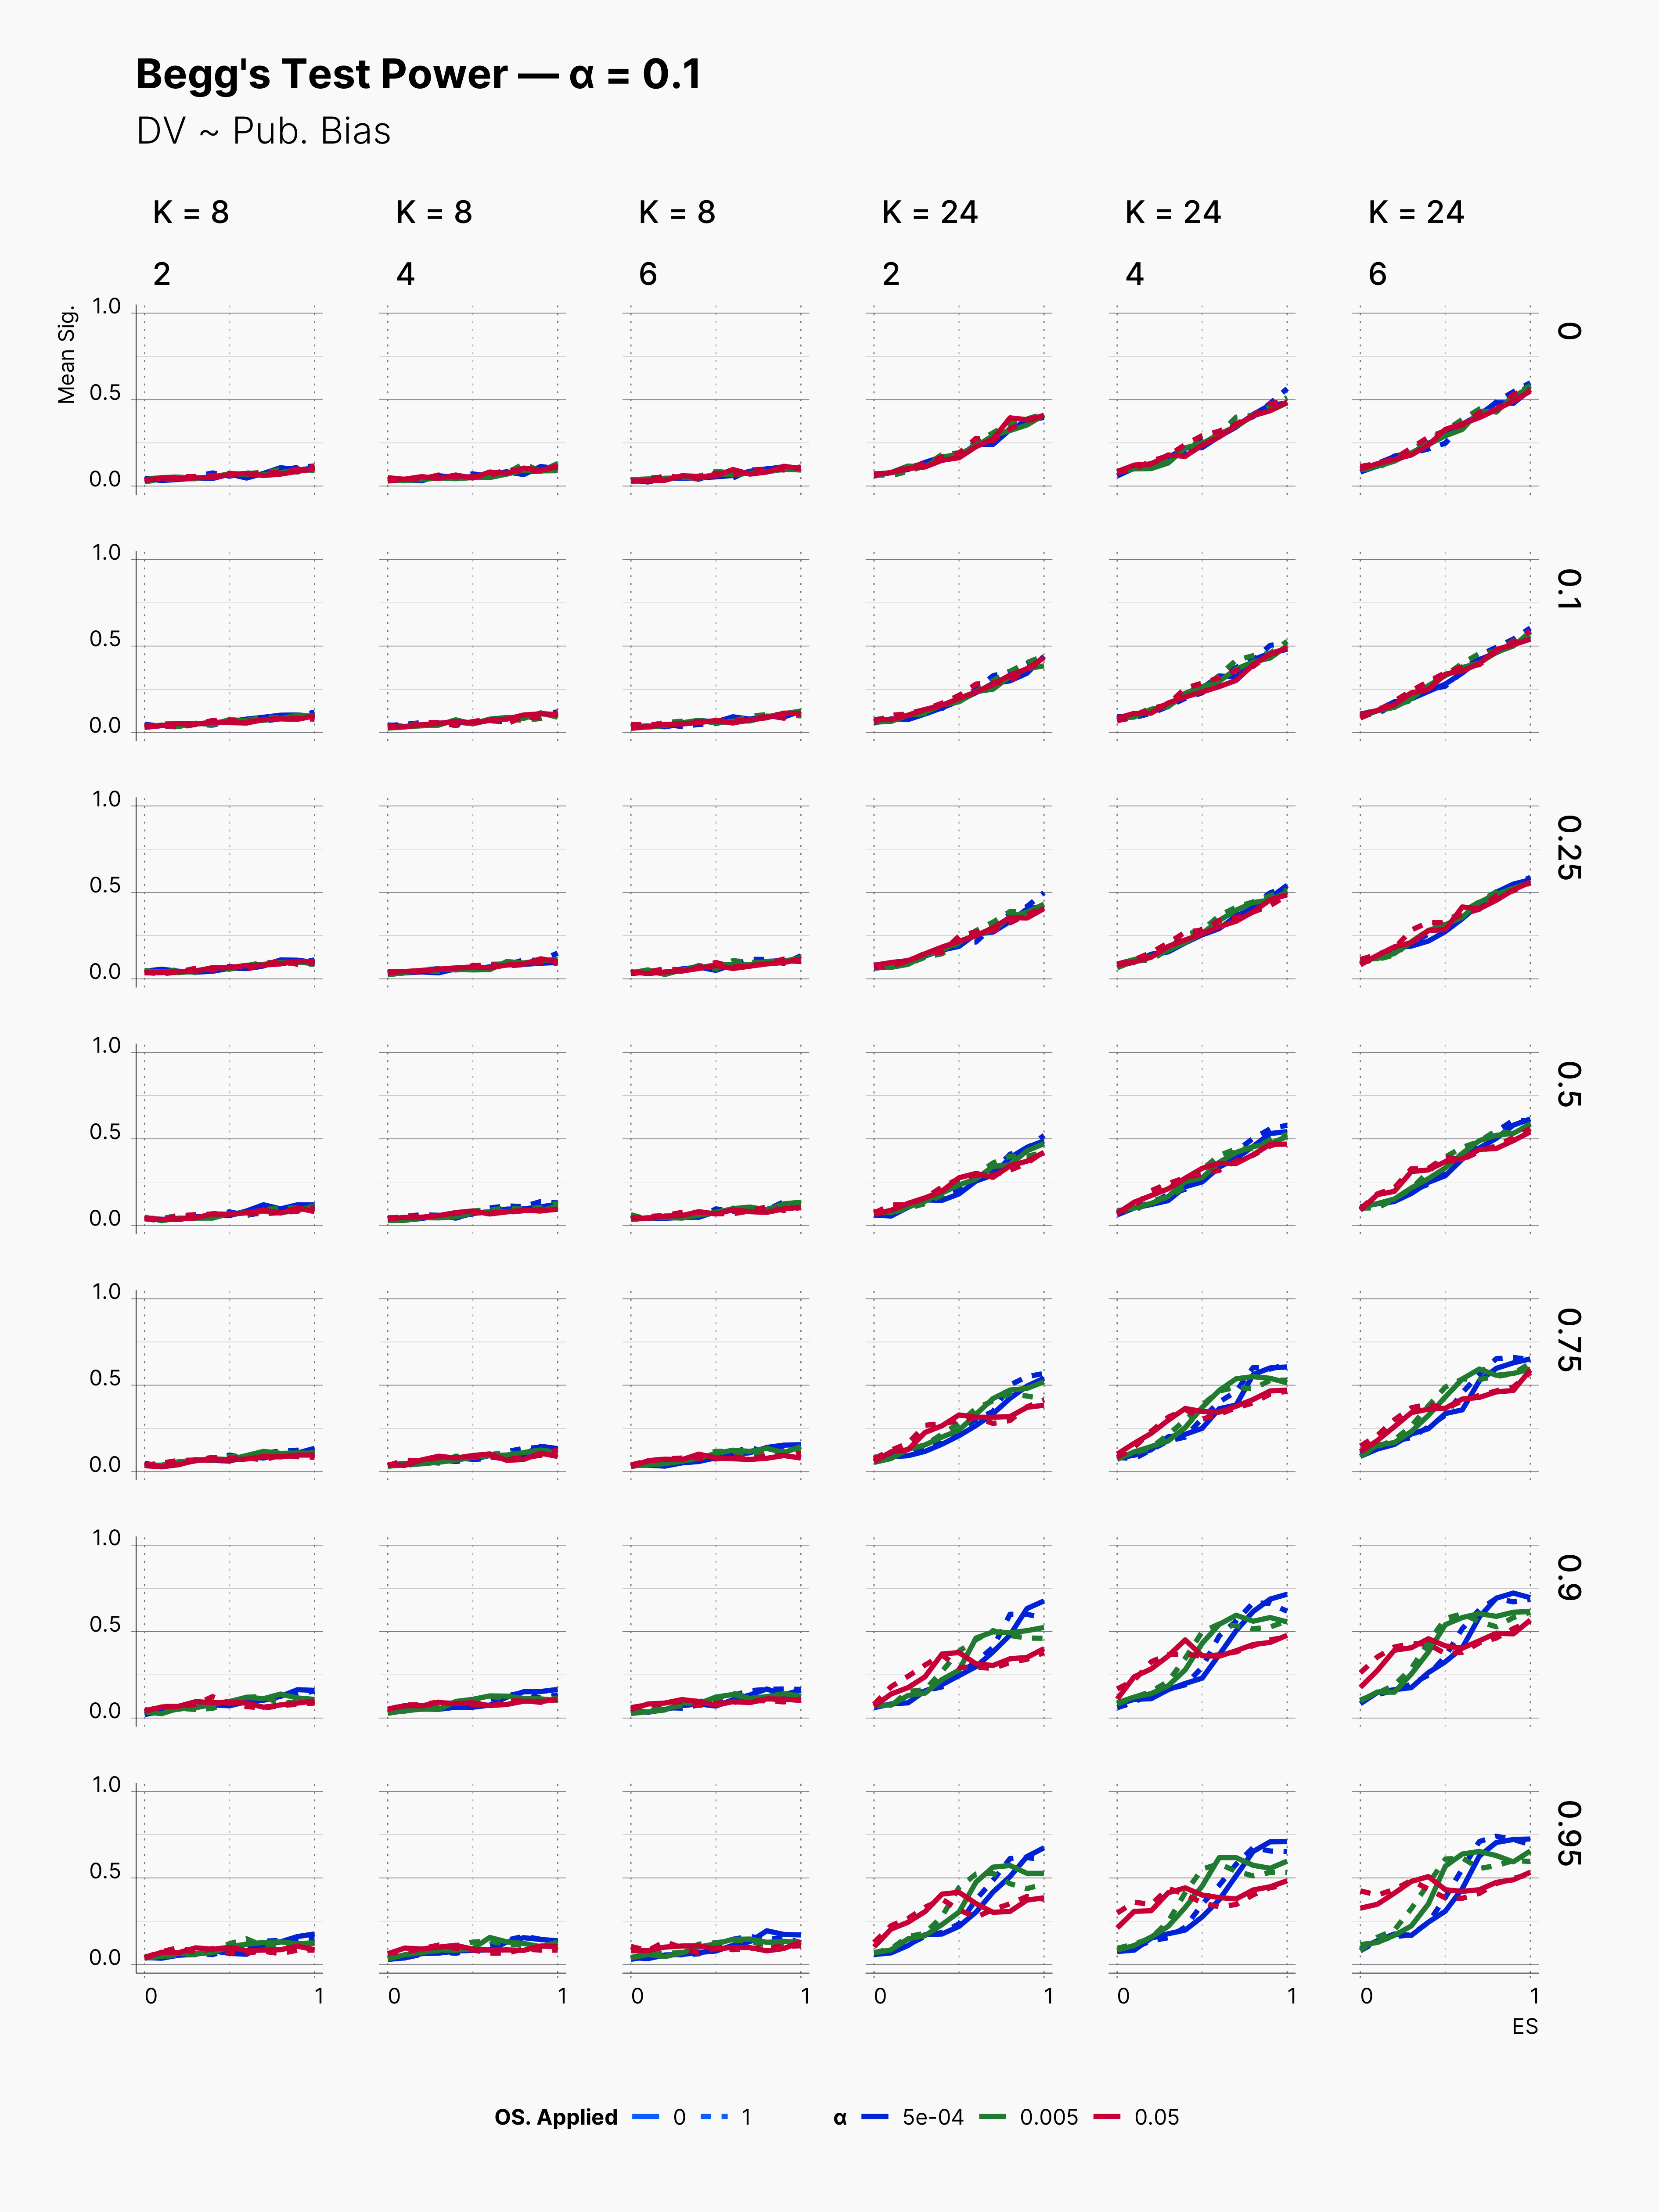
The same true is for Begg's test, ie., very lower power with K = 8, with power improving as we increase K to 24. In contrast to Egger's, Begg's test seems to be more conservative with announcing publication bias when no publication bias is present.
Conclusion
Appendix A: Effect of Different Number of Attemps in Optional Stopping
Effect Size Bias
First Extension: Effect Size Bias
