Selection Variation
In this study we investigate the effect of varying Researcher's intial selection policy. As we discussed, by modifying each of the selection → decision routine, we can influence Researcher's judgments on his research. This is as we enforce the Researcher to take different paths when it comes to reporting his final outcome, a.k.a, Selective Reporting.
Here, we are interested in finding how different choices influence the Probability of Finding Significant, PFS, and Level of Bias.
Study Design and Parameters Pool
We start by a simple Linear Model consists of two groups, and variable number of dependant variables.
Configuration: Data Strategy
"experiment_parameters": {
    "n_reps": 1,
    "n_conditions": 2,
    "n_dep_vars": m,
    "n_obs": N,
    "data_strategy": {
        "name": "LinearModel",
        "measurements": {
            "dist": "mvnorm_distribution",
            "means": μ,
            "covs": 0.5,
            "stddevs": 1.0
        }
    }
    ...
}
In order to study the effect of selective reporting on a wide range of study design and parameters, we will simulate all combinations of following parameters:
- μ ∈ [0, 1]
- m ∈ {2, 3, 4, 5}
- N ∈ {5, 10, 20, 30, 50, 80}
- Pb ∈ {0, 0.1, 0.25, 0.5, 0.75, 0.9, 0.95}
As discussed, we achieve the selective reporting through the alternation of initial_selection_policies, i.e., Researcher's first prefered choice. Each item in the list below indicates Researcher's first and prefered choice.
["sig", "effect > 0", "first"]["sig", "effect > 0", "random"]["sig", "effect > 0", "last"]["sig", "effect > 0", "min(pvalue)"]["sig", "effect > 0", "max(pvalue)"]
As we discussed, initial_selection_policies is a Policy Chain Set, meaning that it can be followed by alternatives in the case of the Researcher not being able to find an outcome with the given criteria. We follow each selection with two Policy Chain, ["effect > 0", "min(pvalue)"], ["effect < 0", "max(pvalue)"]. In this configuration, our Researcher priotrizes each set after failing to satisfy the previous set. Due to the fact that the first policy chain is the only policy chain emphesizing on significant, the aggregate outcome of the simulation can be used to measure the Probablity Of Finding Significant results, a.k.a, Proportion Of Significant results.
Configuration: Initial Selection Policy
{
    "decision_strategy": {
        "name": "DefaultDecisionMaker",
        "initial_selection_policies": [
            ["sig", "effect > 0", "max(pvalue)"],
            ["effect > 0", "min(pvalue)"],
            ["effect < 0", "max(pvalue)"]
        ],
        "will_start_hacking_decision_policies": [""],
        "stashing_policy": [""],
        "between_hacks_selection_policies": [[""]],
        "between_replications_selection_policies": [[""]],
        "will_continue_replicating_decision_policy": [""],
        "submission_decision_policies": [""]
    }
}
We can simply leave other selection and decision policies empty, as we do not plan to incorporate any further decision, hacking strategies or replications.
Journal: Publication Bias
1 2 3 4 5 6 7 8 9 10 11 | |
As for Journal's configuration, we can incorporate the Significant Selection method to account for different level of publications bias that we are planning to study.
Results
Landscape of Probability of Finding Significant
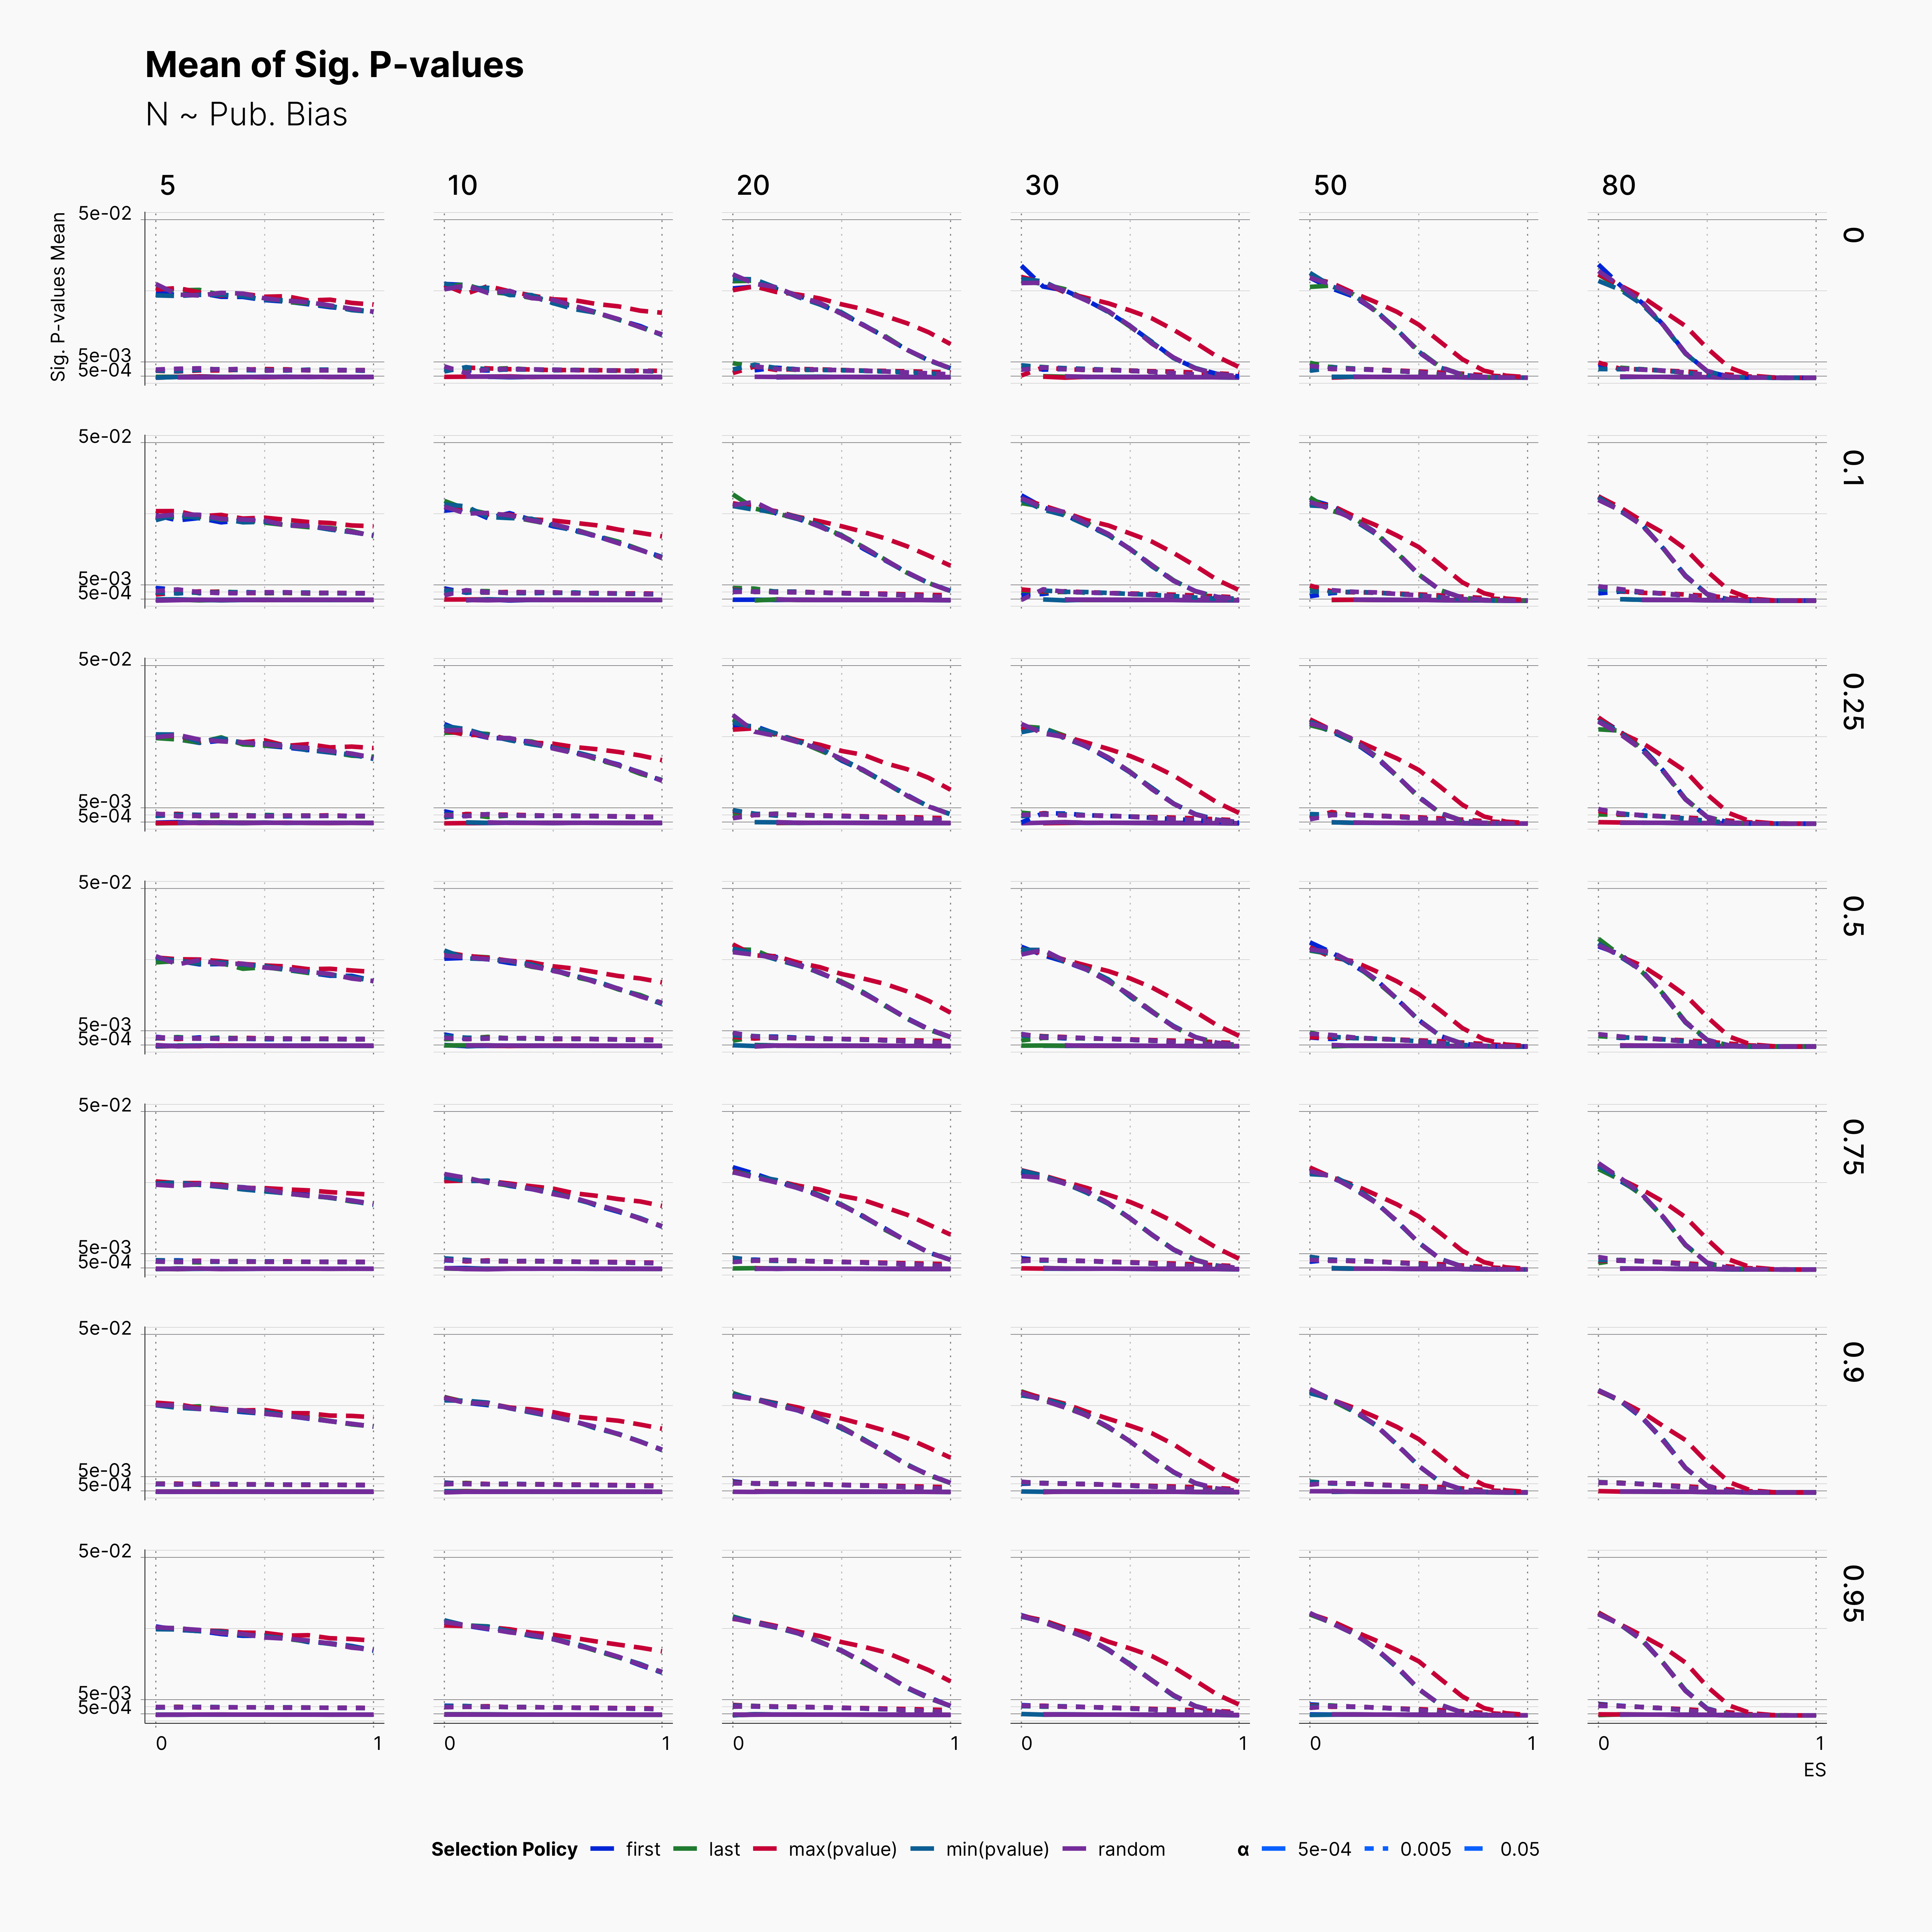
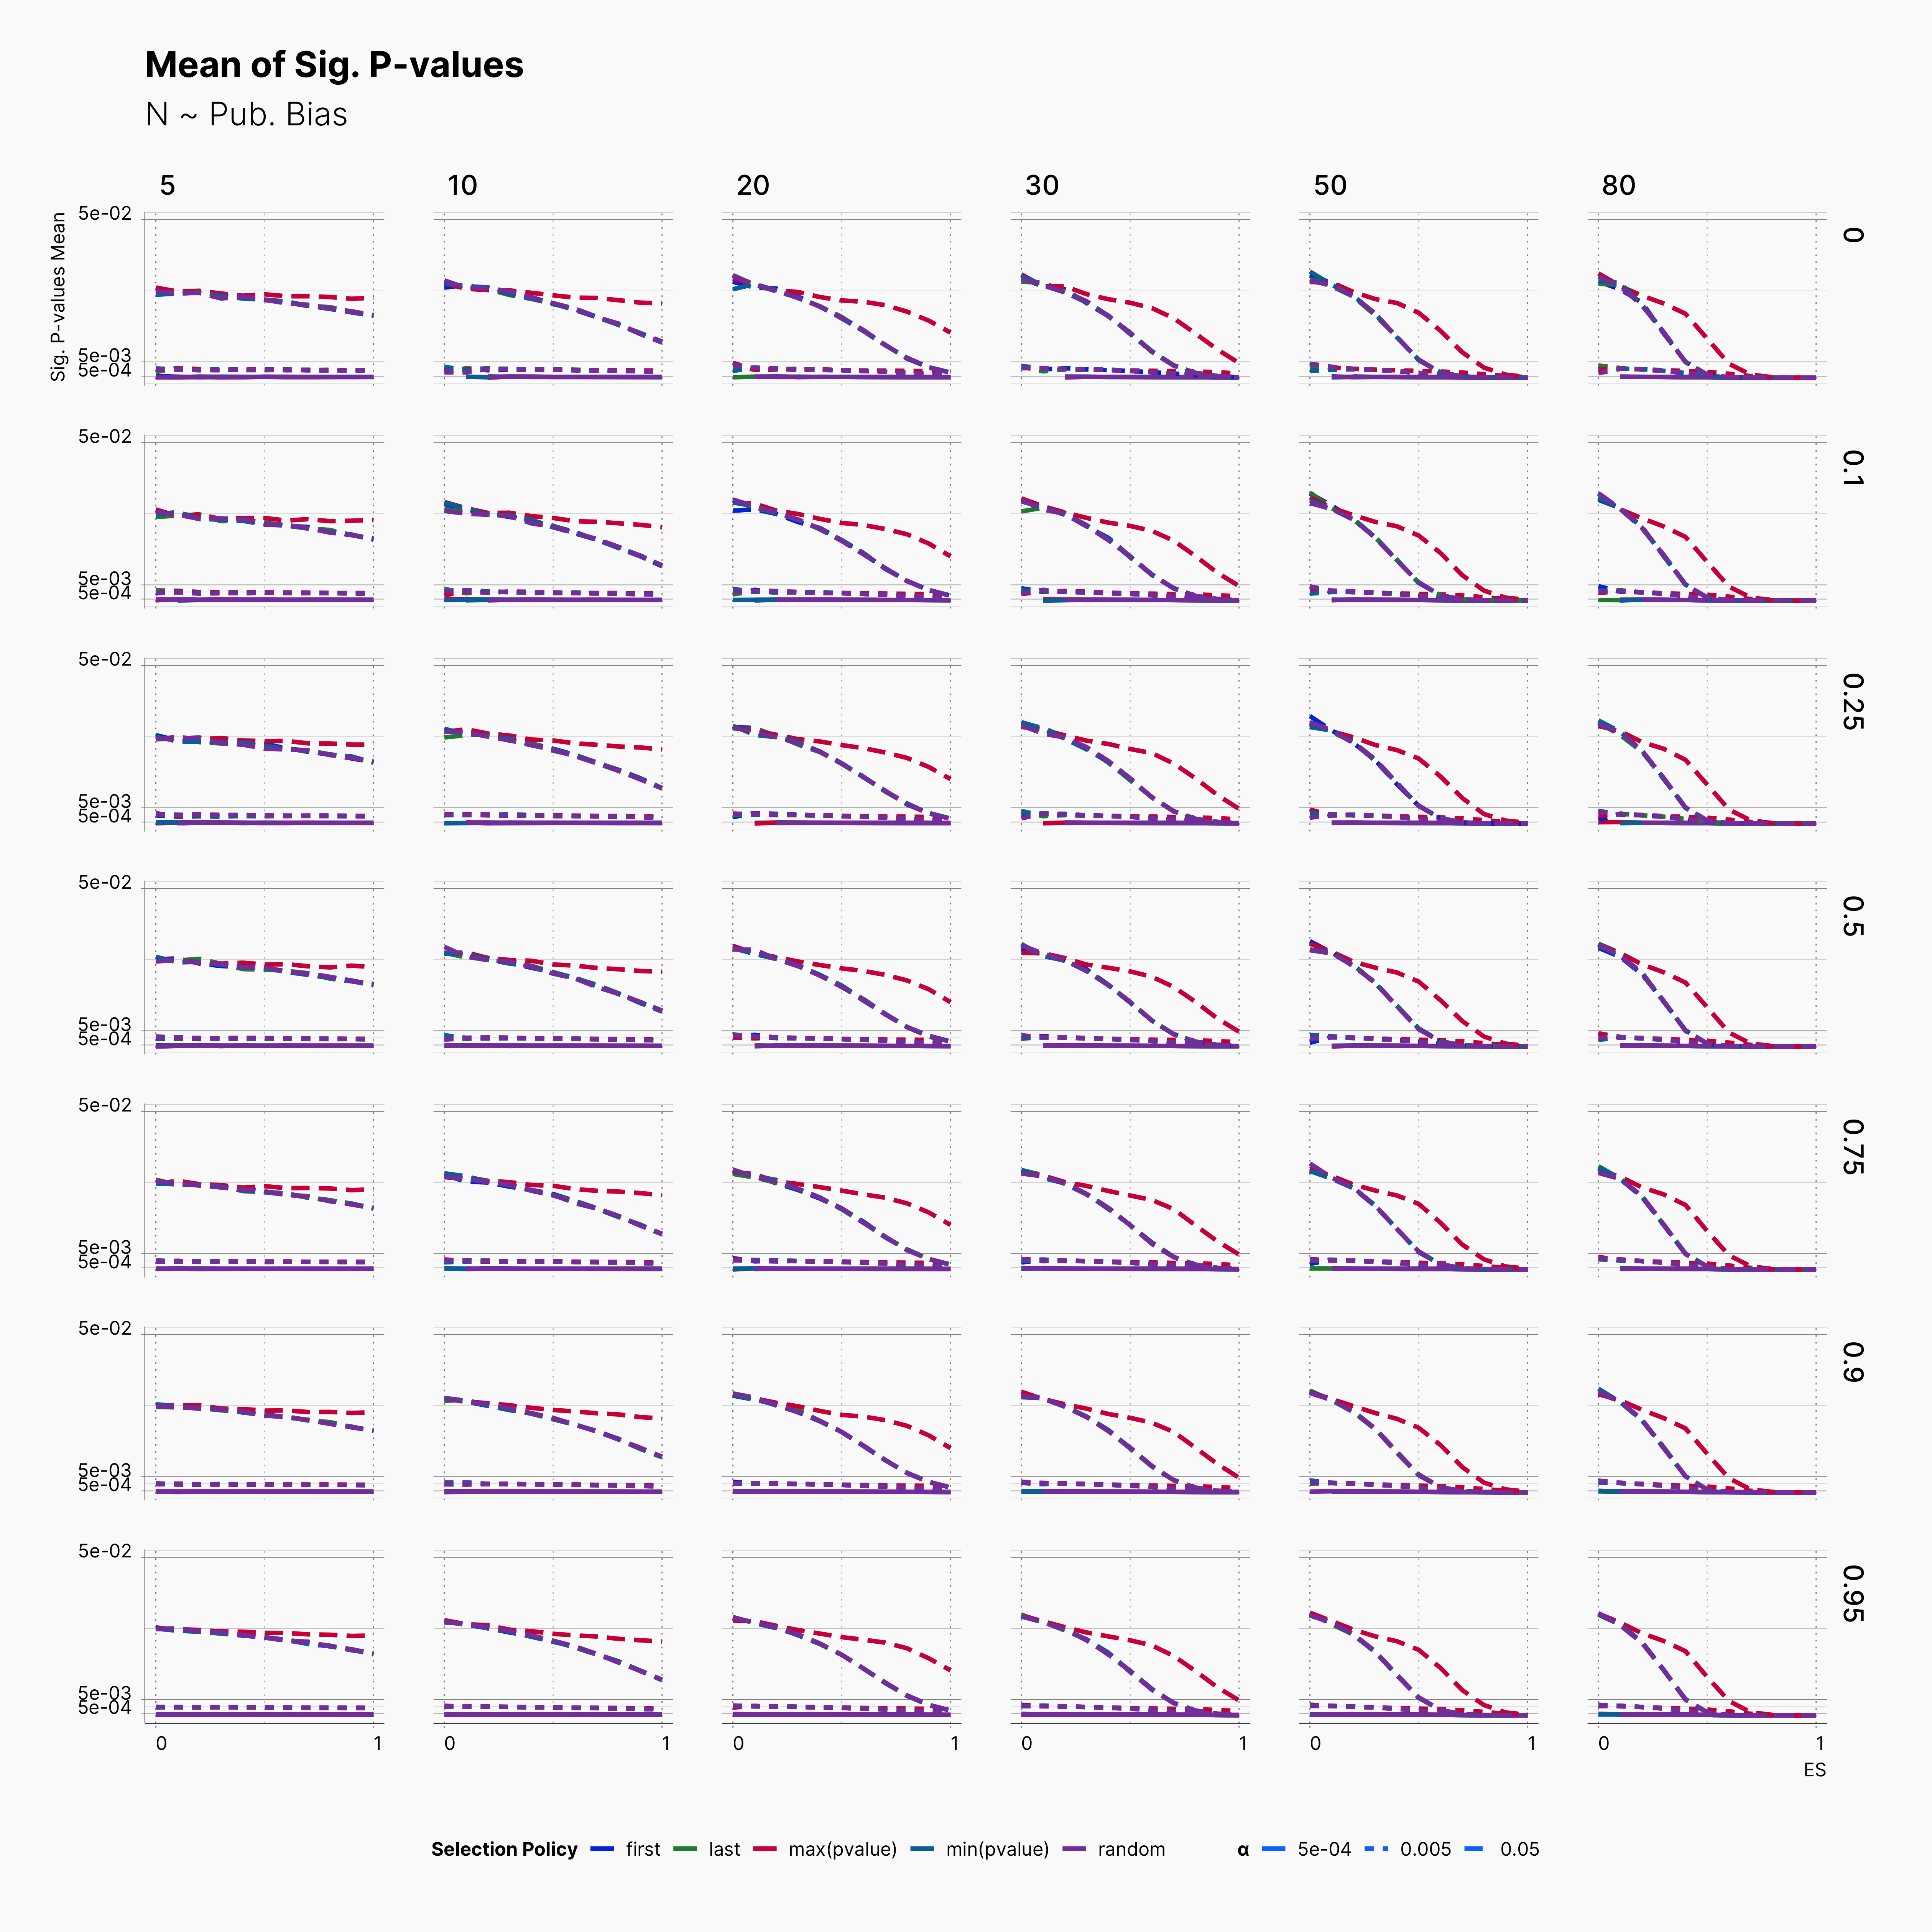
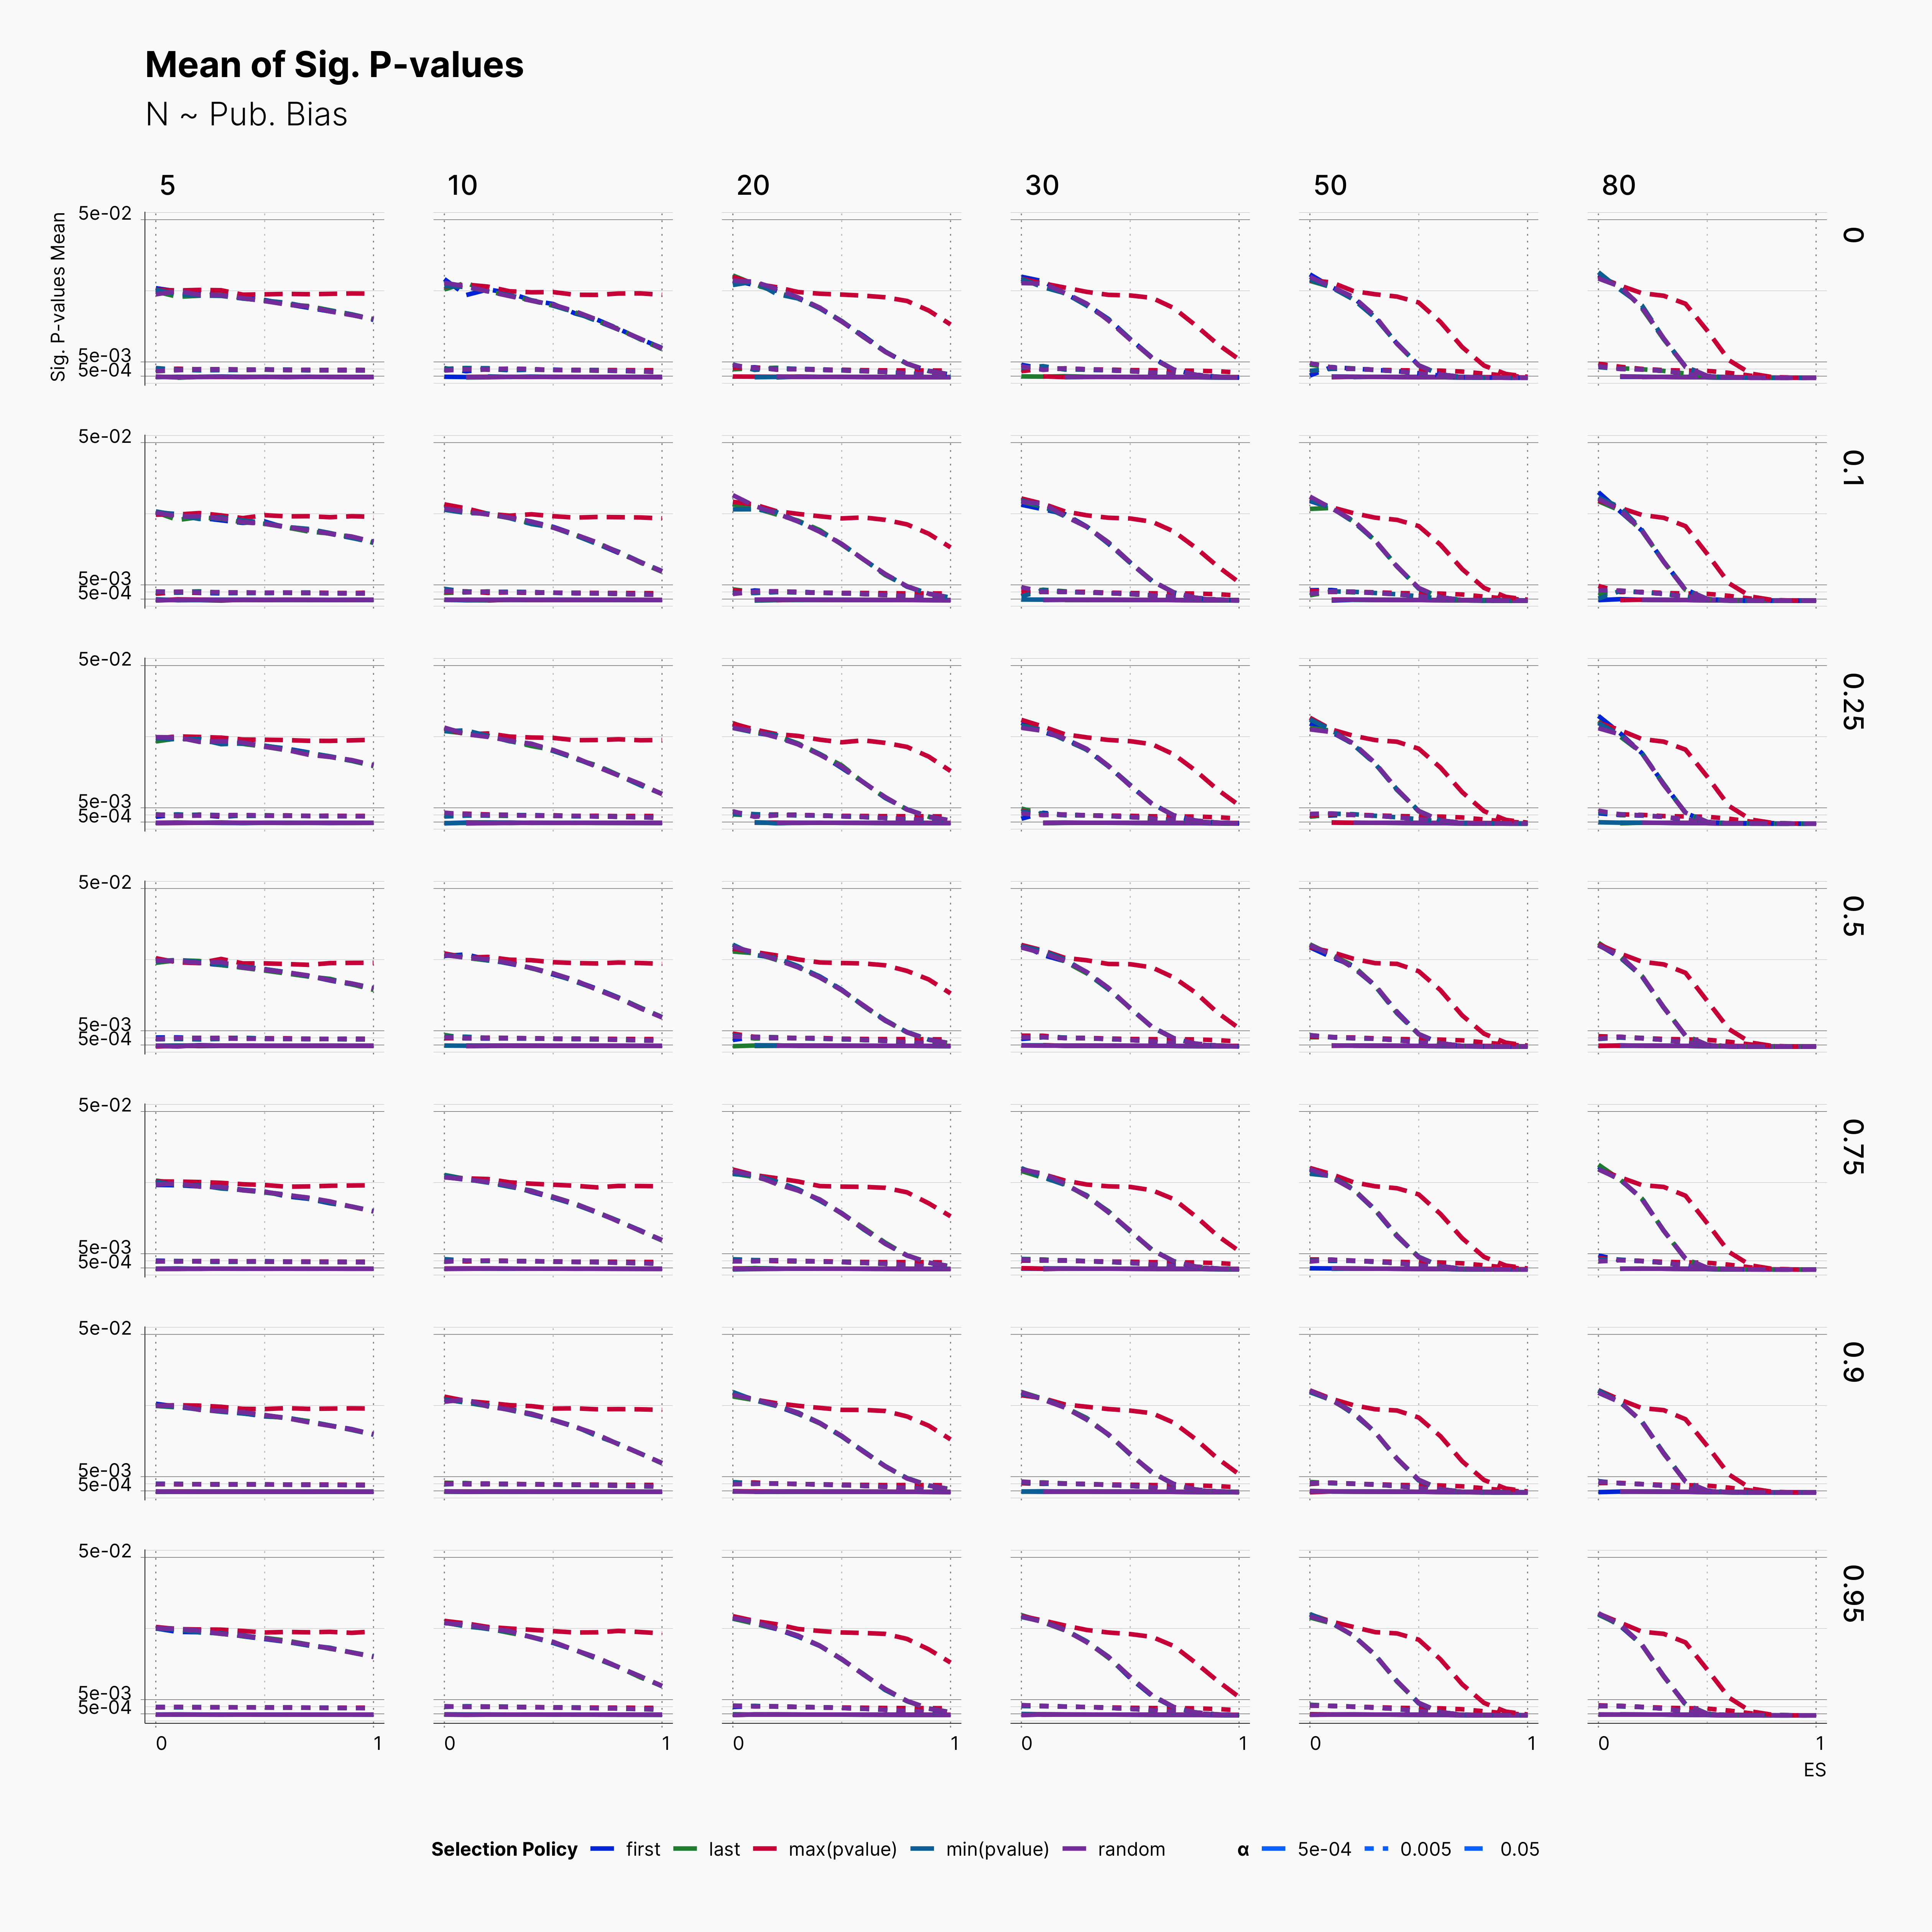
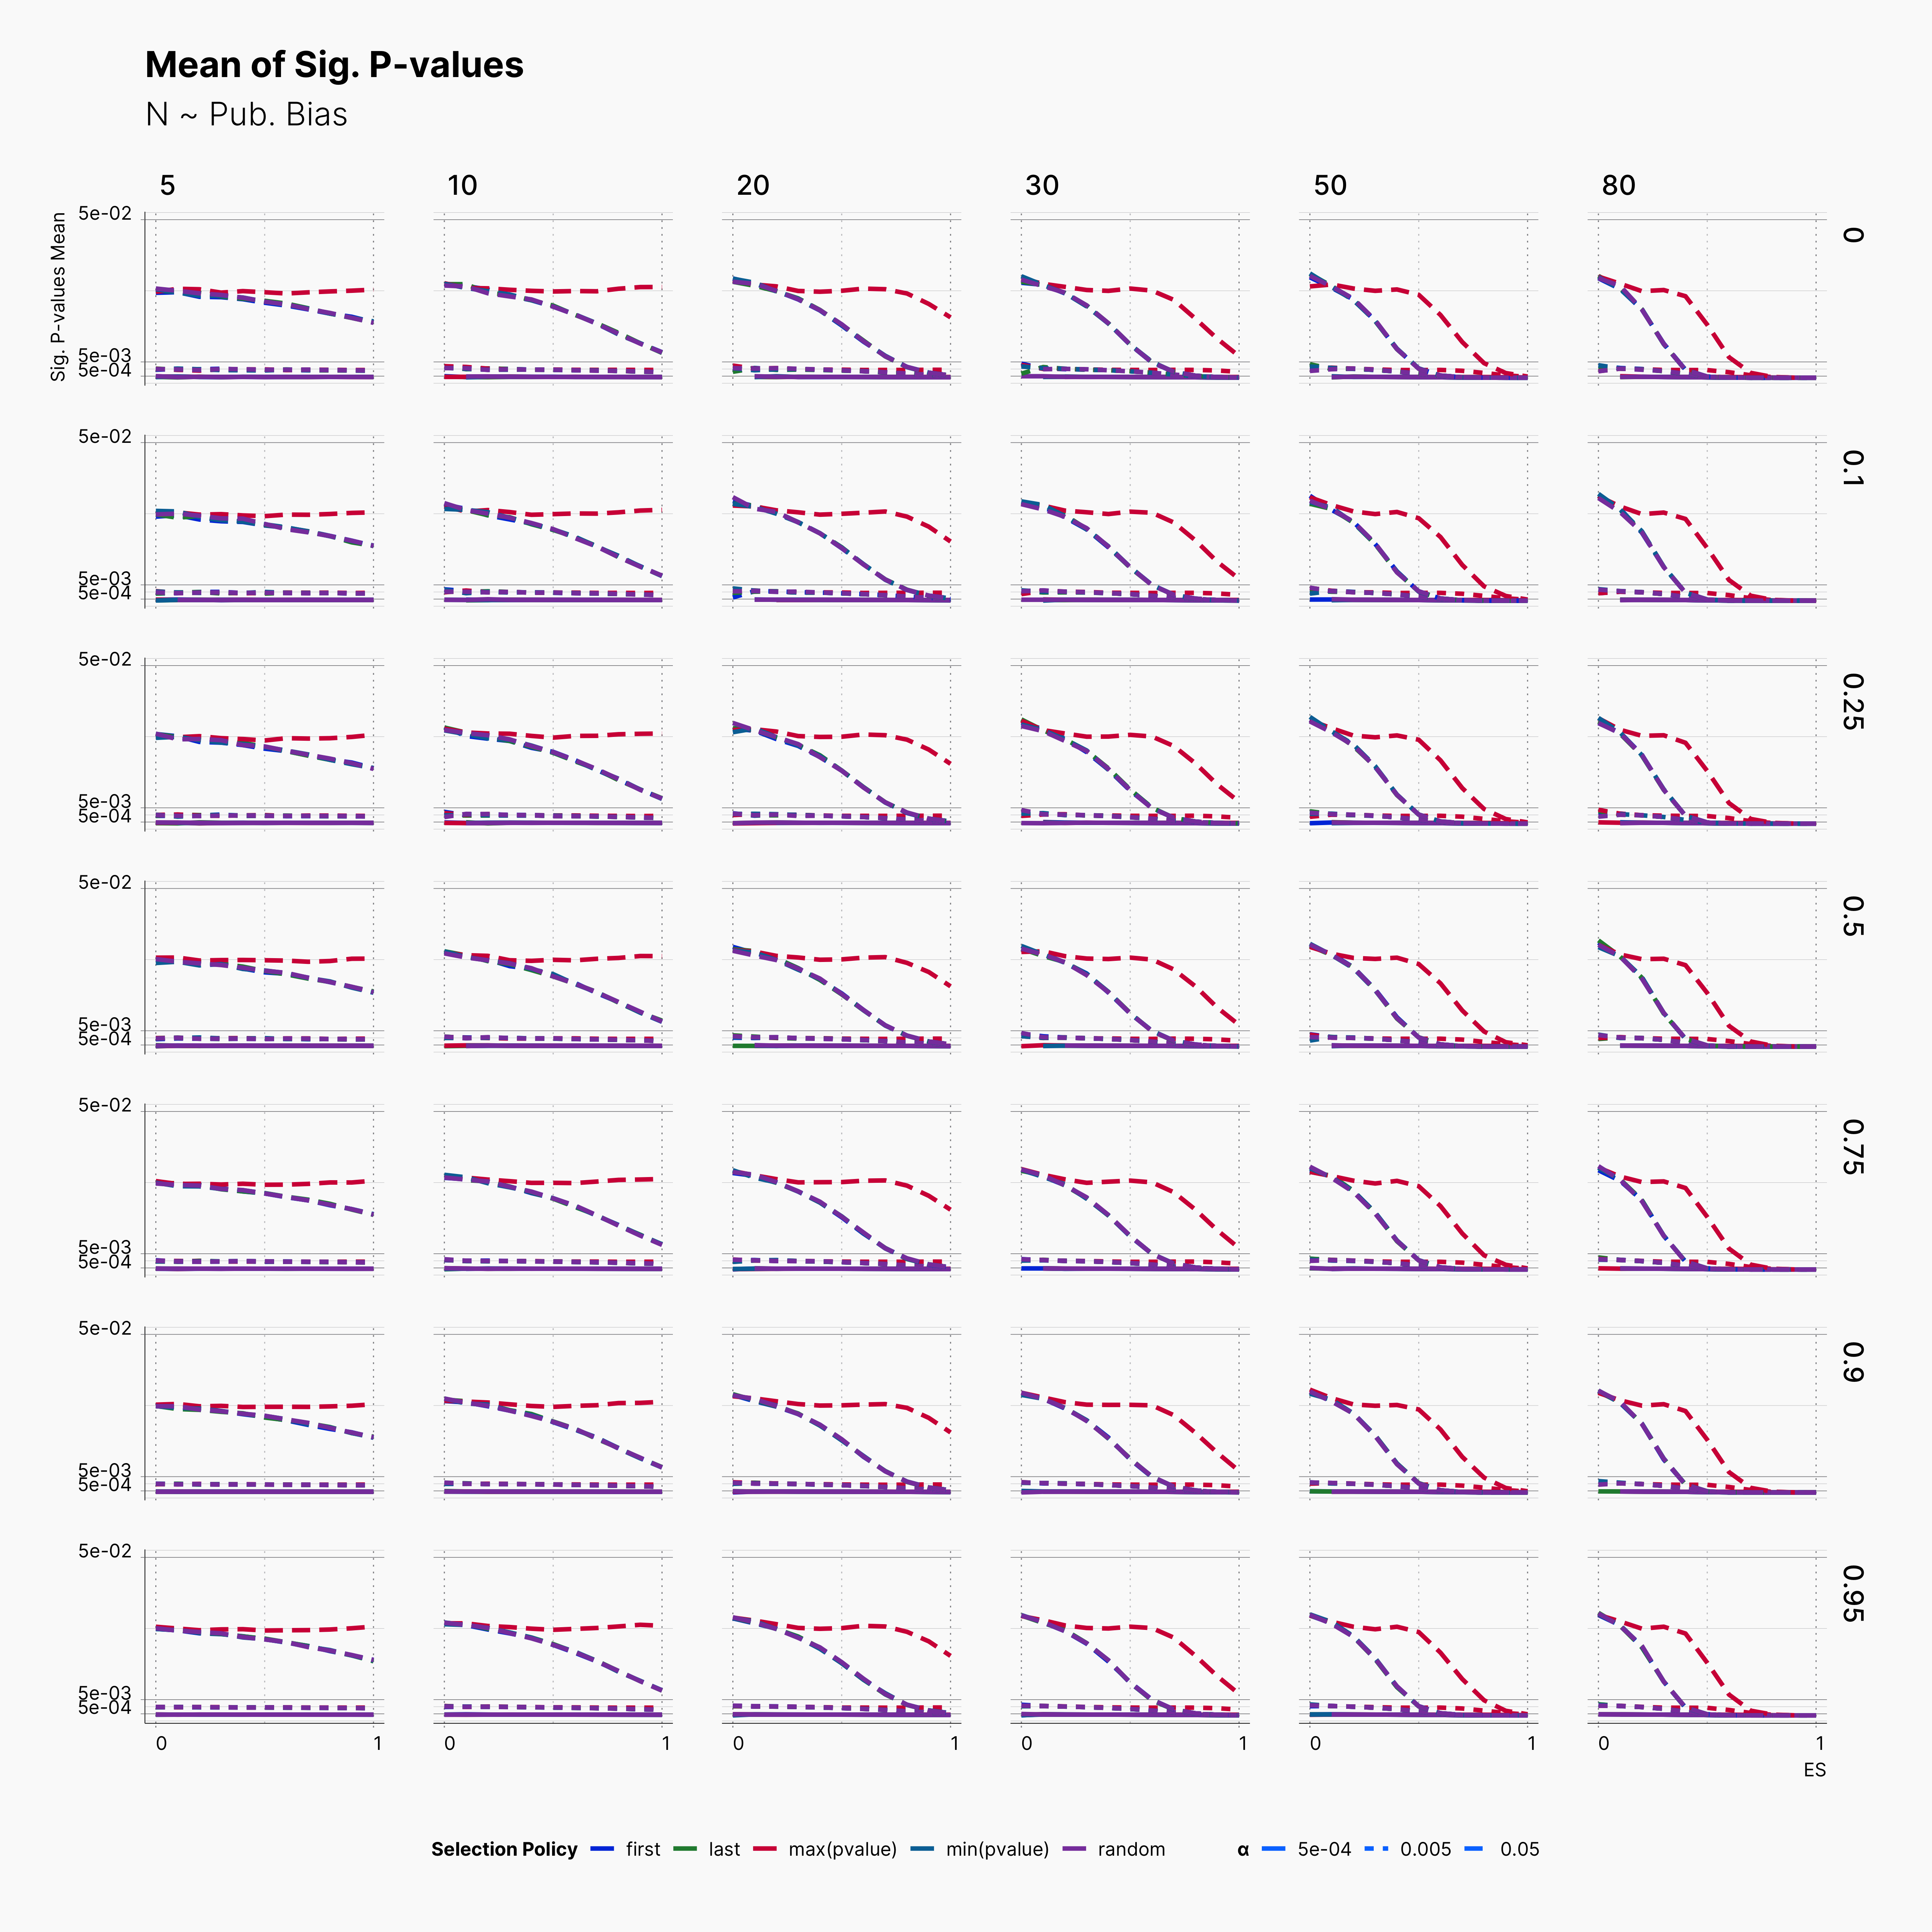
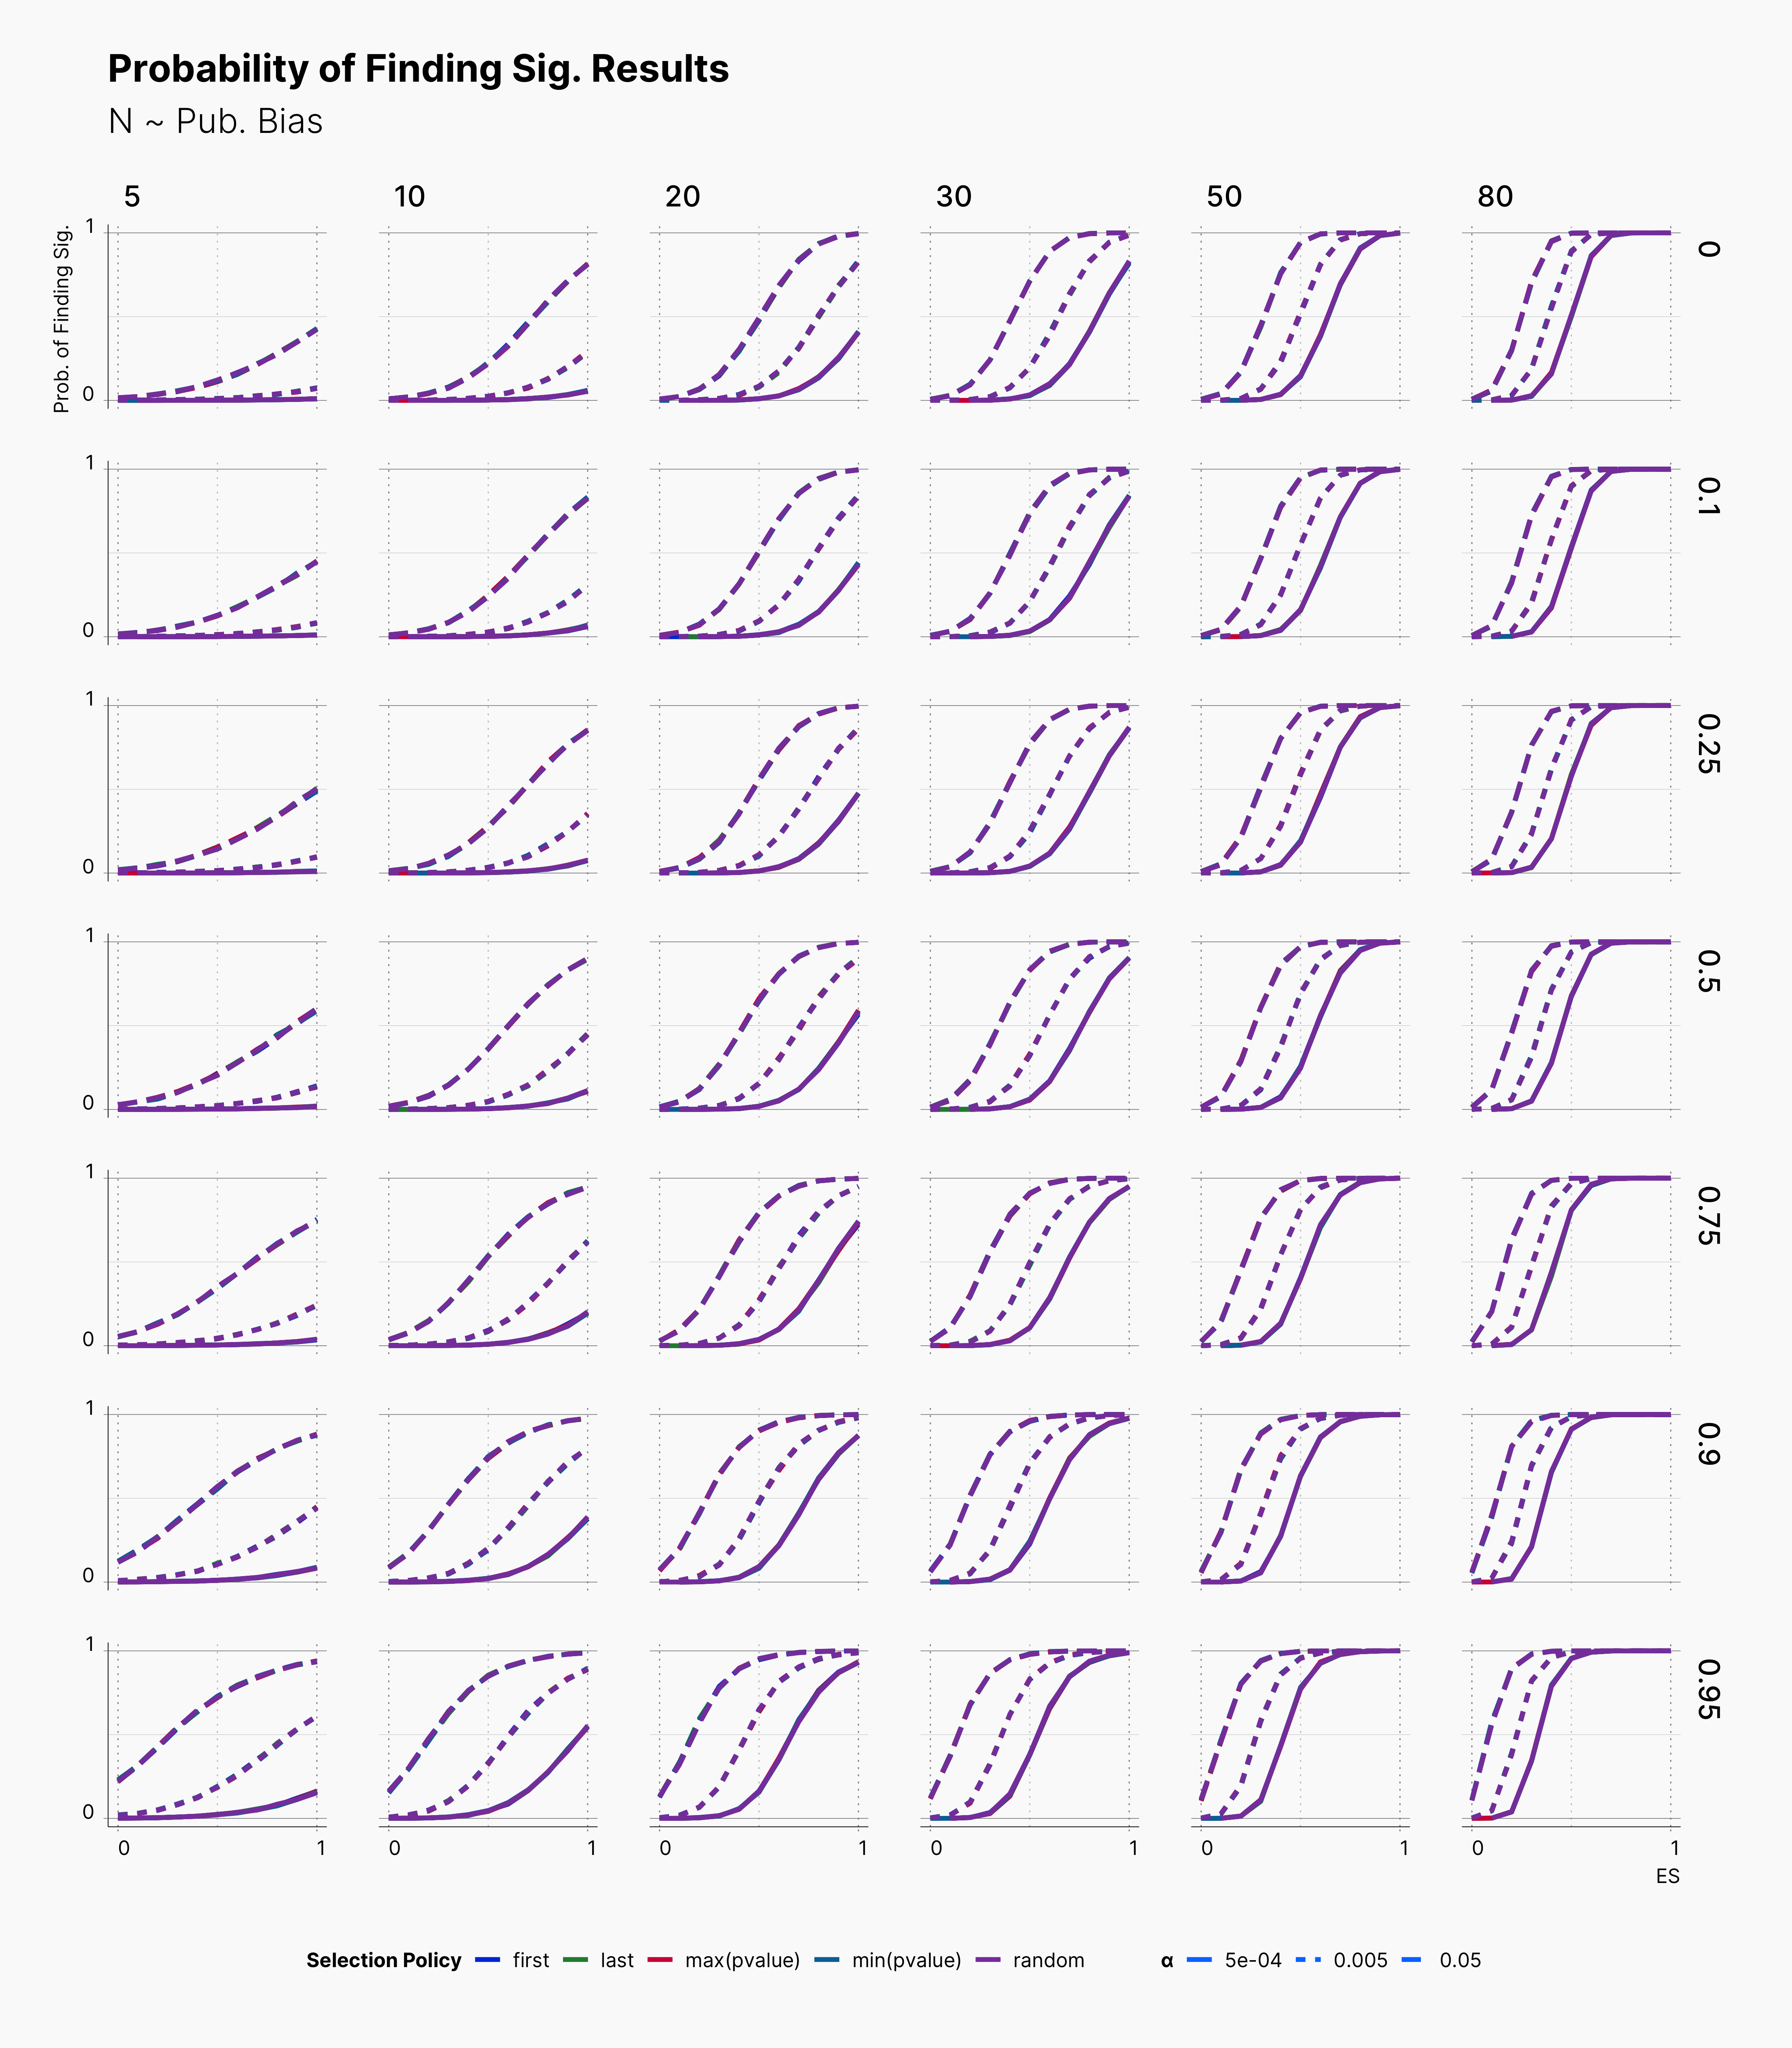
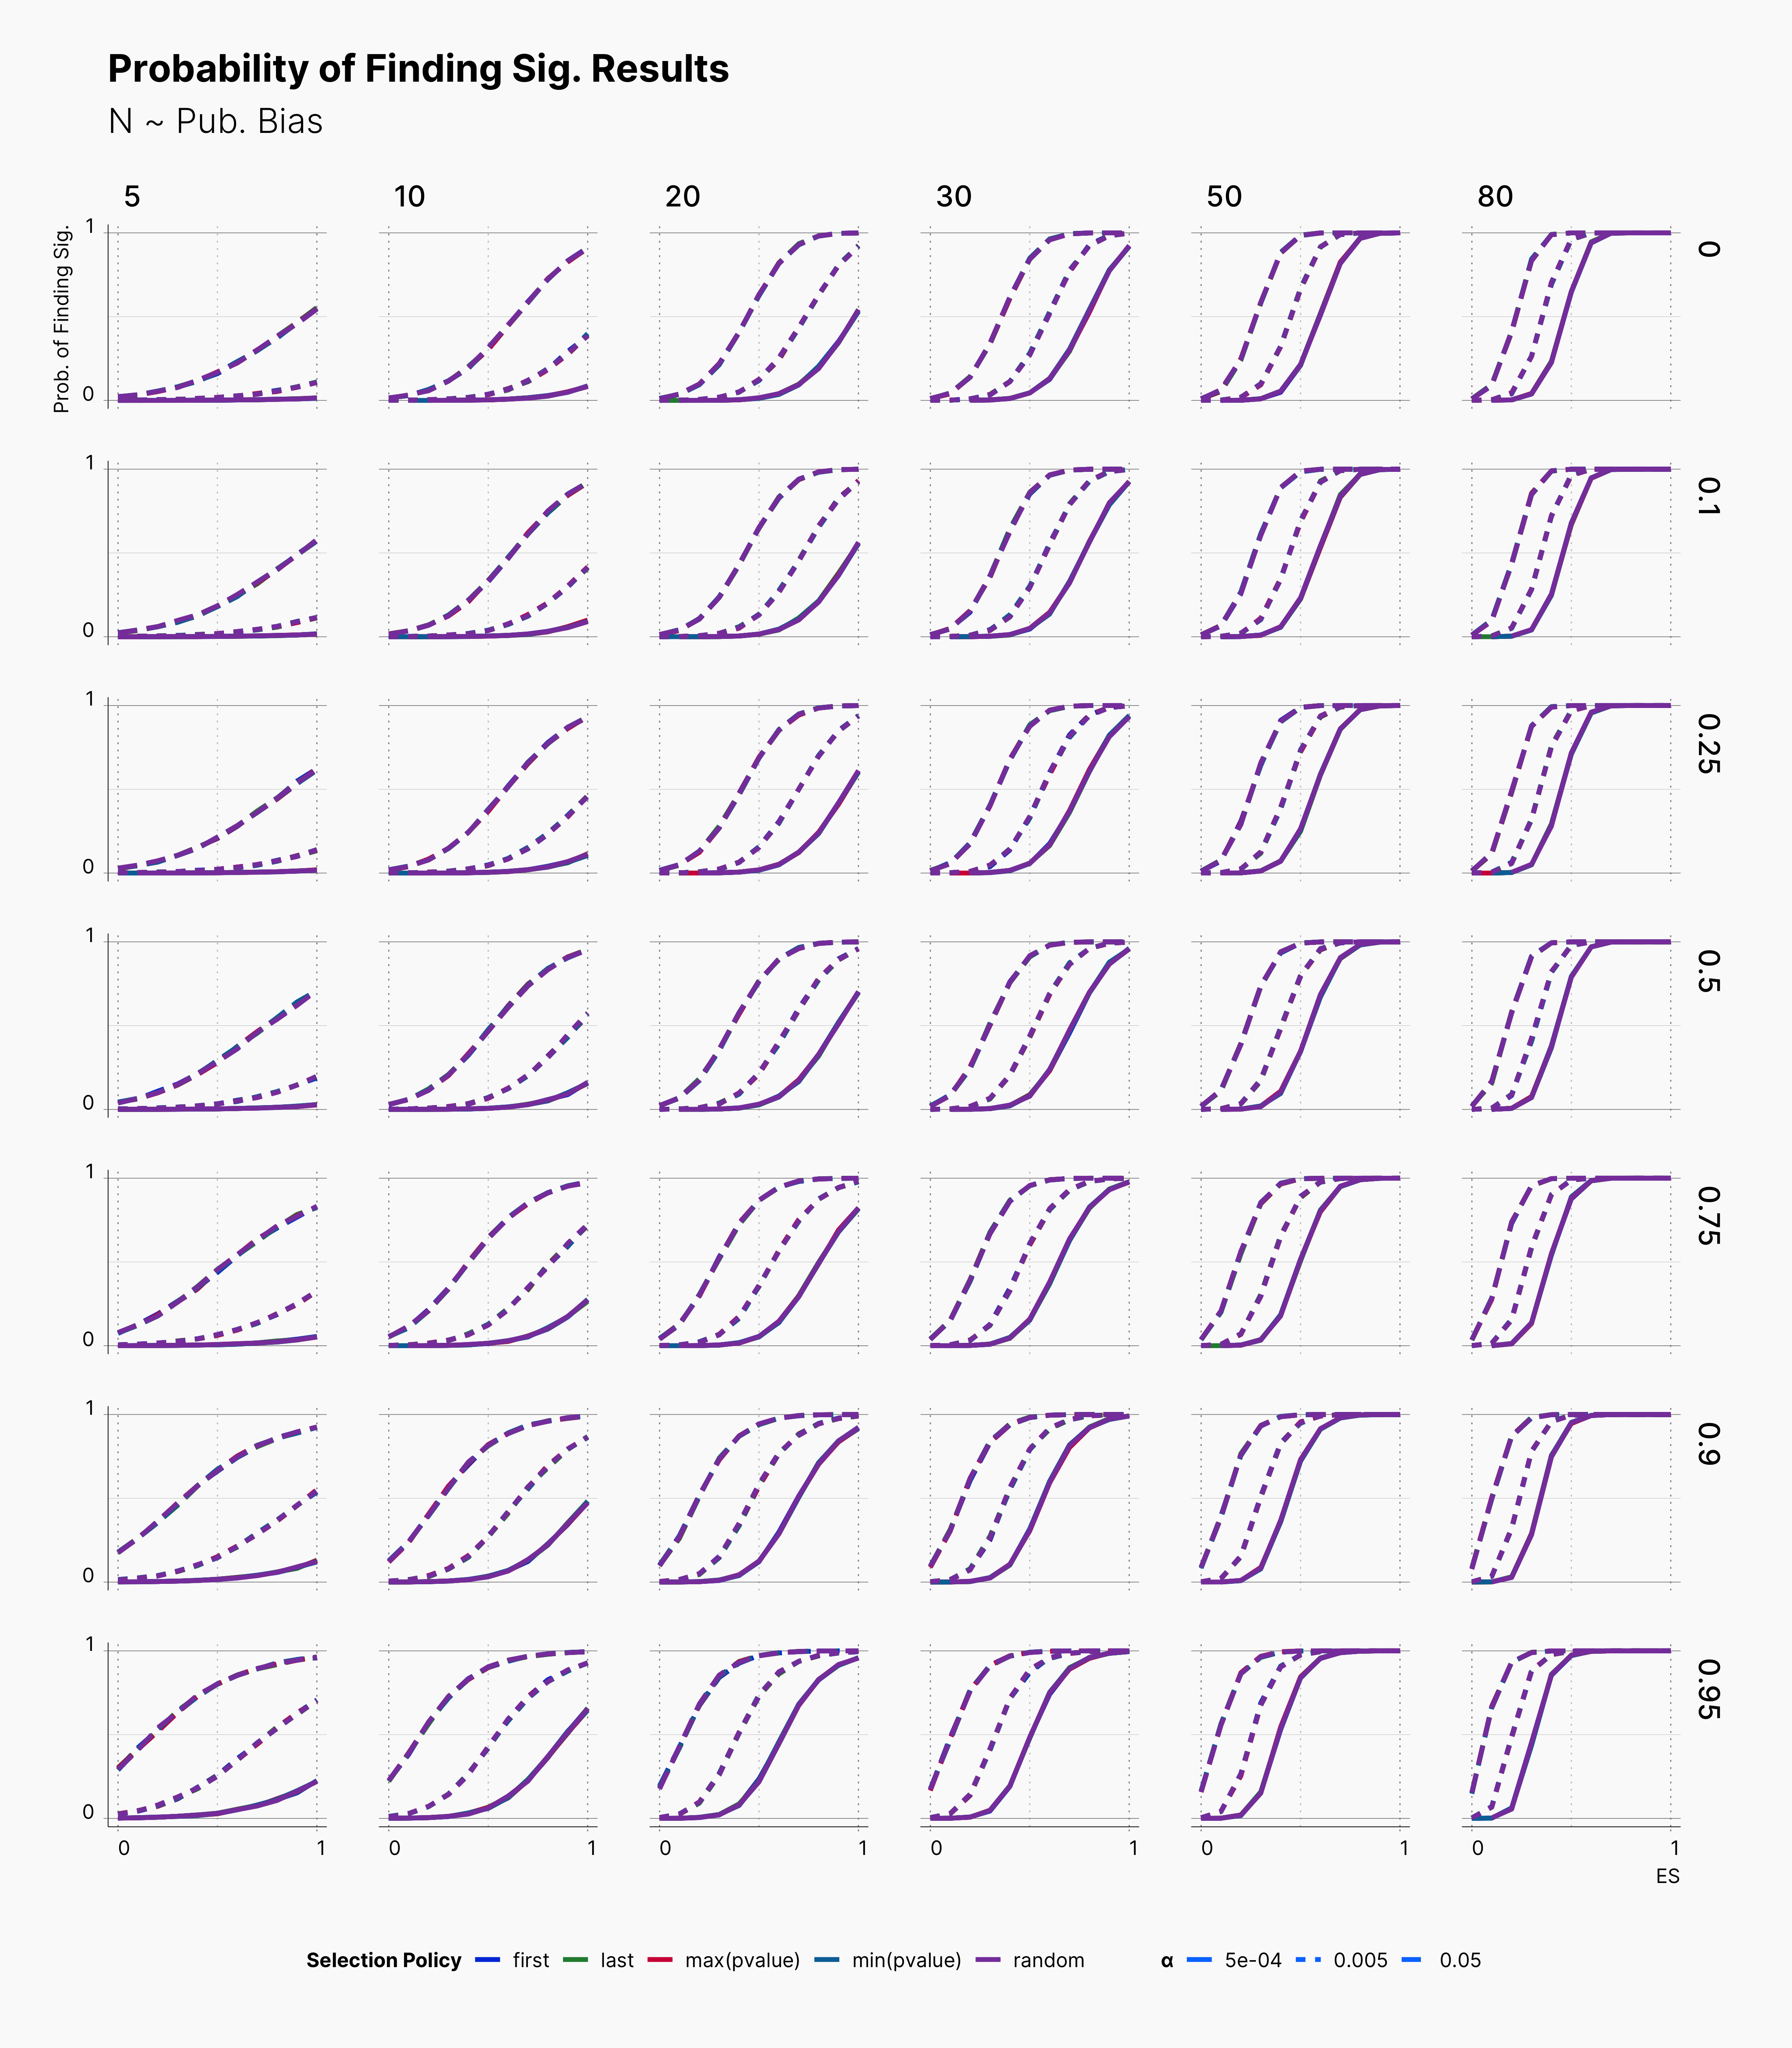
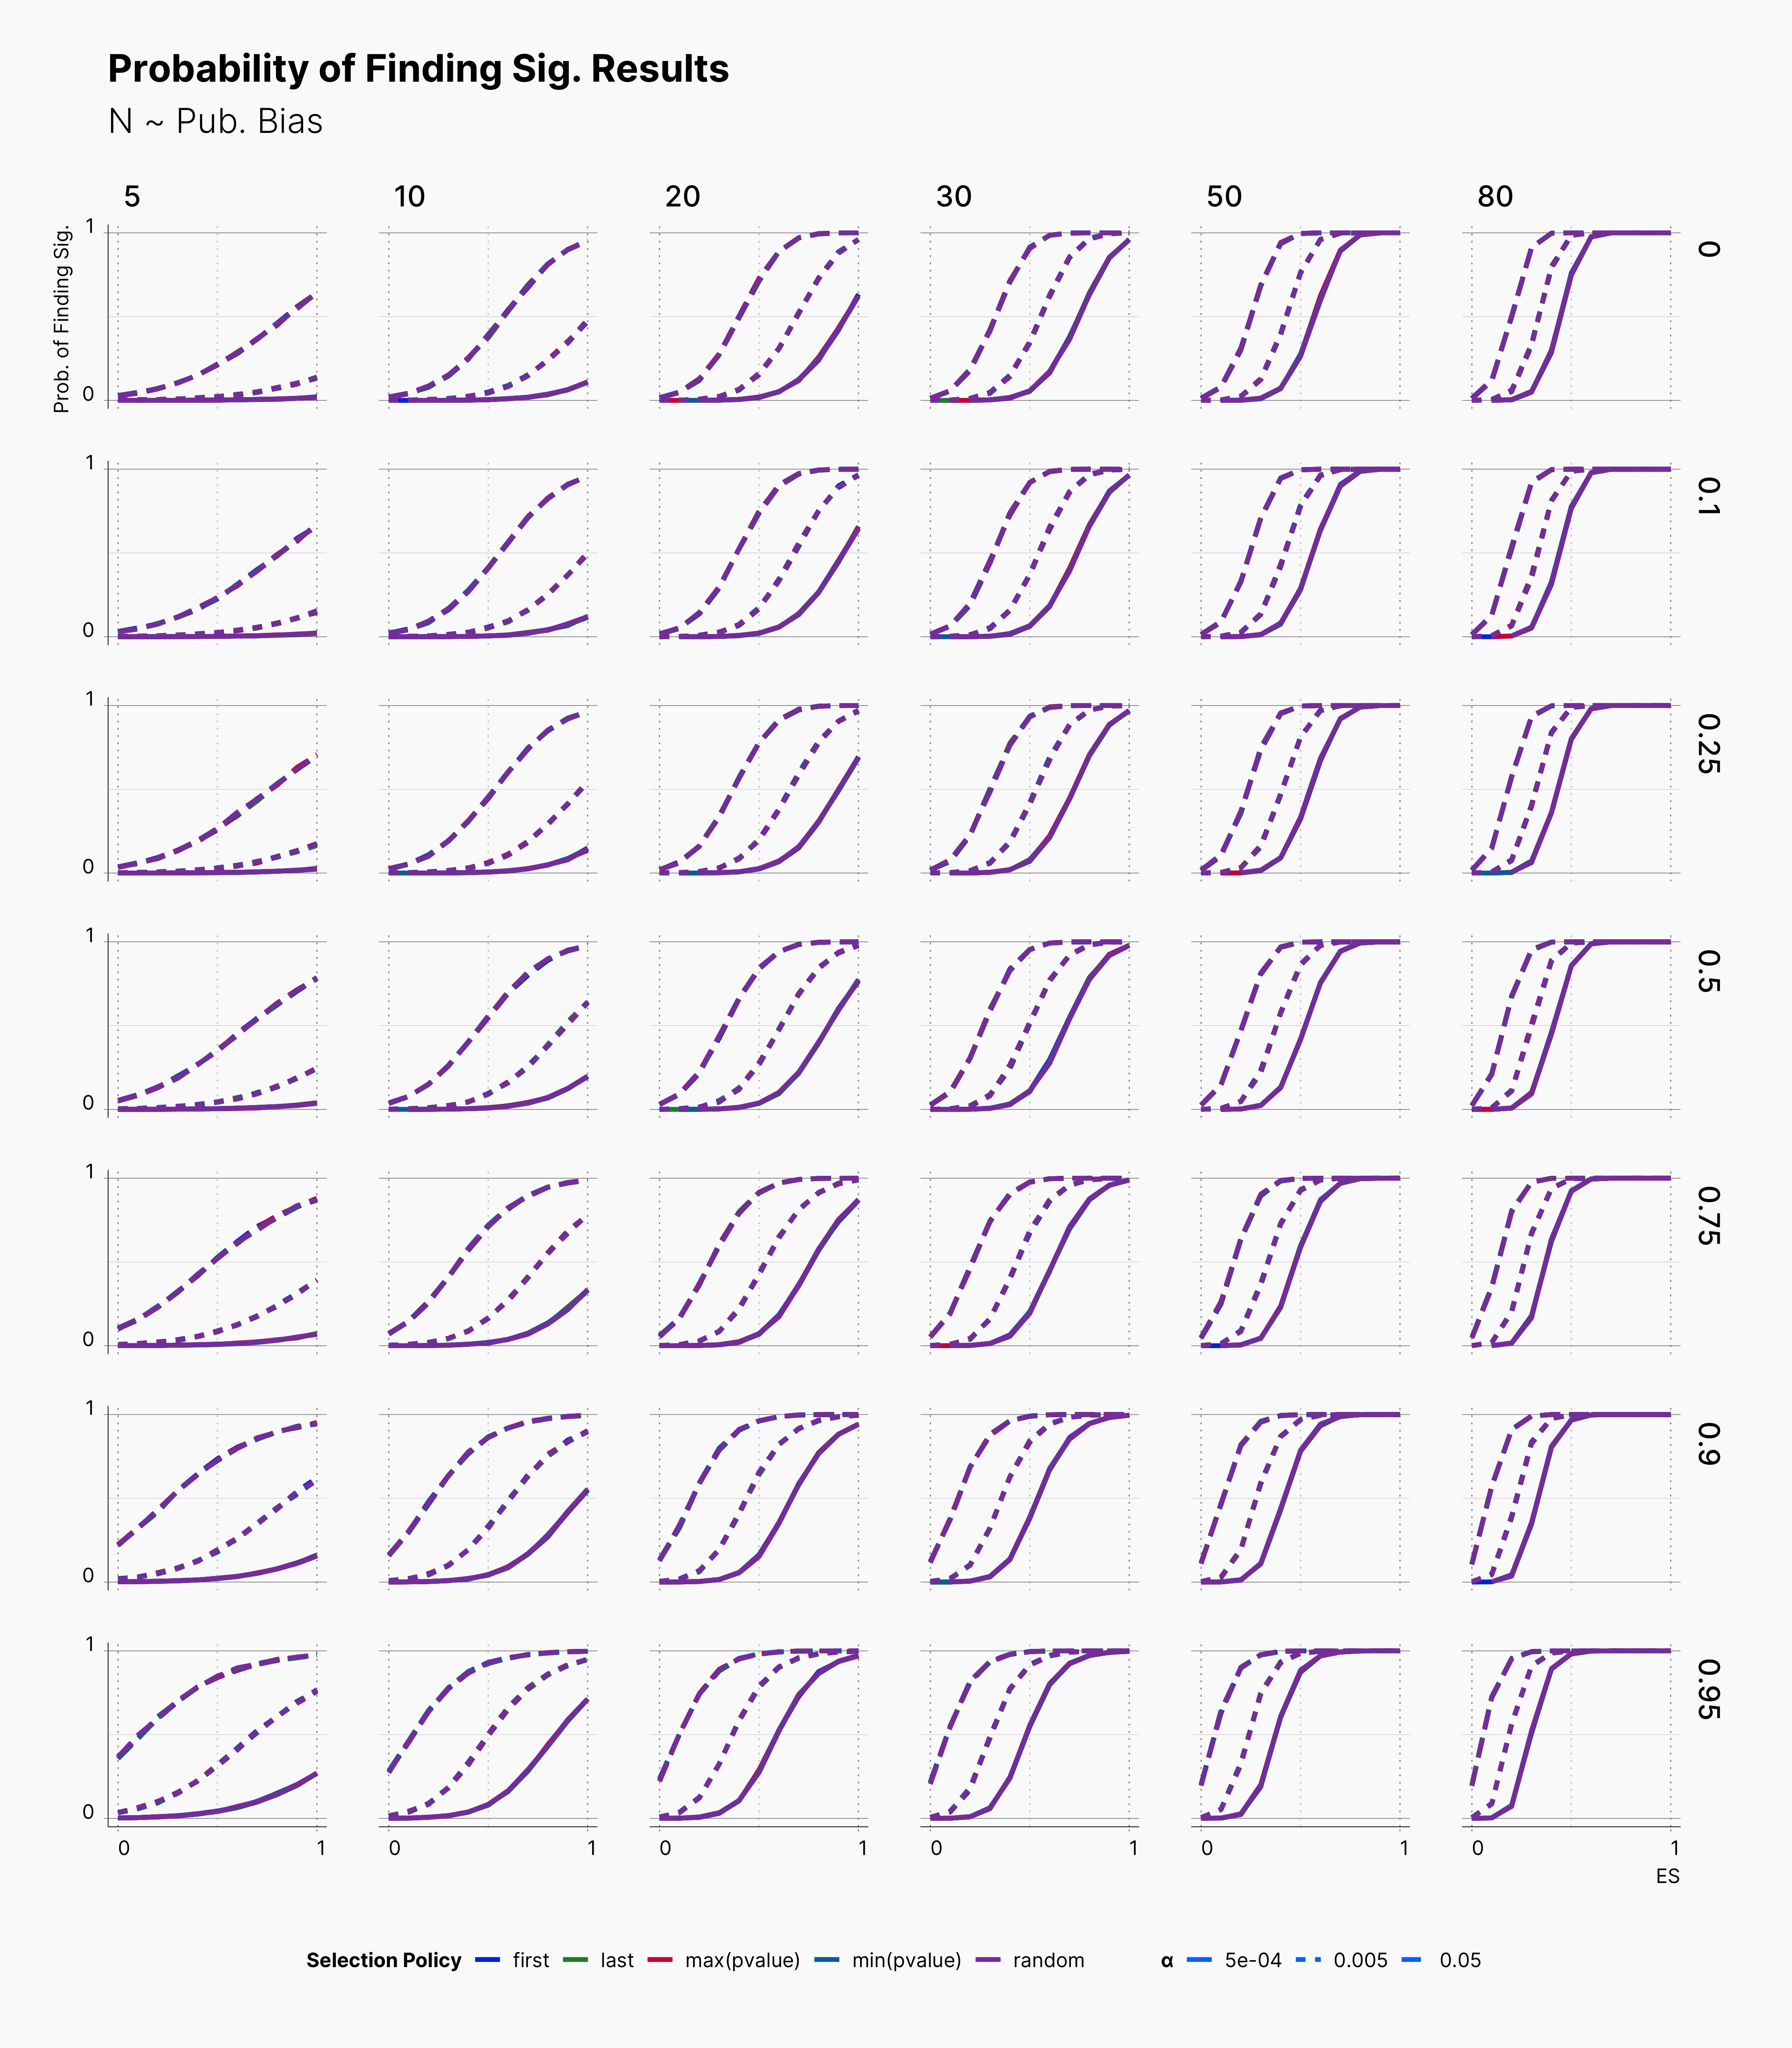
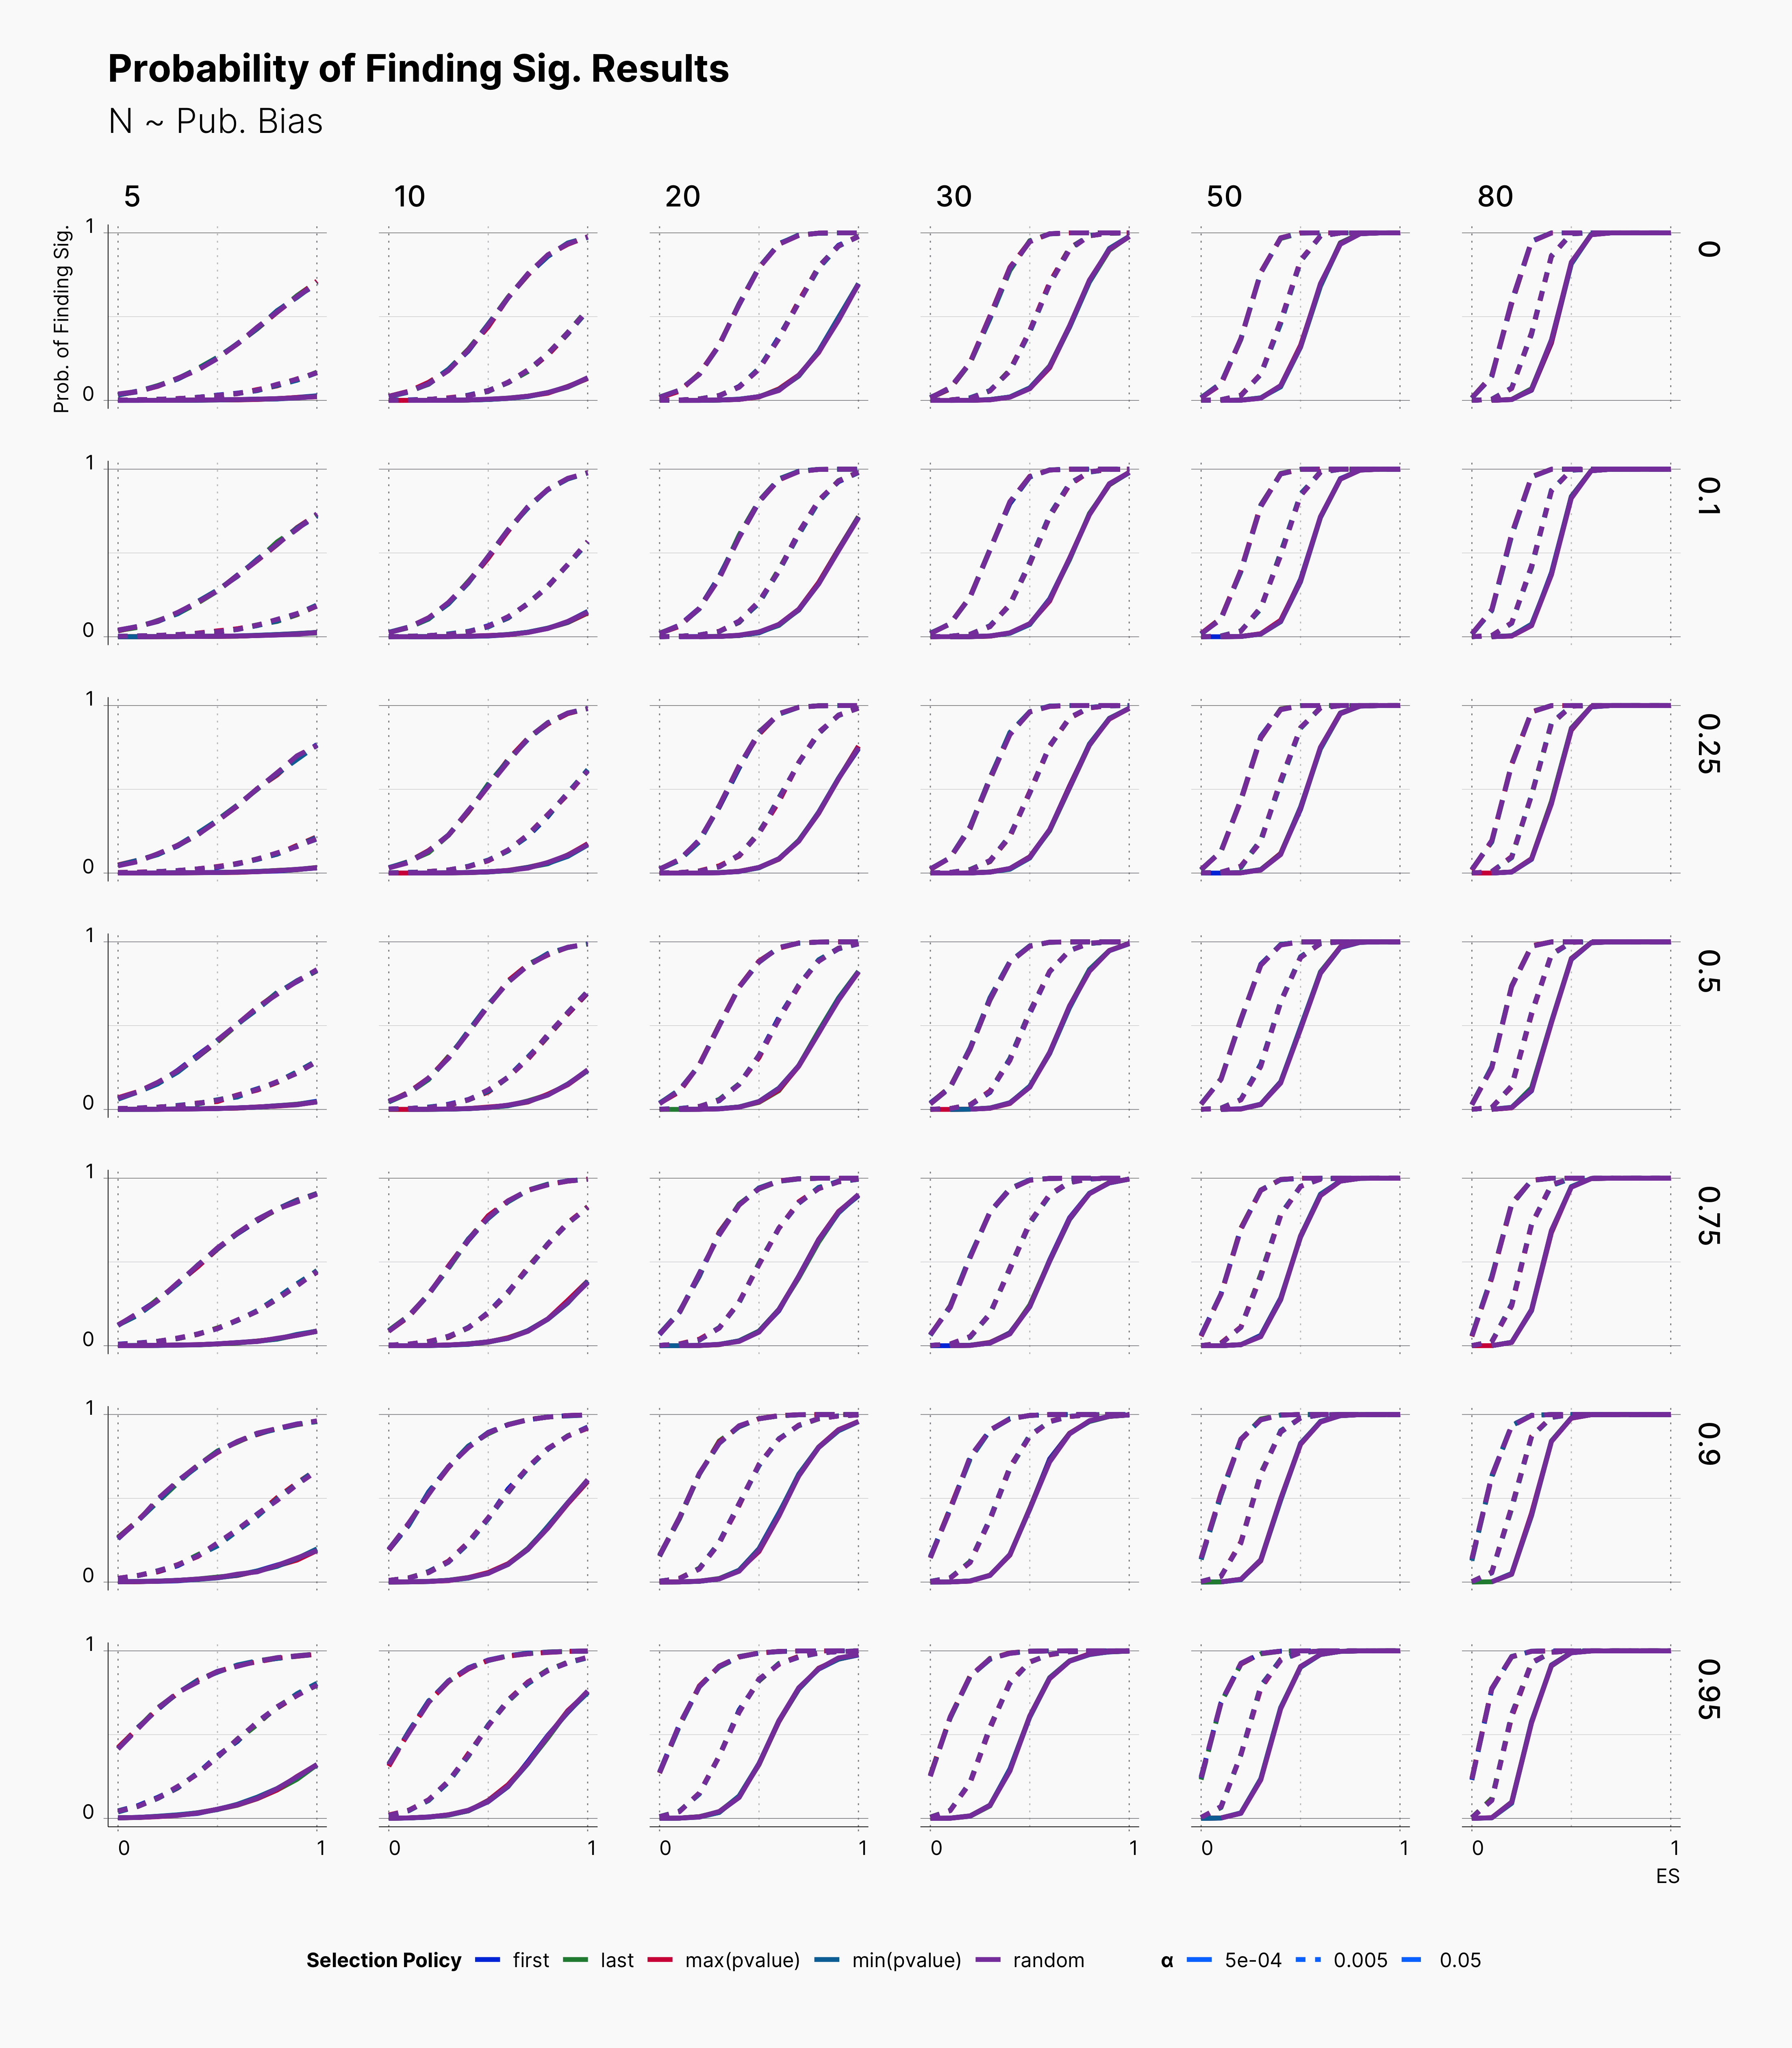
First, we look at the probability of finding significant results within the predefined hypercube of parameters enlisted above. Figure 1 is splited into 4 different parts, each showing results for a simulation study with different number of dependent variables.
Overall, we see that most lines are overlapping each other. This indicates that our selections for selective reporting variation does not necessarily translate to a meaningful difference in the probability of finding significant results. However, the effect of different ɑ-level is visible and meaningful. Basically, lowering ɑ-level lowers the chance of finding significant results, as expected.
Moveover, we can observe the effect of publication bias on our results. As one would expect, higher publication bias will lead to higher concentration of significant results in the Journal. In SAM, higher publication bias encourages the Journal to accept less non-significant results, therefore, more non-significant results will be discarded, see Journal.
Level of ES Bias
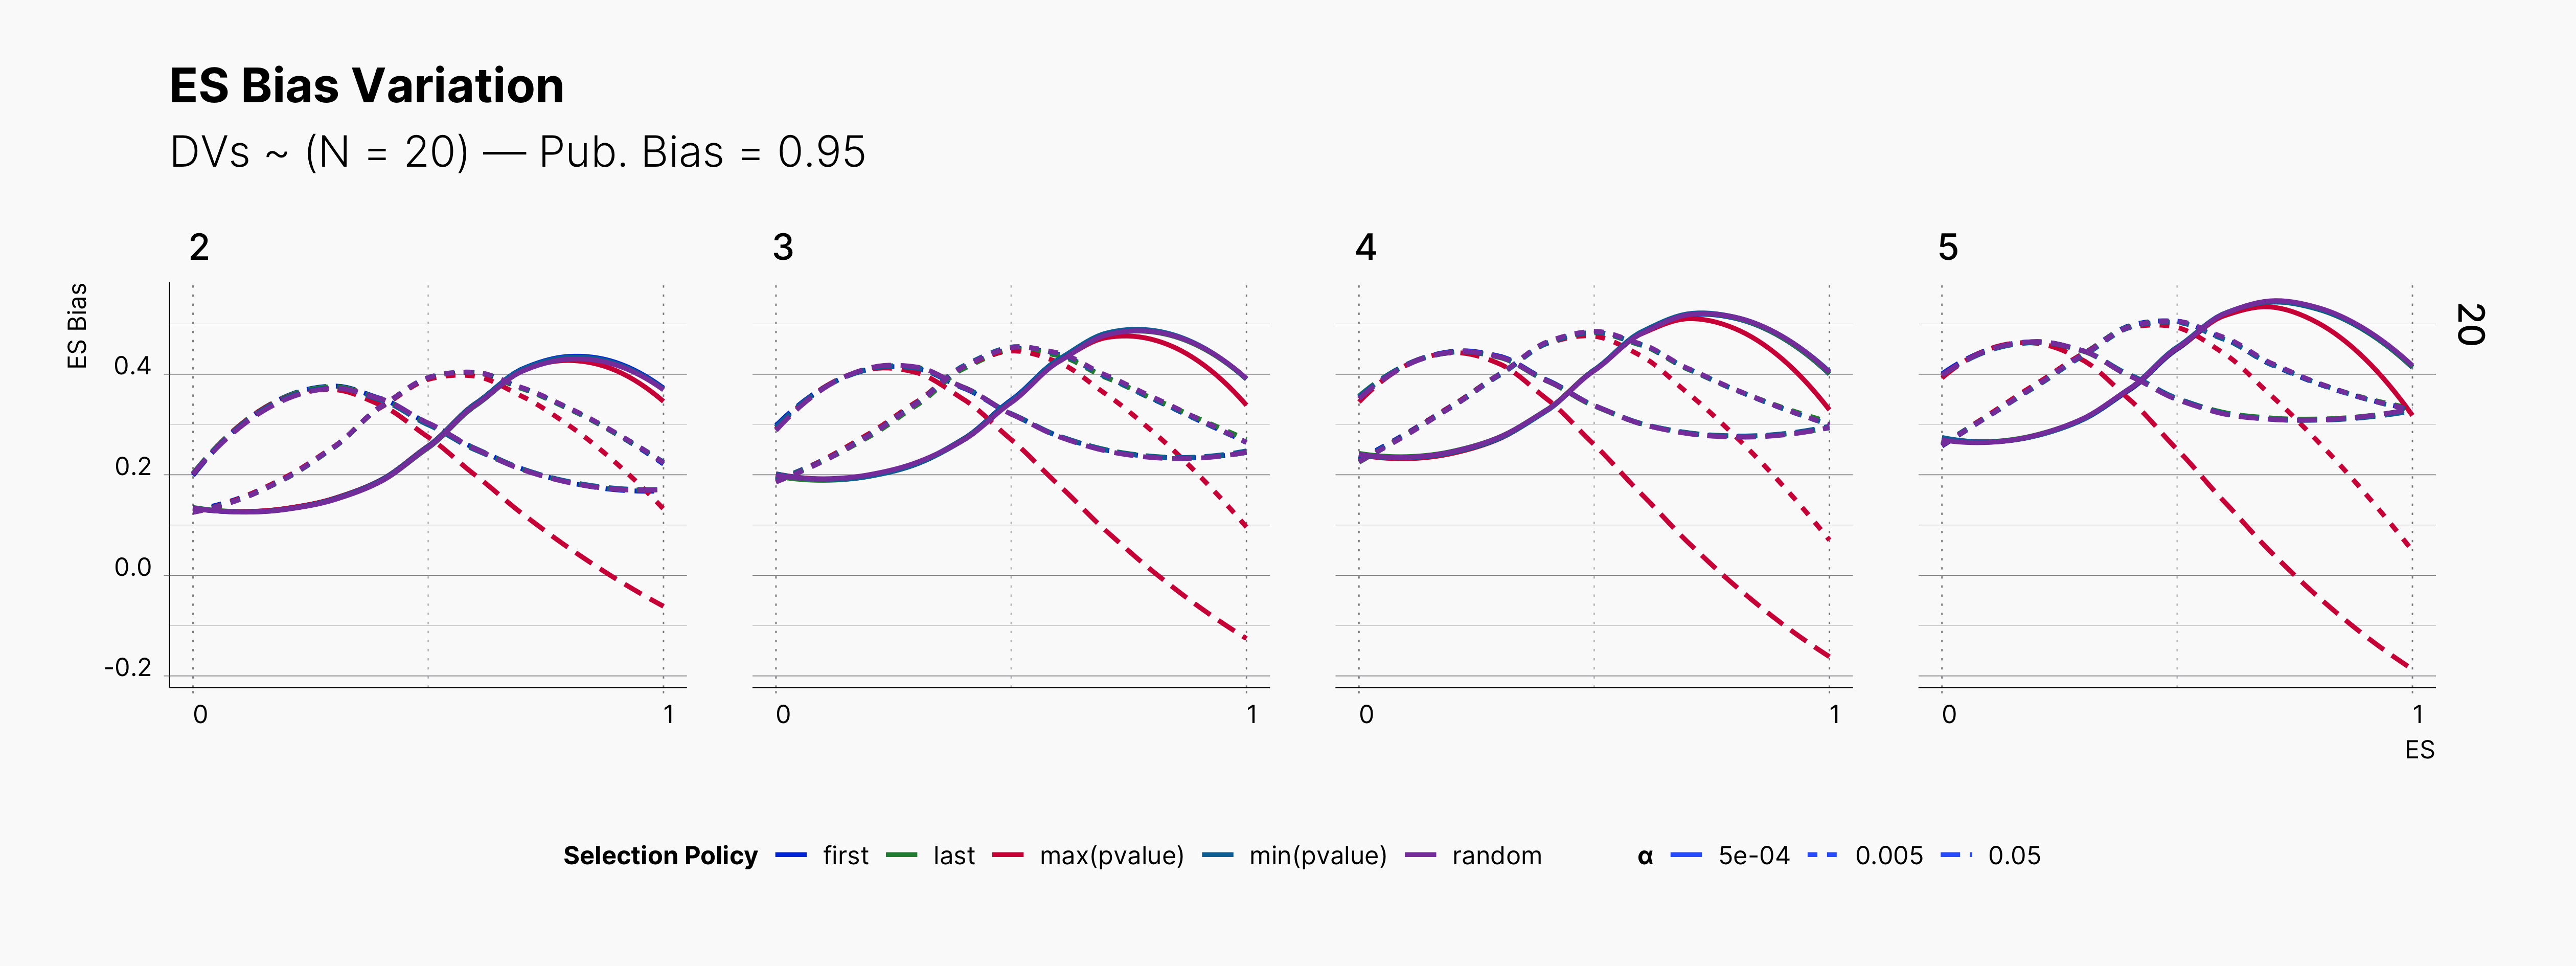
Looking at the level of bias among our result, we again see alomst no difference between our different selection logics, except the case of researcher's who has priotrized ["sig", "effect > 0", "max(pvalue)"] which expectedly has a slightly lower bias level.
Looking more closely, we can observe an steady decline of ES Bias as we increase N. This decline in bias is more apparent as we increase m, number of dependent variables. Moreover, the wild volatility of bias in lower sample sizes and higher publication biases is very noticable.
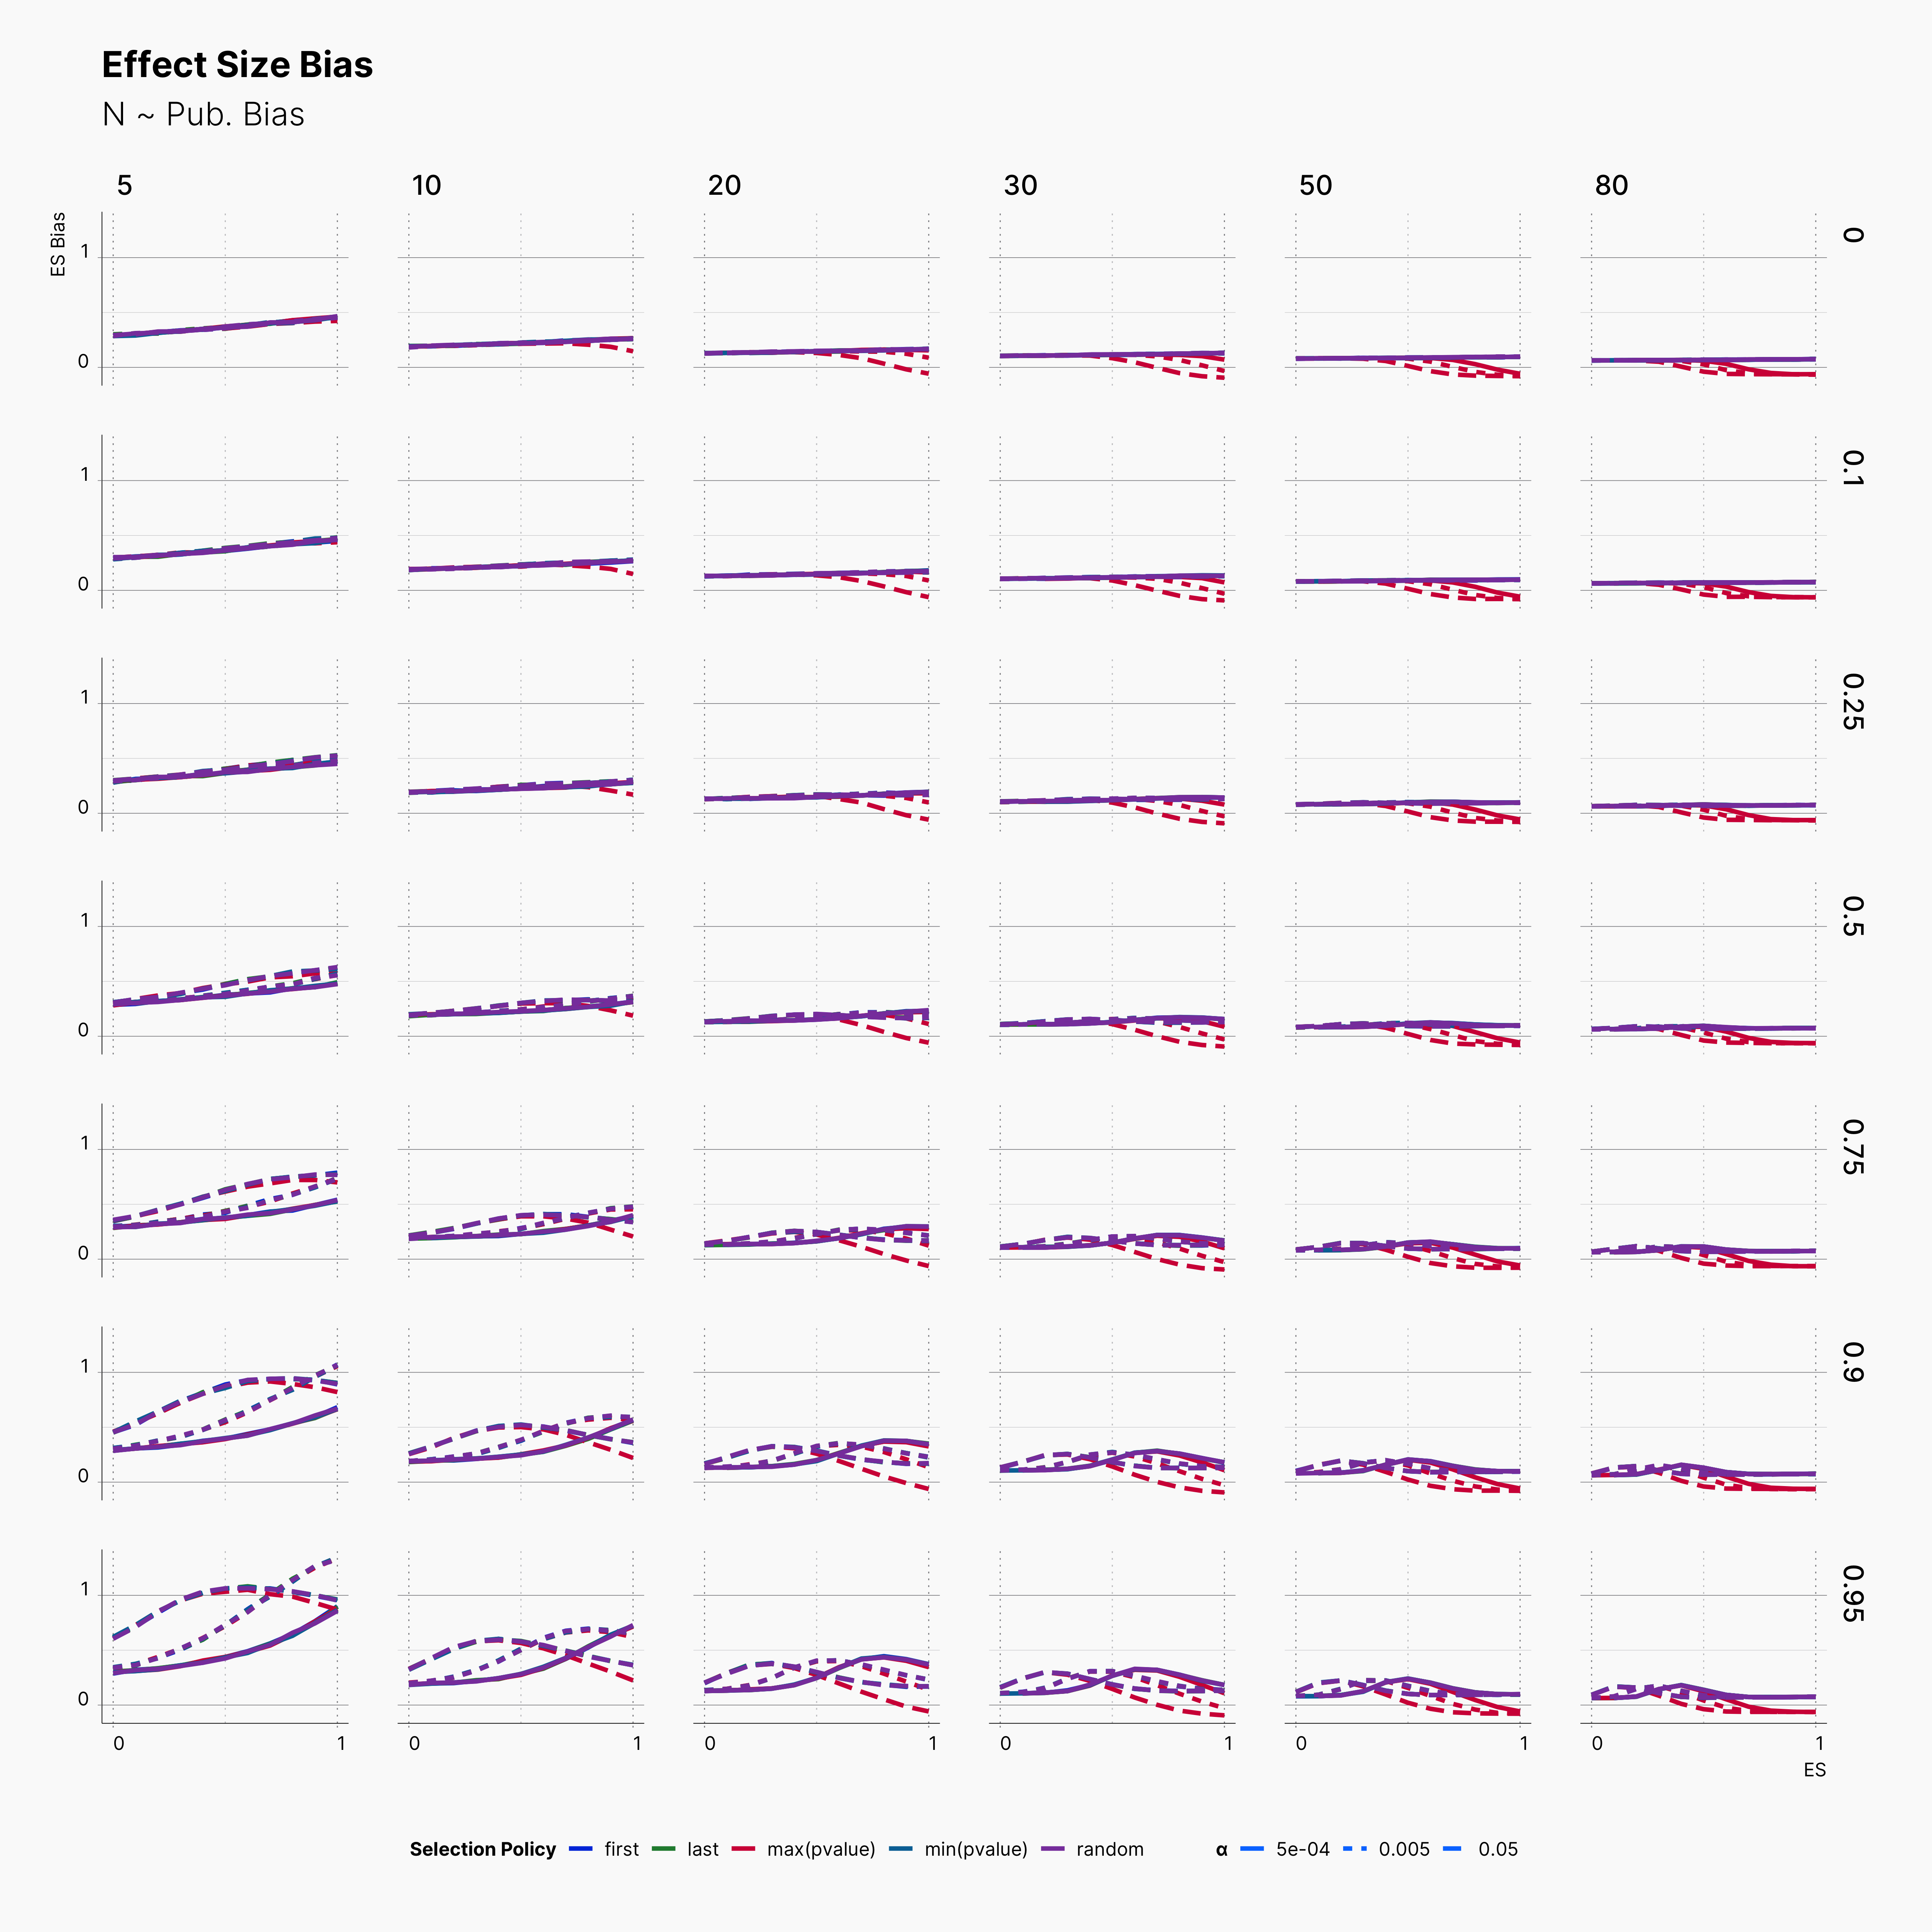
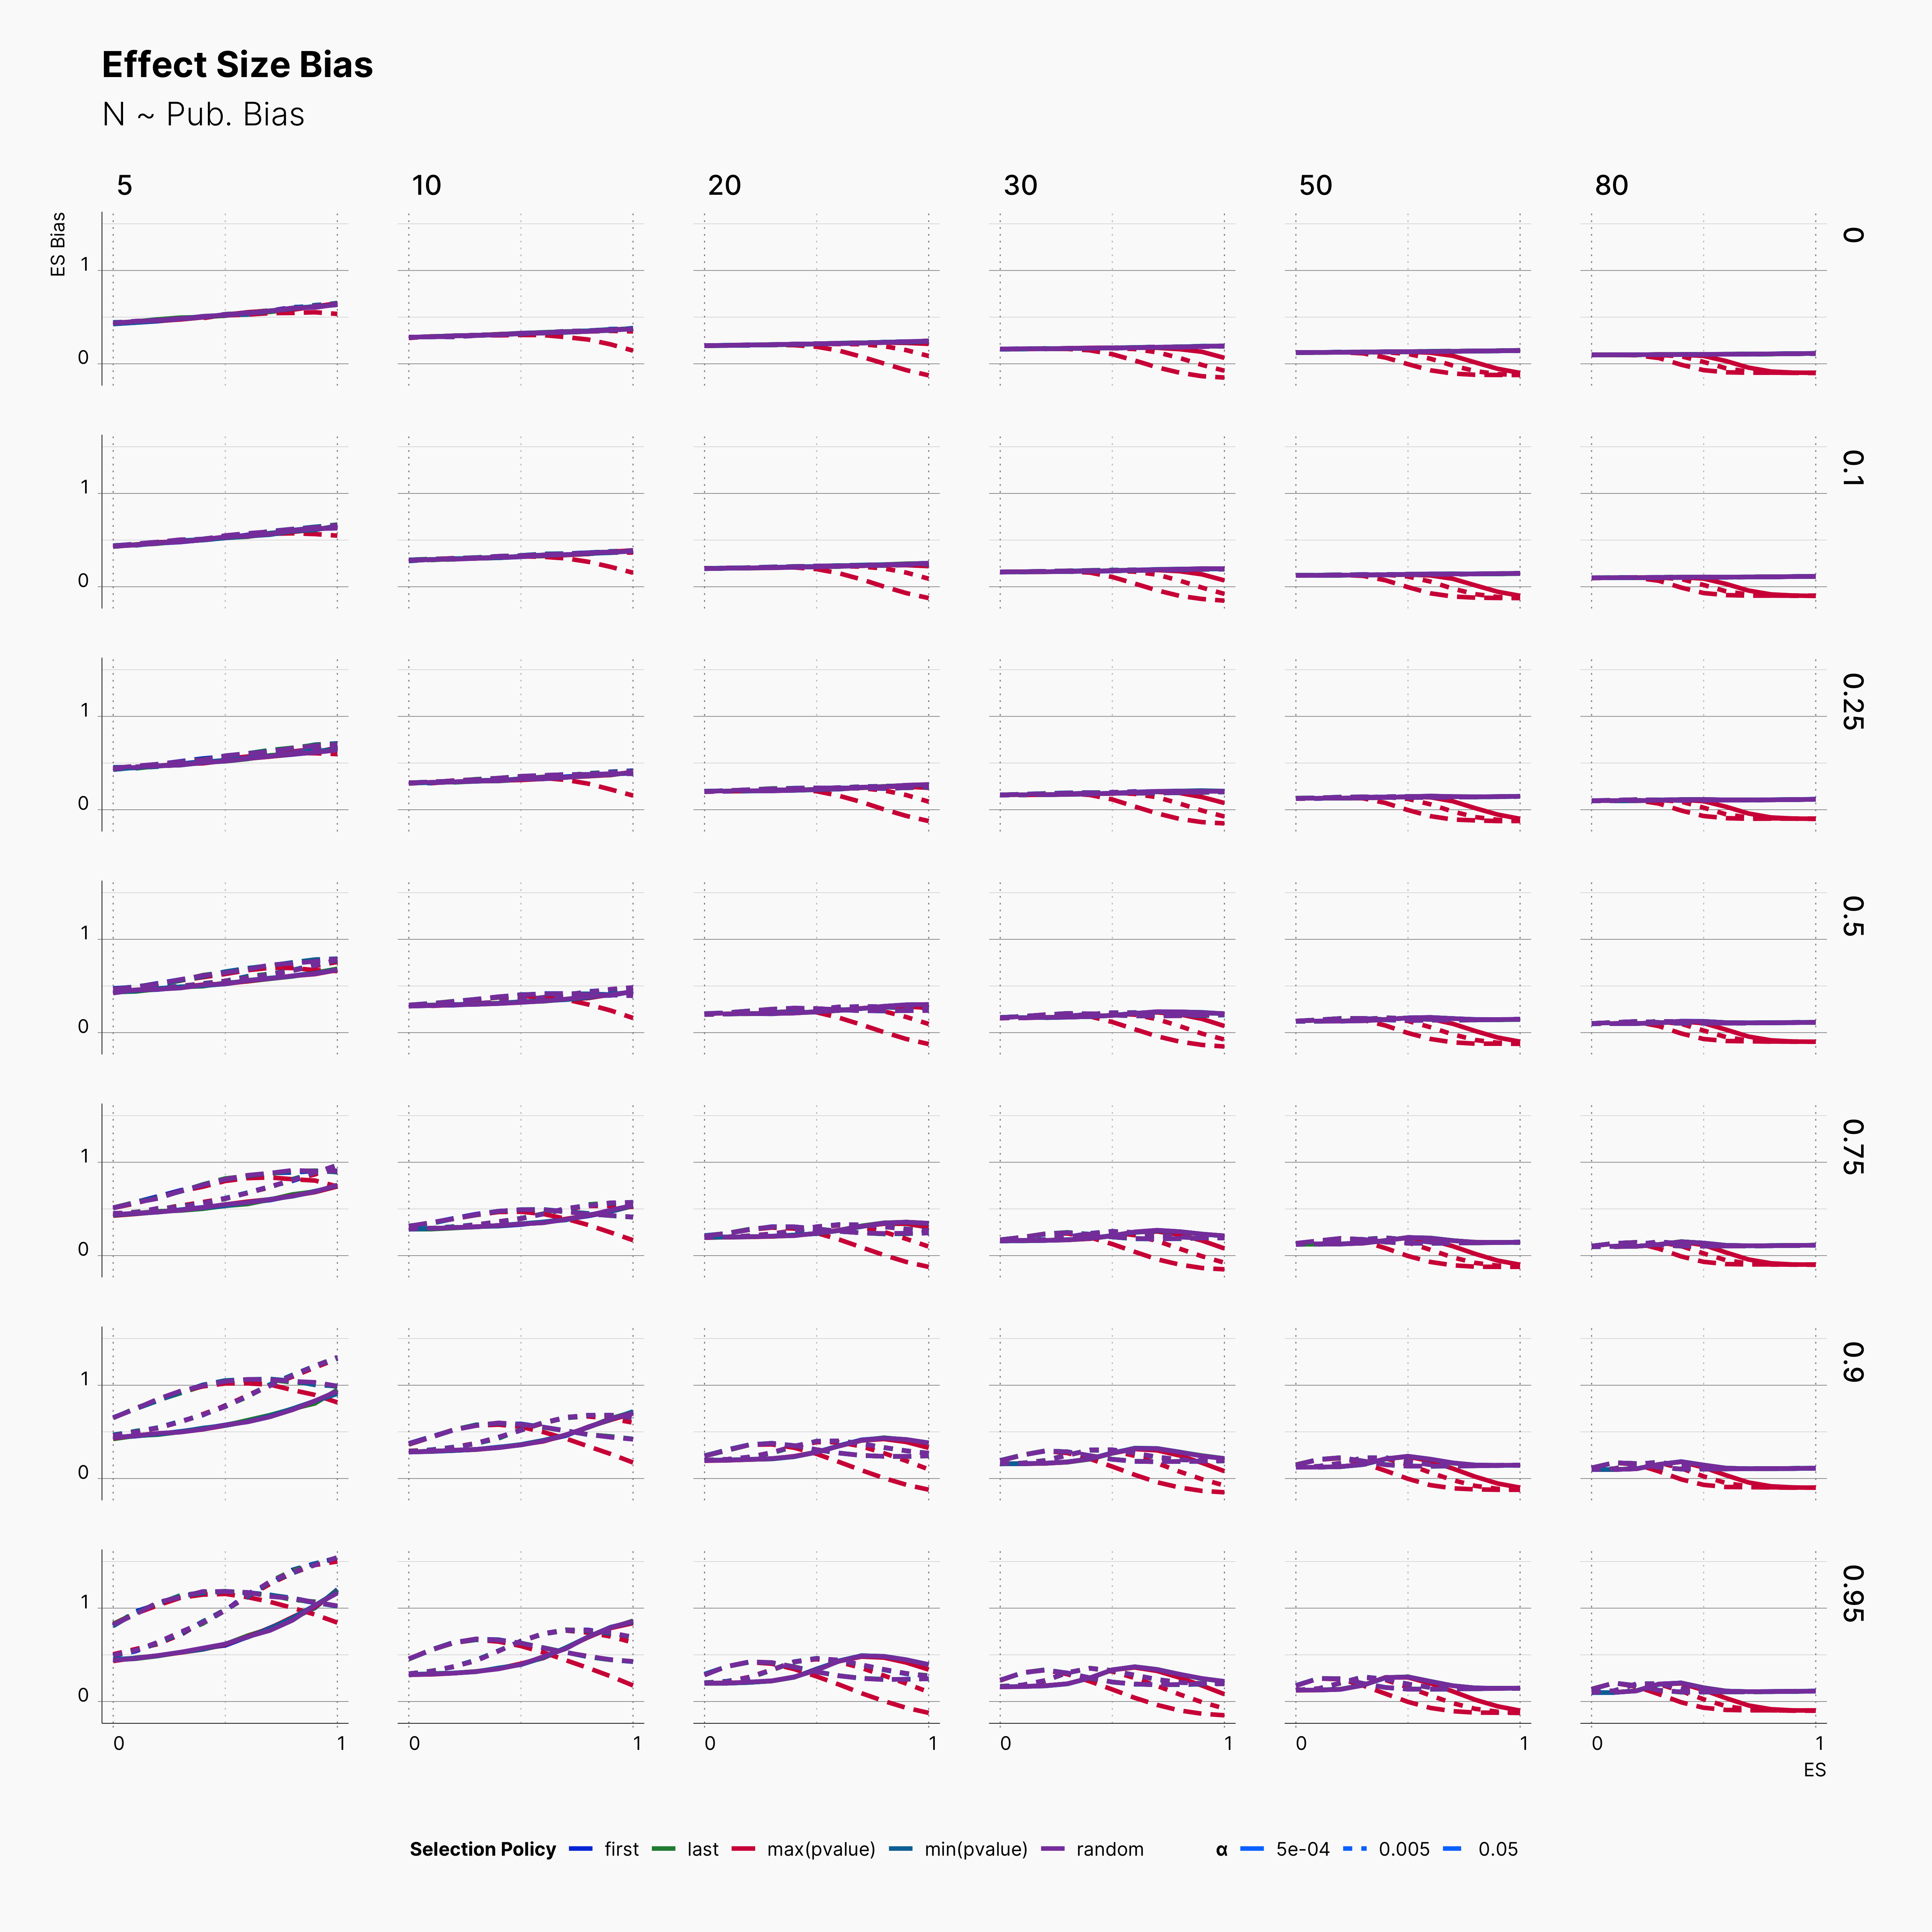
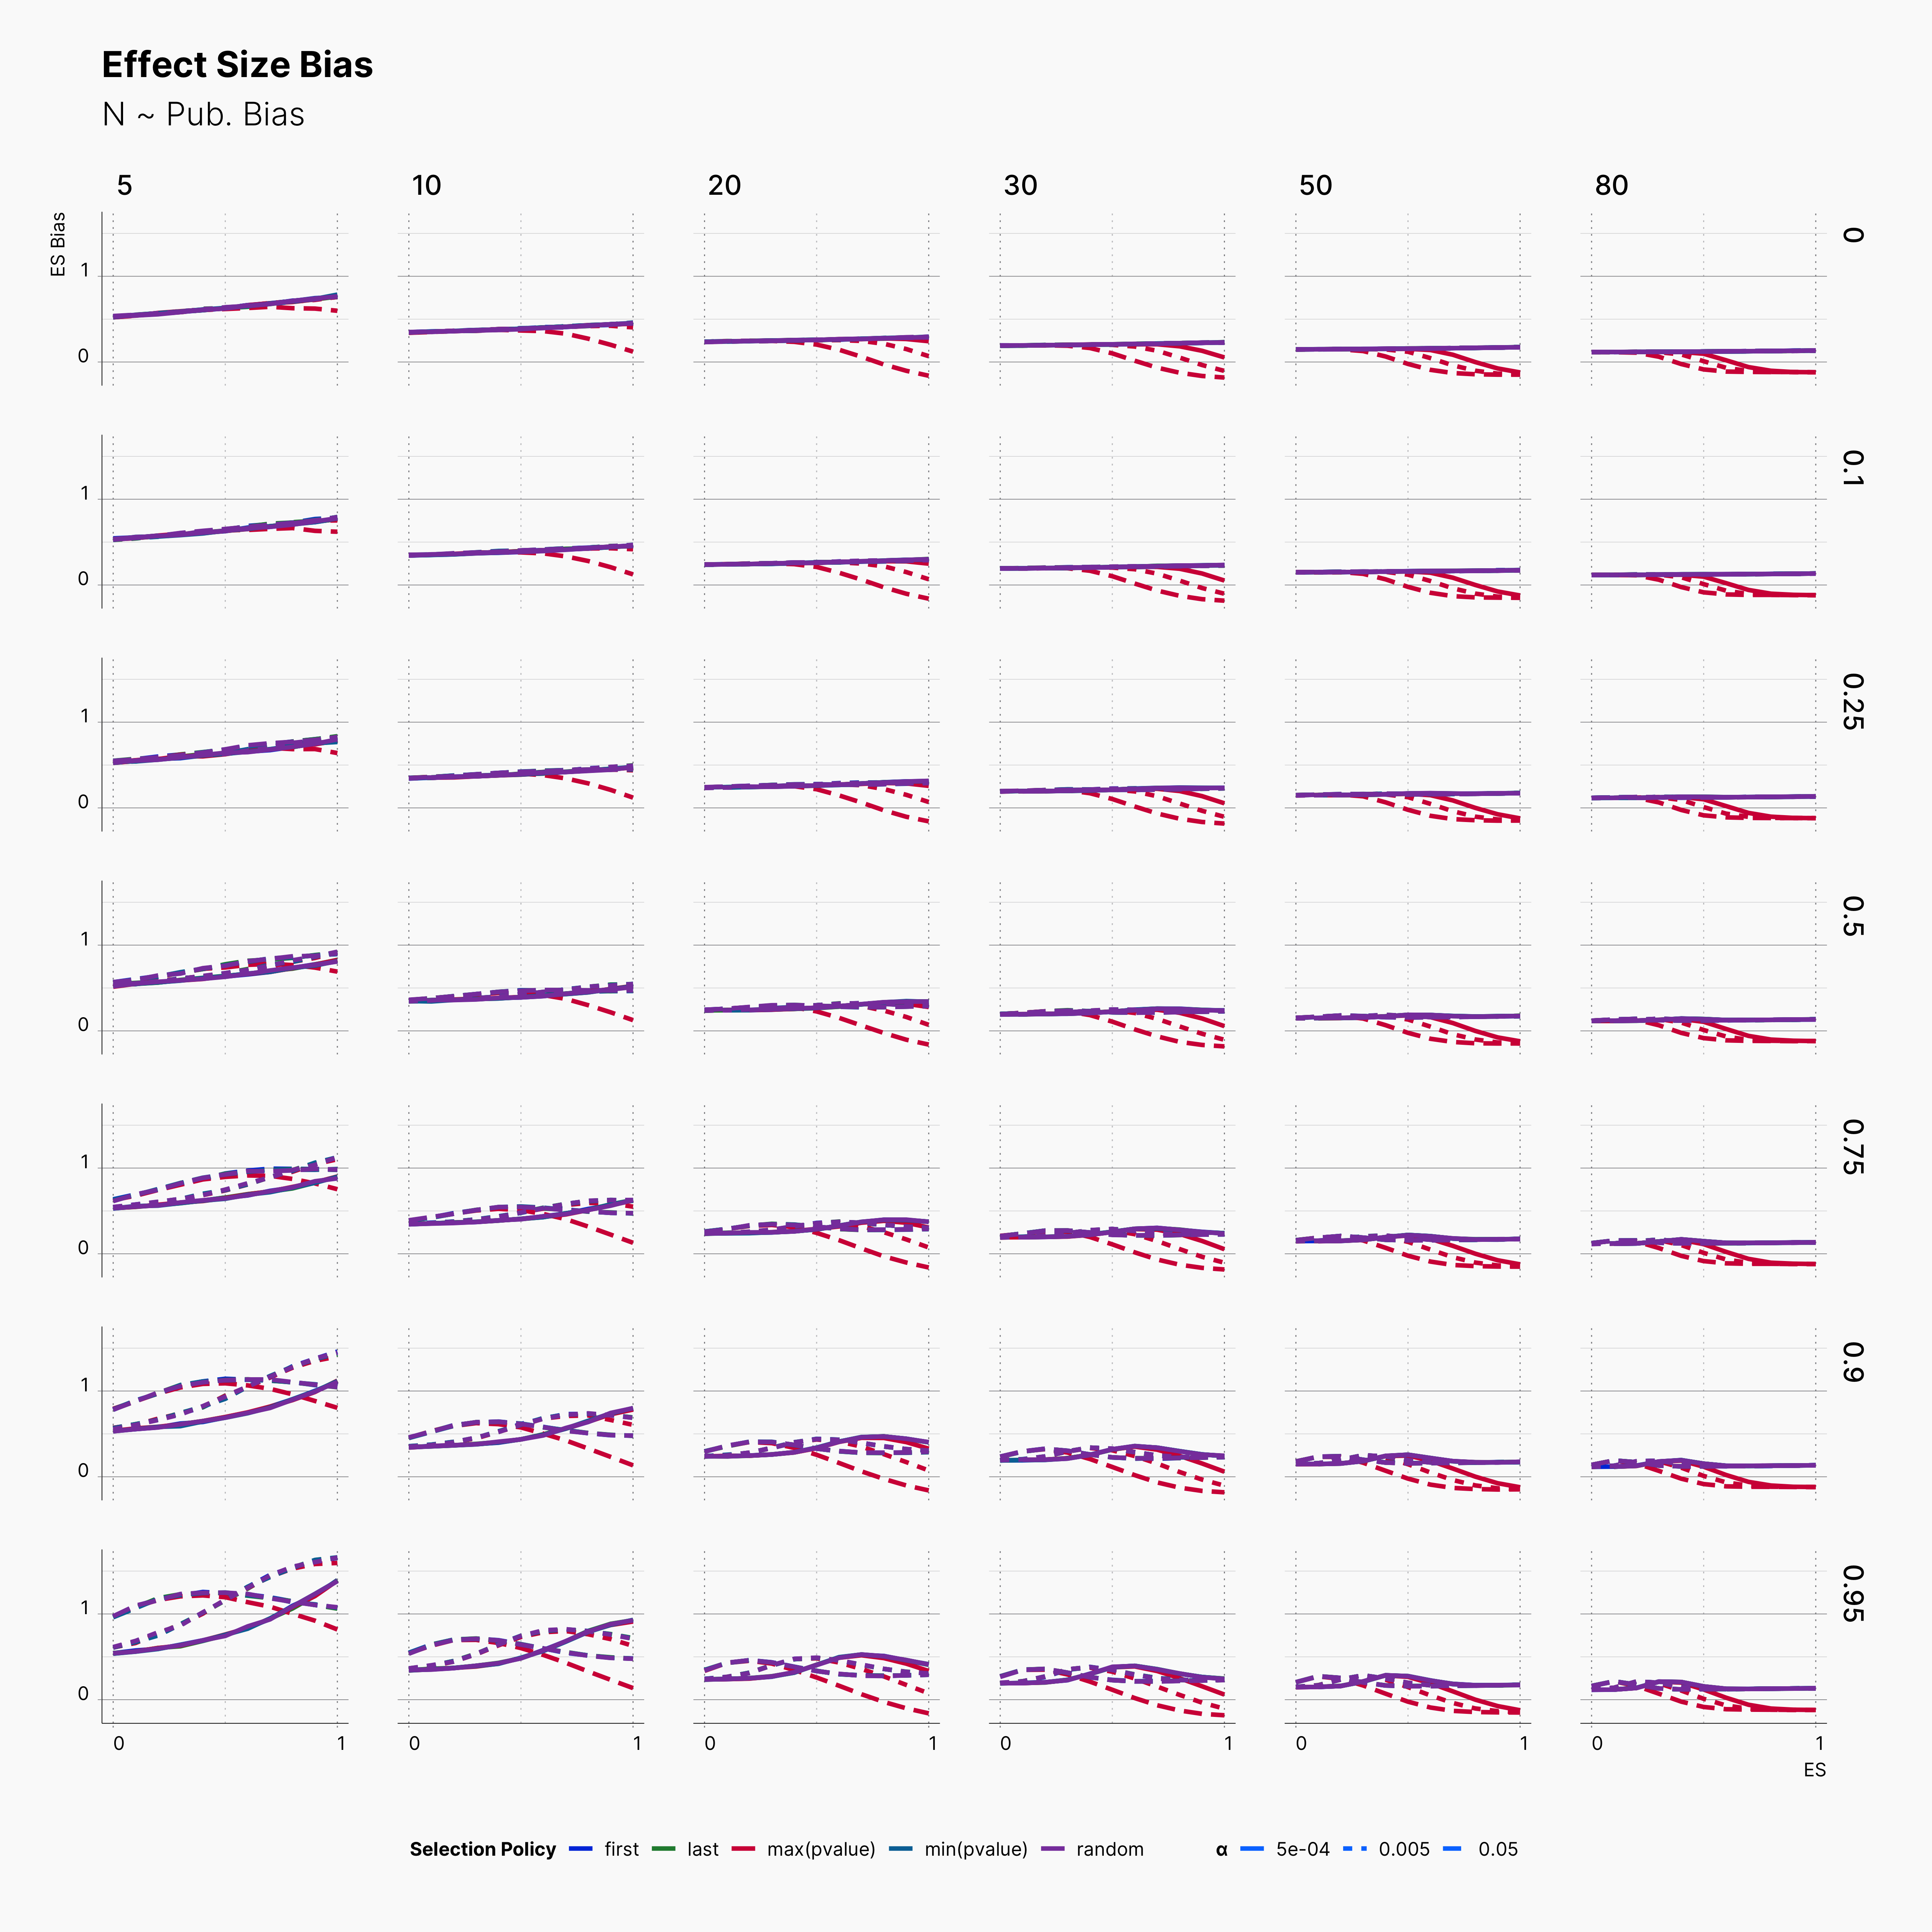
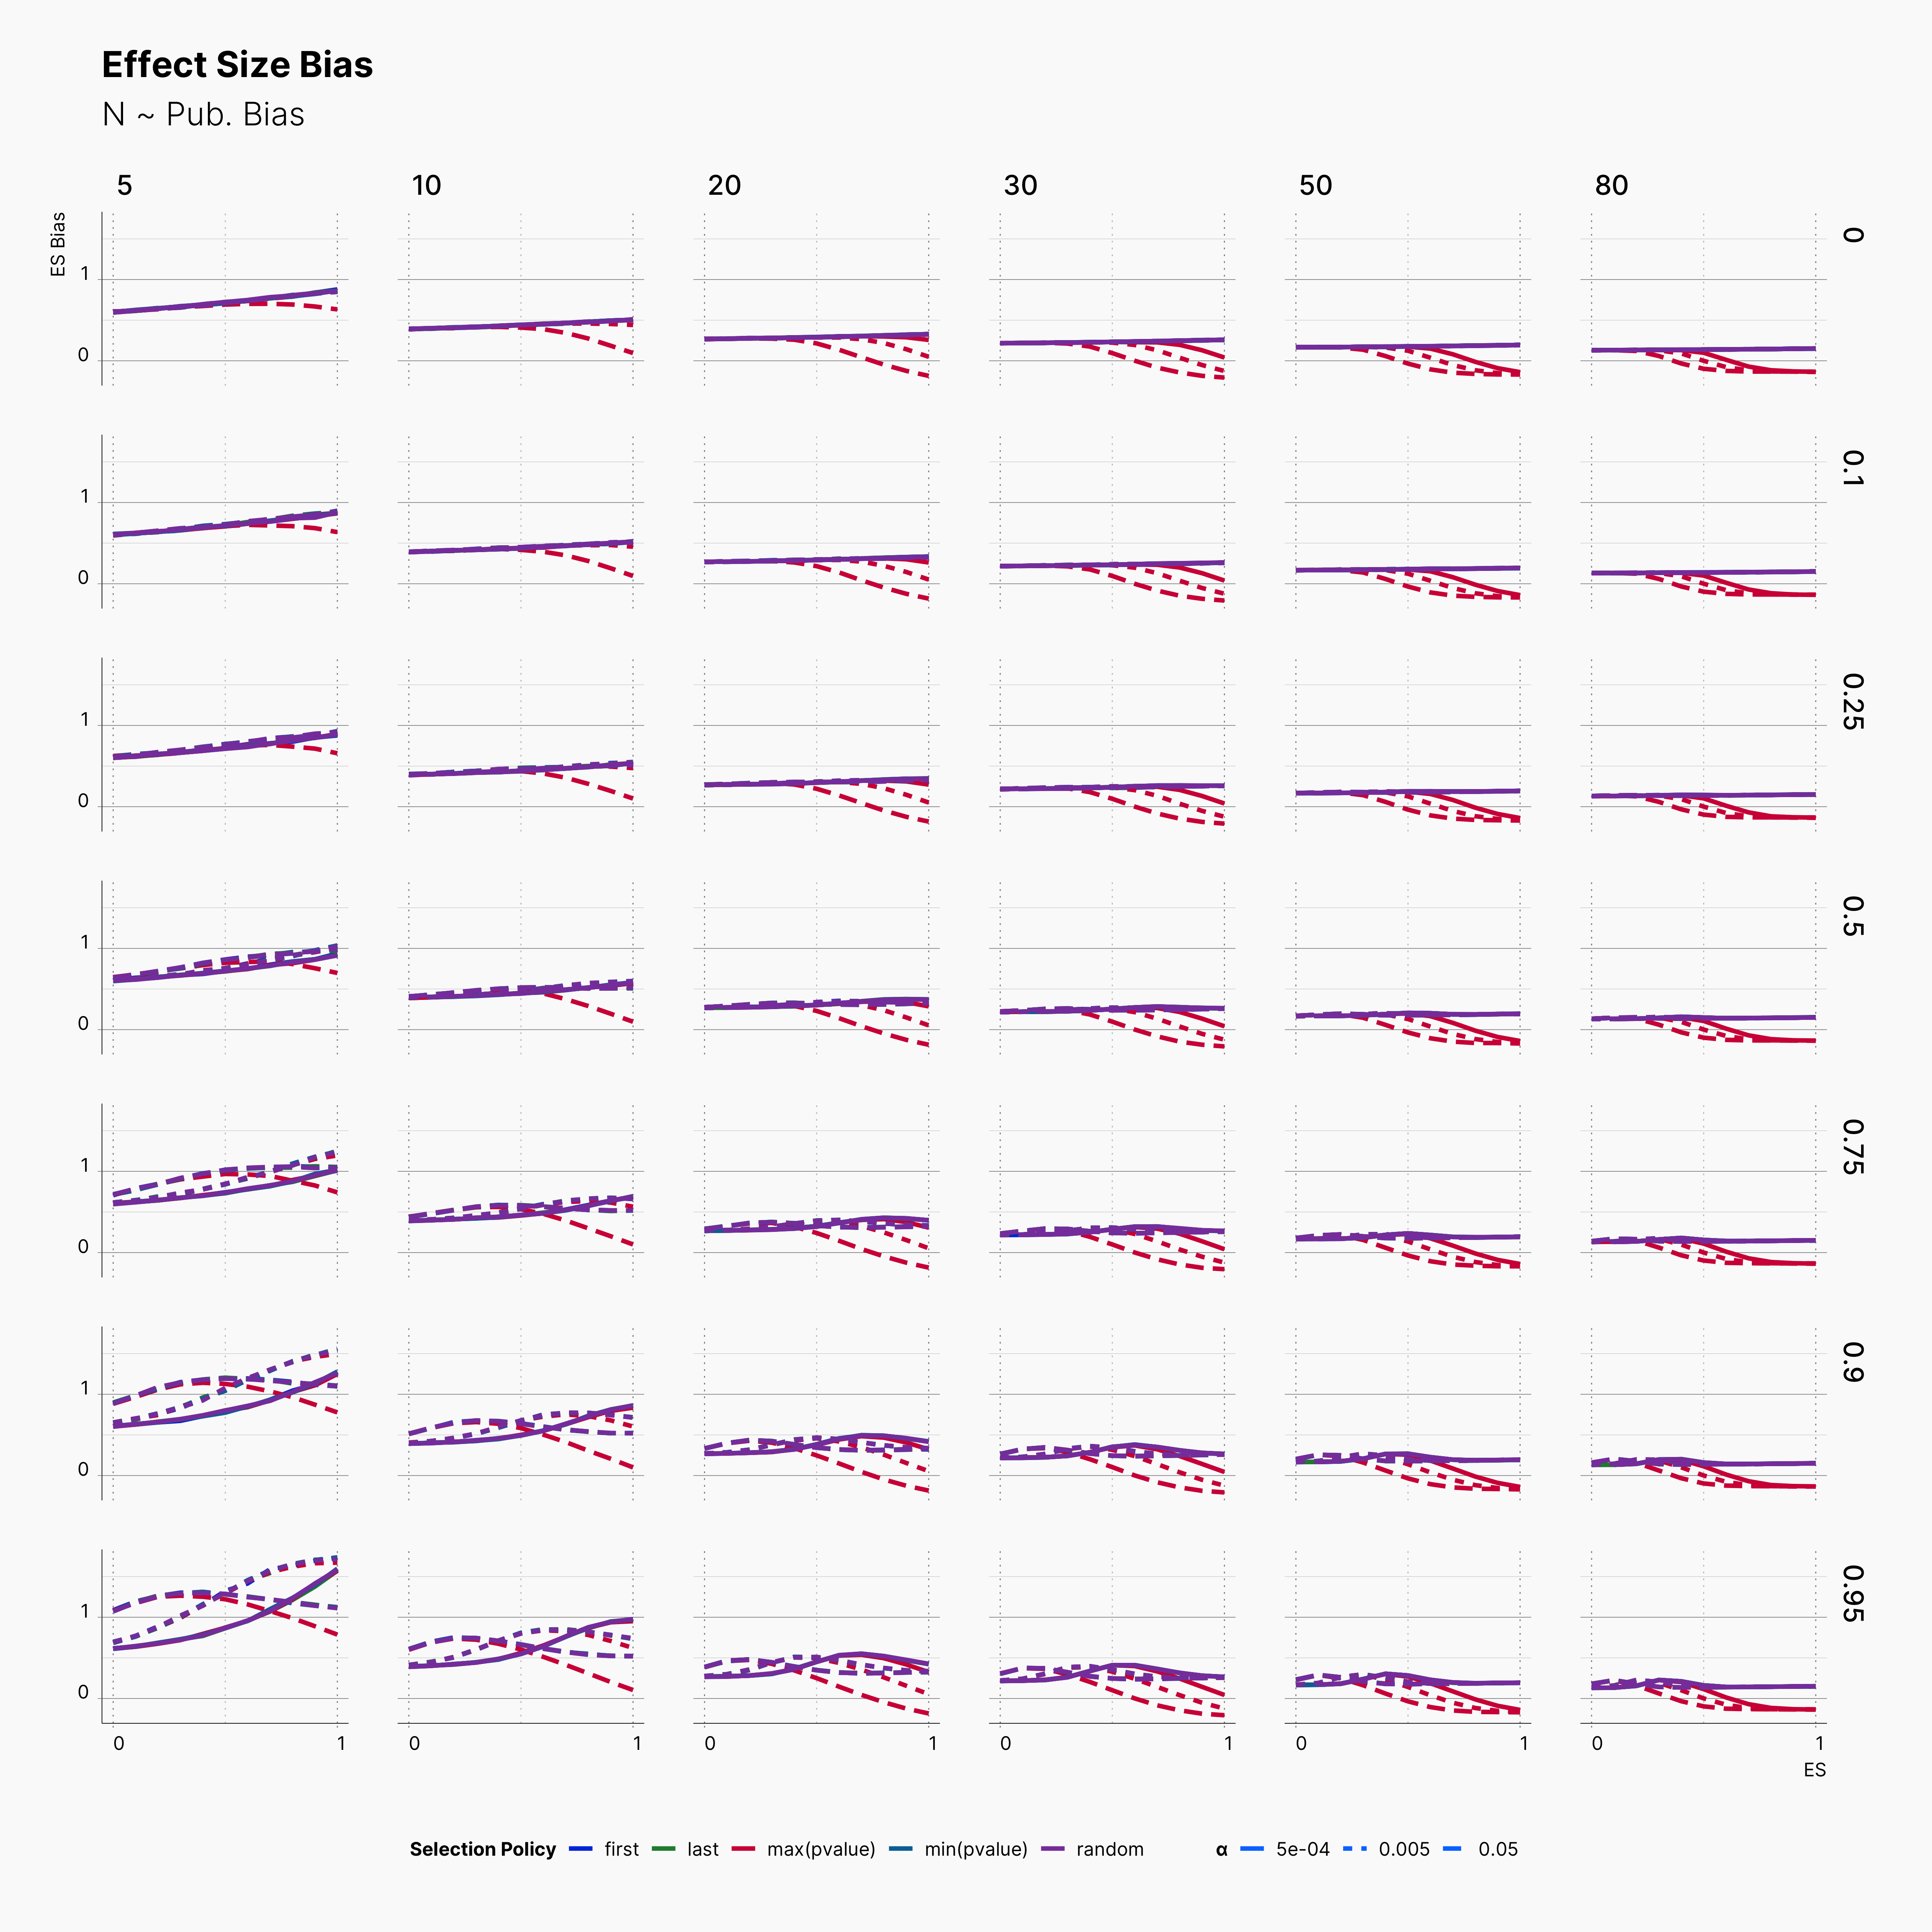
More importantly, notice the effect of ɑ on trends of bias within rows with higher publication bias. While lower ɑ generally lowers the level of bias, it does not behave linearly. Looking at studies with N = 20, m ∈ {2, 3, 4, 5}, and Pb = 0.95, we can see that lines with different ɑ will cross each other at least once as we move toward higher true effect sizes, θ. In fact, while lowering ɑ reduce the level bias in studies with lower true effect sizes, it promotes publications with higher bias within larger true effect sizes.
Mean of Significant P-values
Next, in order to investiage a bit deeper, we look into the distribution of significant p-values by looking at their mean withing our selected range of parameters.
As expected, we can see that in every row, average p-value drops as we approach higher effect sizes, with max(pvalue) having slower decline compared to all other choices. Another interesting observation is the steady trends of average signififcant p-values for ɑ ∈ {0.005, 0.0005} where in both cases we do not see a large variation. Basically, significant outcomes captured with these ɑ-levels stays strongly significant in the entire range of θ. This is in contrast to trends seen with ɑ = 0.05, as we see variable significance-y level within the range of N, and Pb. In addition, while both publication bias and sample size variation influence the intensity of significance at ɑ = 0.05, they barely influence it within other ɑ levels.
